Abstract
In order to further enhance the stability of the orbital transportation, the modal characteristics of the orbital support structure were simulated and analyzed. The multi-objective optimization method was applied to design the structure for lightweighting while increasing the first-order natural frequency and reducing the stress peak. Using ANSYS Workbench, the parametric finite element model was established, the length of the intermediate support rod, and the lateral length of the rib were regarded as the parameterized dimensions. Through dynamic characteristic analysis, the natural frequencies, modal shapes, and harmonic response characteristics were obtained. Parametric samples were obtained by using Latin square method, and the approximate model was fitted by polynomial function. Multi-Objective Genetic Algorithm and Sequential Quadratic Programming were applied for optimization calculation. The results indicate that the structurally lightened design can attain higher strength and stiffness.
Highlights
- The multi-objective optimization method was applied to design the structure for lightweighting while increasing the first-order natural frequency and reducing the stress peak.
- Using ANSYS Workbench, the parametric finite element model was established, the length of the intermediate support rod, and the lateral length of the rib were regarded as the parameterized dimensions.
- Through dynamic characteristic analysis, the natural frequencies, modal shapes, and harmonic response characteristics were obtained.
1. Introduction
In certain material transport scenarios, there may be very high requirements for precision and stability of motion, so guide rail conveyance can be used. The material transport structure for gears in an automated production line mainly includes orbital support, drive motor, and workbench. When the drive motor operates, it generates significant vibration excitation, which not only causes displacement response of the guide rail but also increases the noise of the equipment [1, 2]. Therefore, modal analysis is very necessary [3, 4]. Modal analysis enables the acquisition of crucial parameters, such as the natural frequencies and vibration modes, which are indispensable for optimizing design strategies [5, 6]. These parameters are of paramount significance in guaranteeing stable operation even under arduous operational circumstances, thereby enhancing the stability and responsiveness of the structure. Additionally, modal analysis can prognosticate the reaction of the structure to external forces, facilitating the adoption of appropriate measures to fortify its stability and response capabilities. In the conventional design of orbital supports, to guarantee safety, a rather large safety factor is frequently employed, which might potentially lead to an irrational distribution of the structure to a certain degree. Therefore, a multi-objective optimization method is applied, which can effectively reduce weight while ensuring stiffness and strength, achieving good economic and social benefits. Multi-objective optimization is different from traditional single-objective optimization. The result of multi-objective optimization is a set of optimal solutions obtained on the basis of Pareto, and the desired solutions are selected to optimize resource allocation, making the overall goal as optimal as possible.
2. Dynamic response of the orbital support structure
2.1. The establishment of finite element model
The principle of the guideway transport system is shown in Fig. 1(a), where it can be seen that the orbital support structure, as a key load-bearing component, is always subjected to both gravity loads and complex dynamic loads. As shown in Fig. 2(a), the orbital support structure consists of support leg, guide rail, reinforcing rib, and other components. The dimensions of these components are critical to the modal characteristics and strength of the model. To facilitate the multi-objective optimization of the model, parameterized modeling is requisite. In the process of optimization analysis, the selection of design variables should not affect assembly dimensions and should not interfere with working limit conditions. Grounded on the structural characteristics of the model, the width of the support leg , the length of the intermediate support rod , and the lateral length of the rib are regarded as the parameterized dimensions. The range of values for design variables is shown in Table 1. The three selected design variables not only do not affect the overall assembly dimensions, but also do not exceed their respective constraint boundaries, leading to unreliable or even failed designs, which has a higher engineering feasibility. In order to ensure the accuracy and efficiency of the calculation, unnecessary features such as chamfers and fillets that have a minimal impact on the analysis results need to be removed. In terms of load and constraint settings, complex models such as the drive motor are removed and their mass is converted into a load applied to the corresponding contact surface. After simplifying the model, material types and related properties need to be set, as shown in Table 2.
Fig. 1Structure and modeling of orbital support
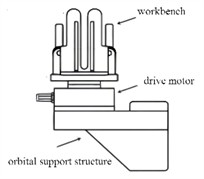
a) Structure composition and principle
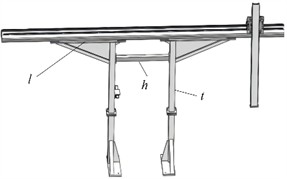
b) Structure of orbital support
Table 1The range of values for design variables
Parametric dimensions | / mm | / mm | / mm |
Initial value | 228 | 309 | 97 |
Upper limit value | 248 | 327 | 109 |
Lower limit value | 208 | 243 | 81 |
Table 2Material properties
Component | Density / (kg/m3) | Modulus of elasticity / MPa | Poisson’s ratio |
Support leg | 7890 | 20900 | 0.269 |
Guide rail | 7890 | 21700 | 0.270 |
Reinforcing rib | 7860 | 21900 | 0.300 |
2.2. Analysis and discussion of results
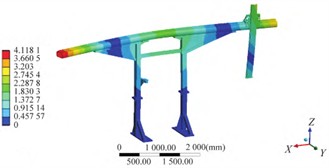
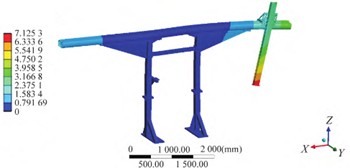
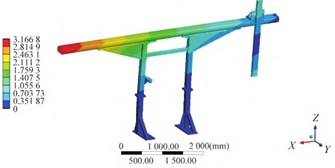
In order to provide effective base data for multi-objective optimization, a coupled module was established based on the ANSYS Workbench platform. The modal module was added to the static structure module in the solution, and the modal analysis was calculated using the subspace method. Additionally, since the vibrations generated by the driving motor can have a significant impact on the entire support structure, a harmonic response analysis was also conducted, and the unsuitable working frequency range of the motor was determined based on the analysis results, in order to avoid resonance as much as possible. Through continuous iterative calculations, the first eight natural frequencies and the first four modal shapes of the model can be obtained, as shown in Table 3 and Fig. 2.
According to the simulation calculation results, the first-order natural frequency is 5.89 Hz, which corresponds to the main modal vibration pattern of rotating around the axis. Since the maximum working speed of the driving motor is 300 r/min, which is the excitation frequency of 5 Hz, it is close to the first-order vibration mode, it is necessary to optimize the first-order natural frequency. If it works in the resonance frequency band, it may cause the end effector to collide and lead to failure of material transport.
Table 3The first eight orders of natural frequencies and vibration descriptions
Order | Frequency / Hz | Vibration descriptions |
1 | 5.890 | The entire structure rotates around the -axis |
2 | 7.632 | The beam rotate around the -axis |
3 | 13.716 | The entire structure swings left and right around the -axis |
4 | 16.152 | The vertical module swings back and forth around the -axis |
5 | 31.434 | The ends of the beam swing back and forth |
6 | 34.736 | The vertical module swings back and forth around the -axis |
7 | 44.528 | The beam and vertical module rotate around the -axis |
8 | 56.134 | The ends of the beam swing up and down |
Fig. 2The first six effective modal shapes
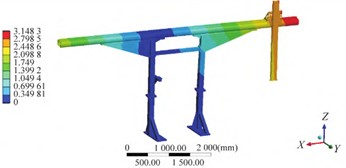
a) The firs order
b) The second order
c) The fourth order
d) The fifth order
Harmonic response analysis reflects the dynamic characteristics of the structure under different frequency sinusoidal (harmonic) loads, thus verifying whether the design can overcome resonance, fatigue, etc. The driving motor may have a bias due to processing, assembly errors, etc., and an additional external load will be caused by the bias during rotation. By adding the harmonic response module to the modal module, the harmonic response analysis is performed separately for the motor during operation using modal superposition method based on the modal analysis results. According to the actual situation and modal analysis results, the frequency range of 0-50 Hz and frequency interval of 1 Hz are selected, and the displacement-frequency curve at the center of mass is obtained, as shown in Fig. 3. It can be seen that when the drive motor works at frequencies of 5-7 Hz, 13-17 Hz, 30-33 Hz, and 43-46 Hz, there are extreme values of displacement in the , , and axes, indicating that the drive motor working at these frequencies will cause the actuator connected to the end of the column to resonate and produce positioning accuracy errors. These frequencies basically include the first few natural frequencies obtained from the modal analysis.
3. Optimization and analysis of the orbital support structure
3.1. Construction of agent model
One of the crucial aspects in establishing a response surface surrogate model lies in selecting the appropriate number of sample points in the experimental design and arranging them rationally within the design space, which entails the choice of an experimental design approach. Due to the relatively smooth and regular structure of the model, a quadratic polynomial function is employed to construct the response surface, which can furnish significant information regarding the design variables and experimental error with the minimum number of experiments and boasts the merits of simple design, excellent predictability, and high modeling efficiency. For the design of sample parameters, based on the Latin square method, a discrete data set of design variables and optimization objectives is obtained as presented in Table 4. The objective function and its parameters fail to demonstrate a continuously linear response, thereby posing a challenge for accurately expressing the first-order response. In this research, we select a quadratic response formulation to represent the response surface function, considering that the optimization scale of the partial structure is relatively narrow and the variation of the response surface with respect to the independent variables is rather subtle.
Fig. 3Results of harmonic response analysis of center of mass
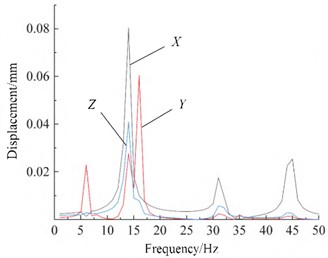
Table 4Sample design for parameters
Number | / mm | / mm | / mm | / kg | / Hz | / MPa |
1 (Initial value) | 228 | 309 | 97 | 996.3 | 5.89 | 25.79 |
2 | 230 | 285 | 103 | 941.7 | 5.42 | 23.69 |
3 | 208 | 291 | 81 | 916.7 | 5.47 | 21.21 |
4 | 245 | 243 | 101 | 854.8 | 5.08 | 26.49 |
5 | 211 | 255 | 83 | 830.5 | 4.96 | 26.46 |
6 | 208 | 249 | 109 | 810.7 | 4.89 | 20.82 |
7 | 241 | 321 | 99 | 1047.7 | 5.23 | 21.36 |
8 | 238 | 303 | 107 | 998.6 | 6.03 | 21.22 |
9 | 225 | 261 | 89 | 867.4 | 6.12 | 28.23 |
10 | 248 | 297 | 87 | 994.2 | 5.87 | 22.19 |
11 | 218 | 273 | 93 | 888.6 | 5.39 | 26.56 |
12 | 215 | 315 | 85 | 988.6 | 6.22 | 22.79 |
13 | 221 | 279 | 95 | 909.4 | 5.17 | 22.07 |
14 | 208 | 327 | 105 | 1003.1 | 6.32 | 25.91 |
15 | 235 | 267 | 91 | 1098.4 | 4.78 | 21.62 |
Table 5Error criteria for different optimization objectives
Target parameters | (Optimal value is 1) | RMS (Optimal value is 1) | RMAE (Optimal value is 1) | RAAE (Optimal value is 1) |
1 | 4.2e-5 | 0 | 0 | |
1 | 0.003 | 0.31 | 0.10 | |
1 | 0.014 | 0.23 | 0.22 |
Once the second-order polynomial response surface surrogate model for weight, maximum equivalent stress, and first-order natural frequency has been constructed, it is imperative to undertake a precision validation of the established response surface surrogate model to ascertain whether it possesses adequate accuracy and can substitute the actual engineering model for the subsequent lightweight design. In numerous practical engineering design issues, it is frequently indispensable to concurrently fulfill multiple design criteria to attain an optimal condition, which constitutes an extremely challenging and intricate problem. Such problems frequently emerge in diverse domains of engineering design. To address this complex problem, multi-objective optimization approaches are requisite for obtaining the optimal solution. This approach demands simultaneous consideration of various design objectives and their integration to achieve a state of simultaneous optimality for multiple objectives. n the realm of multi-objective optimization design, it is of paramount importance to admit that an inevitable certain degree of disparity exists between the response surface model and the actual response values. This variance can exert a significant influence on the reliability of the optimization procedure. To guarantee the accuracy of the fitting function, it is indispensable to verify its precision. If this error lies within an acceptable limit, it implies that the optimization function is feasible. The results of error verification are shown in Table 5, where it can be seen that the errors of the three optimized objectives all meet the requirements.
4. Validation of optimization results
In the process of optimization analysis, the optimization objective is set to the minimum value of mass, the boundary conditions are set to the first natural frequency not lower than the initial value, and the maximum stress does not exceed the initial value. Once the fitting and validation of the response surface function have been accomplished, the selection of an appropriate optimization algorithm proves indispensable for ascertaining the extremum of this function. Taking into account the lightweight design requisites, we formulate an optimization mathematical model that transforms the objectives associated with stress and natural frequency into boundary conditions. This tactic is aimed at minimizing the component’s weight while guaranteeing that neither the natural frequency declines nor the maximum stress escalates.
Fig. 4Modal shape results of optimized structure
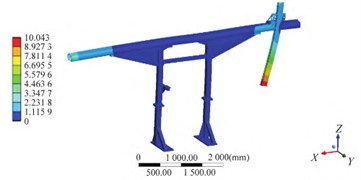
a) The firs order
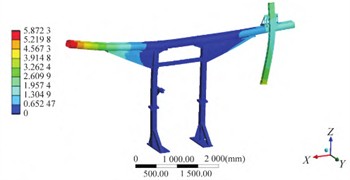
b) The second order
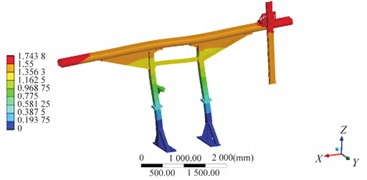
d) The fourth order
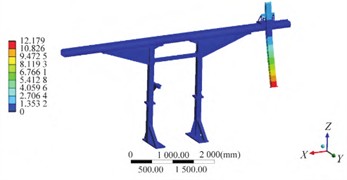
e) The fifth order
The parameters and target extreme values were obtained by using the Multi-Objective Genetic Algorithm (MOGA) and Sequential Quadratic Programming (NLPQL) for optimization calculation, respectively, as shown in Table 6. The modal shapes, displacement and stress distributions of the optimized structure are shown in Fig. 4 and Fig. 5, respectively. The results disclose that through design optimization, the maximum weight reduction of 2.82 % can be attained, accentuating the considerable lightweight advantages offered by both utilized algorithms. The optimized structure can effectively ensure the stiffness and strength of the orbital support structure. Under the working load condition, the maximum stress is 22.63 MPa, and the maximum deformation is 0.75 mm.
Table 6Lightweight analysis results
Optimization algorithm | / mm | / mm | / mm | / kg | / Hz | / MPa | Weight loss rate / % |
Initial value | 228 | 309 | 97 | 996.3 | 5.89 | 25.79 | / |
NLPQL | 216 | 317 | 84 | 968.2 | 6.33 | 22.63 | 2.82 % |
MOGA | 221 | 314 | 85 | 969.5 | 6.55 | 23.63 | 2.69 % |
Fig. 5Strength analysis of optimized structure
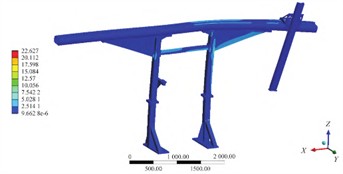
a) The stress of optimized structure
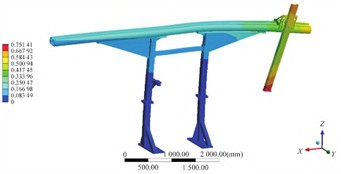
b) The displacement of optimized structure
5. Conclusions
The dynamic response characteristics are the key factors that determine the stability of the orbital support structure. Based on the finite element analysis method, modal analysis and harmonic response analysis can be achieved to determine the corresponding modal parameters and relatively weak positions, and the critical dimensions are used as design variables for structural optimization. Since the first-order natural frequency is close to the excitation frequency of the driving motor at the maximum working speed, it is necessary to lighten the structure while raising the natural frequency. A multi-objective optimization method based on DOE is applied, and the intrinsic relationship between the optimization objectives and design variables is established through the establishment of response surface functions. The research results show that the optimized structure can reduce the mass by 2.82 %, raise the first-order natural frequency by 7.5 %, and reduce the maximum stress by 8.4 %.
References
-
C. Liu, H. Zhang, S. Wang, Y. Wang, G. Lei, and J. Zhu, “Multiphysical design and optimization of high-speed permanent magnet synchronous motor with sinusoidal segmented permanent magnet structure,” Journal of Electrical Engineering and Technology, Vol. 19, No. 3, pp. 1459–1473, Sep. 2023, https://doi.org/10.1007/s42835-023-01629-2
-
B. A. Kardile and K. A. Pathan, “Simulation-based study of noise, vibration, and harness of BLDC motor for energy level variation with frequency,” Journal of Physics: Conference Series, Vol. 2604, No. 1, p. 012003, Sep. 2023, https://doi.org/10.1088/1742-6596/2604/1/012003
-
V. Nicoletti, R. Martini, L. Amico, S. Carbonari, and F. Gara, “Operational modal analysis for supporting the retrofit design of bridges,” ce/papers, Vol. 6, No. 5, pp. 1182–1188, Sep. 2023, https://doi.org/10.1002/cepa.2125
-
M. Sohrabifard, M. Nategh, and M. Ghazavi, “Evaluation, calibration, and modal analysis for determination of contact stiffness between workpiece and components of milling fixture,” Proceedings of the Institution of Mechanical Engineers, Part B: Journal of Engineering Manufacture, Vol. 237, No. 12, pp. 1819–1835, Nov. 2022, https://doi.org/10.1177/09544054221138165
-
J. Ghorbani, A. Sounthararajah, T. T. Dutta, and J. Kodikara, “Modelling rapid non-destructive test using light weight deflectometer on granular soils across different degrees of saturation,” Journal of Rock Mechanics and Geotechnical Engineering, Vol. 16, No. 7, pp. 2732–2748, Jul. 2024, https://doi.org/10.1016/j.jrmge.2023.11.026
-
I. Aarab, K. E. Amari, A. Yaacoubi, A. Etahiri, and A. Baçaoui, “Optimization of the flotation of low-grade phosphate ore using doe: a comparative evaluation of fatty acid formulation to sodium oleate,” Mining, Metallurgy and Exploration, Vol. 40, No. 1, pp. 95–108, Dec. 2022, https://doi.org/10.1007/s42461-022-00706-w
About this article
The authors have not disclosed any funding.
The datasets generated during and/or analyzed during the current study are available from the corresponding author on reasonable request.
The authors declare that they have no conflict of interest.
