Abstract
The modal characteristics are an important basis for measuring the stability and safety of the truss roof structure. Based on the finite element method, the modal calculation of the overall structure of the truss roof was carried out, and the first six-order modal shapes and natural frequencies were obtained. The modal test method was adopted to test and analyze the vibration response of the truss roof through the hammering method, verifying the accuracy and effectiveness of the modal simulation. According to the analysis results of the modal shapes, the structure was reinforced at the weak positions. The thickness of the end face was reduced by 1 mm, and five ribs at the connection between the panel and the lateral beam were add. Through the modal calculation, the dynamic response of the optimized structure was obtained. The results show that the optimized structure can significantly increase the natural frequency, reduce the vibration amplitude, avoid the low-frequency resonance problem, and meet the lightweight design requirements at the same time, which is of obvious help for the improvement of the truss performance.
Highlights
- Based on the finite element method, the modal calculation of the overall structure of the truss roof was carried out, and the first six-order modal shapes and natural frequencies were obtained.
- The modal test method was adopted to test and analyze the vibration response of the truss roof through the hammering method, verifying the accuracy and effectiveness of the modal simulation.
- According to the analysis results of the modal shapes, the structure was reinforced at the weak positions.
1. Introduction
The stability of mechanical structures is the key factor affecting vibration and noise [1, 2]. Truss roofs not only have strong structural stability, low construction costs, easy installation and removal, but also effectively promote the development of new structural systems and have good application prospects. Truss structures are exposed to complex environmental conditions over extended periods [3]. Vibrations induced by crane loads, strong winds, and rainfall can result in varying degrees of material property degradation, connection strength between components, and even sudden safety incidents. Therefore, modal analysis is of paramount importance and represents a critical factor in ensuring structural safety [4]. The inherent characteristics of truss roof structures primarily include natural frequencies and modes. Modal analysis is a process of describing the inherent properties of the structure using these dynamic parameters [5, 6]. The truss roof is a multi-degree-of-freedom vibration system, in which each structural element has its own natural frequency and modal shape. Conducting a modal analysis of the truss roof essentially entails reducing a multi-degree-of-freedom vibration system to a finite-degree-of-freedom one. Computational modal analysis has the capacity to convert the physical coordinates within the linear time-invariant dynamic differential equation into modal coordinates, decouple the set of linear time-invariant dynamic differential equations, and acquire a set of new independent differential equations, thereby computing the modal parameters of the structural system. According to the modal analysis results, effective and accurate structural optimization schemes can be proposed to improve and enhance the safety and reliability of the truss canopy.
2. Modal analysis of the overall structure
2.1. The establishment and setting of finite element model
The roof structure being studied is an assembly system made up of steel pipe trusses and straight panels, as shown in Fig. 1. Compared with other types of steel structural beams, the tube structure has a smaller mass and a more attractive overall appearance, so it has been widely used in the design of airports, offshore platforms, and large sports stadiums. Additionally, the smooth surface of the circular tube structure reduces the resistance experienced by each part of the structure when subjected to wind loads, thereby enhancing the overall stability of the structure. The truss structure has better transparency than other structures, making it very suitable for construction in areas with frequent winds. It is precisely because of the superior advantages of the steel pipe truss structure that it has been fully applied in many engineering projects and bridges. Since the external environment excitation frequency of the truss roof is generally within 70 Hz, the dynamic characteristics are mainly studied in this frequency range. The model is partitioned into two substructures, namely the shed surface and composite truss beam, based on the division principle of substructures in modal comprehensive analysis The modal analysis of truss roof structures is based on the geometric shape, boundary conditions, and material properties of the structure. The finite element model includes the mass matrix, stiffness matrix, and damping matrix of the structure, and the multi-order modal parameters of the structure are obtained based on this. One key aspect of the modal analysis process is not considering the force vector in the equation, mainly by solving the eigenvalue problem of the equation, successively obtaining the eigenvalue, eigenvector, where the obtained eigenvalue is the modal frequency, and the eigenvector is the modal vibration mode.
Fig. 1Structure and modeling of truss roof


2.2. Modal simulation based on finite element method
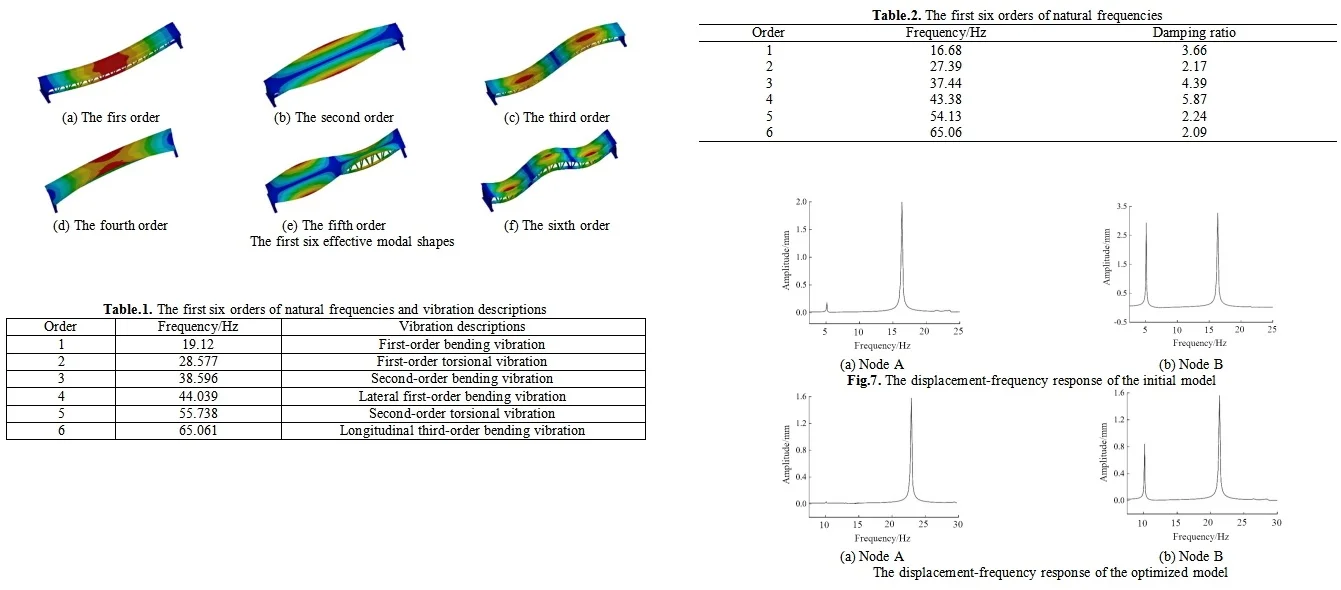
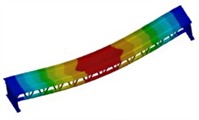
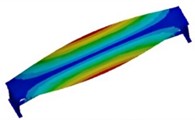
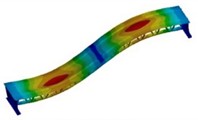
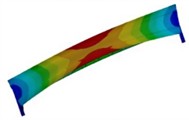
The modal analysis of structures is the basis of dynamic analysis, through which the natural frequencies and corresponding modal shapes of the structure can be determined, and the combination forms of structural vibrations can be understood. This can help avoid resonance in structural design and determine relevant control parameters for other dynamic analyses. In recent years, with the continuous development of computer technology, various finite element analysis software, such as ABAQUS, ANSYS, and Nastran, have also developed rapidly and been widely used. Among them, ANSYS is the most representative finite element analysis software, capable of performing coupled analyses in various physical scenarios. It has widespread applications in various fields, including aerospace and defense, automotive design, mechanical manufacturing, and civil engineering. Through finite element analysis based on ANSYS, the first six effective modal shapes can be obtained as shown in Fig. 2.
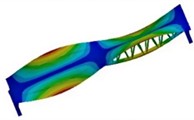
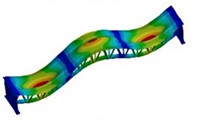
From the modal shape diagram, it can be seen that the maximum deformation of the modal shape at 19.12 Hz corresponds to the middle position of the entire truss; the maximum deformation of the modal shape at 28.577 Hz corresponds to the middle position of the edge of the roof and the lower edge of the longitudinal beam in the middle; the maximum deformation of the modal shape at 38.596 Hz corresponds to the two points where the panel is divided into four equal parts; the maximum deformation of the modal shape at 44.039 Hz corresponds to the middle position of the edge of the roof; the maximum deformation of the modal shape at 55.738 Hz corresponds to the edge of the roof; the maximum deformation of the modal shape at 65.061 Hz corresponds to the three points where the panel is divided into six equal parts. The descriptions of different modal shapes are shown in Table 1. Each modal shape is accompanied by detailed information regarding its frequency, amplitude, and mode of vibration. The table provides a comprehensive overview of the various modal shapes observed within the system under study, allowing for a clear understanding of their distinct characteristics and behaviors. Additionally, it serves as a valuable reference for further analysis and comparison with theoretical models or experimental data.
Fig. 2The first six effective modal shapes
a) The firs order
b) The second order
c) The third order
d) The fourth order
e) The fifth order
f) The sixth order
Table 1The first six orders of natural frequencies and vibration descriptions
Order | Frequency / Hz | Vibration descriptions |
1 | 19.12 | First-order bending vibration |
2 | 28.577 | First-order torsional vibration |
3 | 38.596 | Second-order bending vibration |
4 | 44.039 | Lateral first-order bending vibration |
5 | 55.738 | Second-order torsional vibration |
6 | 65.061 | Longitudinal third-order bending vibration |
2.3. Modal testing and verification
Experimental modal analysis (EMA) involves subjecting a test structure to vibration tests by applying impulses with a hammer or an exciter and collecting input and response data using sensors. The modal parameters of the structure are then identified using modal parameter identification methods. Vibration modal testing is an important step in truss monitoring research, and the test results have important guidance for verifying the accuracy of computed modal parameters. In modal testing, the signal acquisition instrument will convert the force signal of the truss vibration into an electrical signal. After all the vibration response data at the measurement points are collected, the natural frequency, modal shape, and damping ratio are obtained through parameter identification. The modal testing of steel tube trusses is performed by using the simple and easy-to-implement hammering method to excite the bridge surface. The hammering method is the most commonly used excitation method in modal testing of medium-sized and small structures, as the force hammer is easy to install, flexible, and provides uniform excitation force, making it convenient to conduct vibration characteristics research on most mechanical structures. The modal testing scheme is shown in Fig. 3, which involves instruments and equipment including a unidirectional acceleration sensor, an 8-channel distributed data acquisition system, a pulse impact hammer, and force sensors.
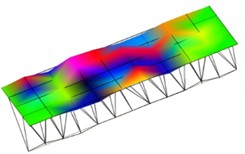
Using a force hammer to strike the roof surface, the acceleration sensor located at the modal reference point senses the vibration response of the bridge surface due to the excitation by the force hammer and collects it. Then, the vibration response data is transmitted to the signal acquisition instrument. In this stage, the acquisition instrument will eliminate the irrelevant high-frequency components, and then the analog signal is converted into a digital signal, finally outputting the time domain data file of the force signal and the response signal. Then the modal testing results can be obtained as in Fig. 4, and the first six orders of natural frequencies can be obtained as in Table 2. According to the test results of modal shape, the overall amplitude distribution of the truss roof is consistent with the simulation results, with the maximum vibration located at the center and the minimum located at the sides. However, there are obvious deviations in local areas, as the physical model has uneven mass and density, leading to local error accumulation. Nevertheless, the overall impact on the natural frequency test is small, and the deviation from the simulation results is small. The maximum deviation of the first six nature frequencies is 6.75 %.
Fig. 3The modal testing scheme

Fig. 4The modal testing results

a) The arrangement of measurement points
b) The first order modal shape with EMA
Table 2The first six orders of natural frequencies
Order | Frequency / Hz | Damping ratio |
1 | 16.68 | 3.66 |
2 | 27.39 | 2.17 |
3 | 37.44 | 4.39 |
4 | 43.38 | 5.87 |
5 | 54.13 | 2.24 |
6 | 65.06 | 2.09 |
3. Optimization and analysis of truss structural
3.1. Optimization plan for structure
For the complex system of truss roof, if a minor structural damage occurs, it may result in very serious consequences. According to the modal analysis results, the weak links of the steel tube truss are located at the middle position of the longitudinal beams, the side edges, and the middle position. Under the premise of keeping the function, efficiency unchanged and not affecting the manufacturing process, this paper mainly modifies the end face and longitudinal beams of the truss roof in terms of dynamics. With the dimensions of the rib structure as the design variables, including width w, height h, and spacing l, as shown in Fig. 5. Keep the radial thickness of the longitudinal beam cylindrical surface constant, and set the floating range to 20 %. In ANSYS Workbench, set the optimization goal as the maximum value of the first-order natural frequency f, and the boundary condition as the mass m not being less than the initial value. The optimization of the structure is achieved based on the DOE method, which requires that the changes in the structure are real-time. Therefore, the parameterized model is established in the Design Modeler. It is known from the analysis objectives that when the mass does not decrease and the first-order natural frequency increases, the stiffness of the truss structure will be significantly improved. In the response surface function optimization module, the Kriging model is chosen to complete the approximation model fitting, and the sequential quadratic programming algorithm is used to perform the optimization calculation.
Fig. 5Optimization of truss structure

a) The rib structure
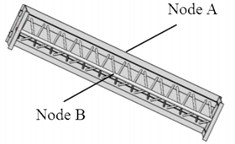
b) Initial structure
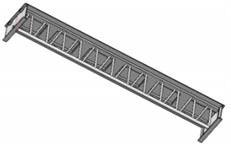
c) The reinforced structure
3.2. Validation of optimization results
The modal calculation results of the optimized structure are shown in Fig. 6. It can be seen that the modal vibration mode after reinforcement has little change in the displacement distribution and can effectively maintain the overall coordination. For the natural frequency, there is a significant increase. The structure exhibits first-order bending vibration at 24.066 Hz, first-order torsional vibration at 37.295 Hz, second-order bending vibration at 48.545 Hz, radial first-order bending deformation at 59.386 Hz, third-order bending deformation at 69.65 Hz, and second-order torsional vibration at 75.077 Hz.
Fig. 6Modal shape results of optimized structure

a) The firs order

b) The second order

c) The third order

d) The fourth order

e) The fifth order

f) The sixth order
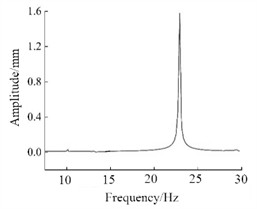
Fig. 7The displacement-frequency response of the initial model
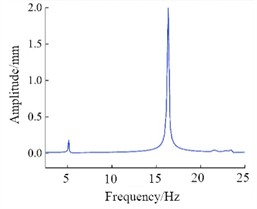
a) Node A
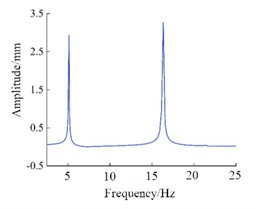
b) Node B
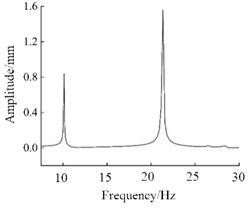
To verify the effectiveness of the structural reinforcement, the harmonic response analysis was applied for verification. Harmonic response analysis refers to the frequency response analysis conducted under multiple sinusoidal excitations with the same amplitude. In ANSY Workbench, the relationship between displacement response and frequency can be obtained by setting the load and boundary conditions, which can determine the response values of the structure under sinusoidal loading conditions. Harmonic response analysis can determine the response values of the structure under sinusoidal loading conditions. Under the condition of 1 g acceleration load, the displacement responses of nodes A and B in the initial model and the optimized model are presented in Fig. 7 and 8, respectively. It can be seen that the optimized structure can reduce the displacement at the center of the top by 21 %, and the displacement at the center of the bottom by 46 %, showing good strengthening effect.
Fig. 8The displacement-frequency response of the optimized model
a) Node A
b) Node B
4. Conclusions
Modal characteristics are key indicators for measuring the stability of truss structures. The finite element analysis software was used to conduct the computational modal analysis of the truss roof, and the corresponding modal parameters were identified. Meanwhile, the weak positions of the end face and longitudinal beams were determined, and the structural optimization was carried out for this. It provided a certain reference for the optimization design of the same type of truss structures. For the weak links of the truss roof, reinforcing plate bars were added at the connection between the end face and the transverse beam, and the thickness of the end face was reduced, completing the structural dynamic modification of the truss. Computational modal analysis was carried out on the modified structure, and the modal frequencies and deformation amounts before and after the modification were compared. The results show that the modal frequencies of the modified truss have increased to varying degrees, and at the same time, the relative maximum deformation amount has significantly decreased compared to before, which is of great help to the stability of the overall structure.
References
-
R. Talebitooti and M. R. Zarastvand, “The effect of nature of porous material on diffuse field acoustic transmission of the sandwich aerospace composite doubly curved shell,” Aerospace Science and Technology, Vol. 78, No. 7, pp. 157–170, Jul. 2018, https://doi.org/10.1016/j.ast.2018.03.010
-
R. Talebitooti and M. R. Zarastvand, “Vibroacoustic behavior of orthotropic aerospace composite structure in the subsonic flow considering the Third order Shear Deformation Theory,” Aerospace Science and Technology, Vol. 75, No. 4, pp. 227–236, Apr. 2018, https://doi.org/10.1016/j.ast.2018.01.011
-
M. R. Zarastvand, M. Ghassabi, and R. Talebitooti, “Acoustic insulation characteristics of shell structures: a review,” Archives of Computational Methods in Engineering, Vol. 28, No. 2, pp. 505–523, Dec. 2019, https://doi.org/10.1007/s11831-019-09387-z
-
M. Abdelnour and V. Zabel, “Modal identification of structures with a dynamic behaviour characterised by global and local modes at close frequencies,” Acta Mechanica, Vol. 235, No. 3, pp. 1471–1491, May 2023, https://doi.org/10.1007/s00707-023-03598-z
-
M. R. Zarastvand, M. Ghassabi, and R. Talebitooti, “A review approach for sound propagation prediction of plate constructions,” Archives of Computational Methods in Engineering, Vol. 28, No. 4, pp. 2817–2843, Aug. 2020, https://doi.org/10.1007/s11831-020-09482-6
-
M. Sohrabifard, M. Nategh, and M. Ghazavi, “Evaluation, calibration, and modal analysis for determination of contact stiffness between workpiece and components of milling fixture,” Proceedings of the Institution of Mechanical Engineers, Part B: Journal of Engineering Manufacture, Vol. 237, No. 12, pp. 1819–1835, Nov. 2022, https://doi.org/10.1177/09544054221138165
About this article
The authors have not disclosed any funding.
The datasets generated during and/or analyzed during the current study are available from the corresponding author on reasonable request.
The authors declare that they have no conflict of interest.

