Abstract
In order to improve the stability and reliability of modular steel structures and reduce design redundancy, a multi-objective optimization study was conducted based on modal analysis. The finite element method was used to obtain the natural frequencies and modes under actual constraint conditions through ANSYS. The first-order natural frequency was used as a constraint condition to rationally configure the dimensions of the modular steel structure, and lightweight design was carried out based on the response surface method. In order to meet the overall structural stiffness requirements, the weight of the structure was minimized as much as possible. The finite element analysis and modal verification of the optimized model were carried out to verify the optimization results that meet the design requirements. The results show that the weight of the model was reduced by 5.36 %, and the increase in the first-order natural frequency was 20.14 %. After analyzing and verifying the modal vibration mode structure, it was found that the optimized modal vibration mode structure could still meet the mechanical performance requirements, providing an important reference for research in the field of building engineering.
Highlights
- The finite element method was used to obtain the natural frequencies and modes under actual constraint conditions through ANSYS.
- The first-order natural frequency was used as a constraint condition to rationally configure the dimensions of the modular steel structure, and lightweight design was carried out based on the response surface method.
- In order to meet the overall structural stiffness requirements, the weight of the structure was minimized as much as possible.
1. Introduction
With the rapid advancement of construction technology and the evolving demands of the market, modular prefabricated steel frame systems present a novel approach to architectural design [1, 2]. This methodology is distinguished by its flexible layouts, multifunctionality, high structural load-bearing capacity, and expedited assembly processes. The core principle of modular construction lies in the prefabrication of components coupled with their efficient on-site assembly. Currently, research into integrated technologies for commercial modular housing remains nascent, predominantly focusing on low-rise structures. The connection nodes between modules demonstrate limited stiffness and insufficient seismic resistance [3, 4]. In a steel frame system composed of these modules, these connection points act as critical hubs for force transmission while also constraining relative movement between modules. Their performance has a significant impact on overall structural integrity, particularly concerning modal characteristics [5, 6]. To mitigate damage from external vibrations and various loads acting upon module connections, it is imperative that these nodes not only incorporate effective assembly methods and reliable force transfer mechanisms but also possess adequate stiffness and energy dissipation capabilities to endure intense vibrations, thereby satisfying both functional requirements and load-bearing standards for modular buildings. Consequently, this study proposes an optimized design strategy aimed at enhancing modal characteristics through lightweight solutions to improve cost-effectiveness; this holds substantial significance for advancing the application of modular construction practices within engineering contexts.
2. Modal analysis of modular framework
2.1. Development of the finite element model
In order to ensure the balanced bearing capacity and widespread application of modular steel structures, a modular assembly steel frame design scheme was proposed, as shown in Fig. 1(a). The lower module is connected to the column top plate with a single-way high-strength bolt through the horizontal connection plate, and then the upper module's column is welded to the horizontal connection plate to achieve the assembly and alignment of individual modules. The tensile and shear bearing capacity of the single-way high-strength bolt is stronger than that of the ordinary high-strength bolt, and the connection quality is guaranteed, effectively solving the connection problem of closed members. Each node has the advantages of high stiffness, effective vertical and square load transmission, clear structural load-bearing, convenient installation and construction, etc. The top beam is a suspended beam that only bears the roof load of the upper floor frame. Place the upper module column on the horizontal connection plate and weld it, ensuring that the welding space between the upper module column and the horizontal connection plate meets the welding requirements, i.e., the minimum clearance between adjacent module column walls should be 70 mm to 100 mm. The bottom beam is a floor beam that bears the dead load and live load from the wall plate and floor slab, and is the main load-bearing member. Based on the actual structure and dimensions, a three-dimensional model of the standard steel structure was developed. This model was imported into ANSYS/Workbench using an intermediate data format to facilitate data exchange with the finite element analysis software. Within the functional module, the modal analysis option was selected, and fundamental material properties, including density, Young’s modulus, and Poisson’s ratio, were defined. Given that the standard steel structure possesses an irregular geometry, a tetrahedral mesh approach was employed for grid generation, as illustrated in Fig. 1(b).
Fig. 1Finite element modal analysis model
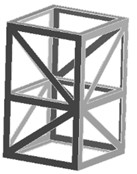
a) Modular steel structure
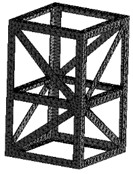
b) The result of grid division
2.2. Modal analysis
The primary objective of performing modal analysis on steel frame structures is to evaluate their vibrational characteristics across a range of frequencies, thereby ensuring stability and safety under external loading conditions. This analytical approach allows engineers to gain insights into the structural response at specific frequencies by calculating its natural frequencies and modes, which subsequently aids in design optimization and mitigates the risk of resonance. Through modal analysis, the first six natural frequencies of the model can be obtained, as shown in Table 1. In addition, the trend of the first twelve natural frequencies can be obtained as shown in Fig. 2. The results of the natural frequency analysis show that the first eight natural frequencies are relatively small under the constraint conditions. There is an abrupt increase in natural frequencies from the ninth order onwards. Due to the symmetry of the structure, the difference between the sixth-order natural frequency and the first-order natural frequency is only 3.92 Hz. For low-order vibrations, there is a considerable margin for overall stiffness improvement.
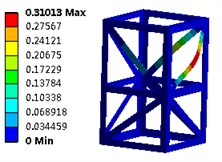
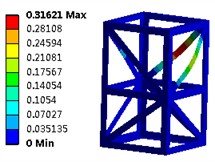
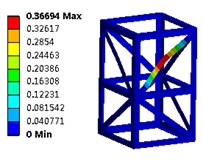
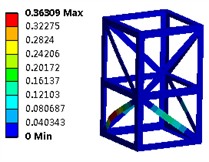
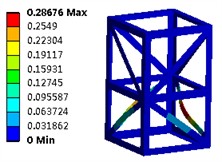
The first six modal shapes of the modular steel structure is presented in Fig. 3. It is evident that at various resonance frequencies, the outer edges of the frame structure demonstrate significant stability, while the primary vibration displacements are localized at the positions of the lateral reinforcements. Owing to its symmetrical configuration, maximum amplitudes for the first four modes occur at the top, resulting in concentrated displacements. Consequently, it can be inferred that enhancing the dimensions of the outer edges may effectively increase the natural frequency.
Table 1The first six natural frequencies
Order | 1 | 2 | 3 | 4 | 5 | 6 |
Nature frequency / Hz | 18.48 | 18.77 | 19.05 | 19.65 | 21.97 | 22.40 |
Fig. 2The trend of the first twelve natural frequencies

Fig. 3The first six modal shapes
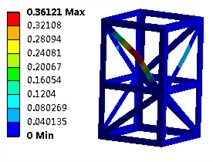
a) The first order
b) The second order
c) The third order
d) The fourth order
e) The fifth order
f) The sixth order
3. Optimization of structure
3.1. Setting of parametric model
To improve the stiffness of modular steel structures, an optimization approach utilizing the Design of Experiments (DOE) method is suggested. The core principle behind DOE is to utilize available samples or reference data to deduce or assess further information. This methodology requires the application of specific numerical analysis methods to fit discrete sample point data, thus enabling the development of a solid mathematical model. With this model in place, it becomes possible to predict other parameter points, leading to an optimized mathematical structure that meets engineering standards while reducing errors. By applying DOE theories and techniques, not only can the difficulties associated with obtaining sample parameters be significantly reduced, but also the complex relationships between optimization goals and variables can be effectively resolved.
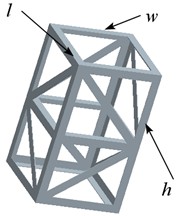
The selection of design variables in the paper is mainly based on two considerations. The optimized solution cannot change the overall manufacturing process, therefore, only structural dimension optimization is applied without optimizing material properties, without increasing manufacturing costs. Besides, the modular steel structures require a large amount of section bars, therefore, the size of the section is also not considered as a design variable. Develop a parametric model that maintains a constant total height of H= 2.8m, informed by the geometric configuration of the model. Identify the design variables, which include length (l), width (w), and half height (h) as illustrated in Fig. 4. Based on the analytical framework, establish the optimization objectives, specifically mass (m) and first-order natural frequency (f). A response surface model is developed from the results derived from the samples, and its accuracy is subsequently validated. The objective and constraint functions are constructed based on this response surface model, followed by the selection of a suitable optimization algorithm to identify the optimal solution for the objective function, which corresponds to the values of the optimized variables.
Fig. 4Definition of design variables
3.2. Determination and analysis of response surface model
Considering the characteristics and computational complexity of various sample design schemes, the central composite design method was employed to facilitate optimal computation. This approach allows for the extraction of more information from samples while minimizing the number of calculations required. Additionally, it demonstrates strong dynamic prediction capabilities. The limits on the values of the design variables are specified in Table 2.
Table 2The range of values for design variables
Parameters | l / mm | w / mm | h |
Initial value | 1600 | 1600 | 1400 |
Minimum/Maximum | 1400/1800 | 1400/1800 | 1400/1800 |
The central composite design method allows for the omission of certain high-order interaction effects while minimizing the number of experimental points required for specific factors, thereby ensuring the accuracy of the response surface. Utilizing the values of the three optimization variables outlined, a total of 14 experimental design points (including initial values) were established within the decision space, as presented in Table 3.
Taking into account the interaction effects of design variables, a second-order polynomial function is used as the function construction method. Substituting the data from Table 3 into the response surface function to solve for the regression coefficients yields an approximate model. The relationship between the objective function and design variables is frequently not fully understood, which implies that any fitted function may fail to accurately represent their true interconnection, resulting in inevitable errors. Error verification constitutes a vital component of the Design of Experiments (DOE) optimization process. Only when an extremum identified within an acceptable error range closely corresponds with real-world conditions can it be deemed reliable. Should this correspondence not be achieved, it becomes essential to revisit both the sample design and fitting procedures until the error is reduced to acceptable levels for fitting accuracy.
Generally, the effectiveness of a response surface function’s fit is evaluated using metrics such as the coefficient of determination (R2), adjusted R2 (R2 adj), and root mean square deviation (RMS). By conducting the solution process, the parameters for error evaluation are obtained as illustrated in Table 4. This suggests that the response surface function exhibits a high degree of fitting accuracy and can reliably substantiate the validity of the optimization results.
Table 3Table of sample design parameters
No | l / mm | w / mm | h / mm | m / kg | f / Hz |
1 | 1600 | 1600 | 1400 | 717.7 | 19.39 |
2 | 1400 | 1600 | 1400 | 686.0 | 15.37 |
3 | 1800 | 1600 | 1400 | 749.7 | 16.04 |
4 | 1600 | 1400 | 1400 | 686.0 | 20.45 |
5 | 1600 | 1800 | 1400 | 749.7 | 17.73 |
6 | 1600 | 1600 | 1800 | 746.2 | 18.69 |
7 | 1437 | 1437 | 1437 | 689.4 | 14.39 |
8 | 1763 | 1437 | 1437 | 741.3 | 23.79 |
9 | 1437 | 1763 | 1437 | 741.3 | 17.45 |
10 | 1763 | 1763 | 1437 | 793.2 | 18.14 |
11 | 1437 | 1437 | 1763 | 693.1 | 14.13 |
12 | 1763 | 1437 | 1763 | 746.2 | 23.05 |
13 | 1437 | 1763 | 1763 | 746.2 | 16.88 |
14 | 1763 | 1763 | 1763 | 798.2 | 19.39 |
Table 4Error evaluation parameters
Target parameter | R2 (Optimal Value 1) | R2adj(Optimal Value 1) | RMS (Optimal Value 0) |
m | 0.99688 | 0.99068 | 0.00802 |
f | 0.98755 | 0.97882 | 0.00311 |
3.3. Validation and discussion of optimization results
Currently, the particle swarm optimization method has attained a mature stage, enabling the resolution of diverse engineering problems through MATLAB programming. To address this challenge, the gradient optimization algorithm module within Isight software can be employed to analyze the response surface function. Furthermore, opting for the internally integrated particle swarm algorithm can markedly improve computational efficiency and provide convenient access to solution data. Optimized results and data are shown in Table 5. The optimized results and data are shown in Table 5. It can be seen that the weight of the modular steel structure decreased by 5.36 %, and the first natural frequency increased by 20.14 %.
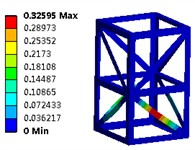
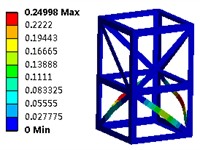
The examination of structural issues can be regarded as a constrained multi-variable nonlinear optimization problem. Fundamentally, this challenge entails the resolution of the gradient vector. The results derived from the optimization process can be classified into three categories: absolute optimal solutions, fully efficient solutions, and weakly efficient solutions. Therefore, the optimization problem can be reformulated as a quest for Pareto optimal solutions. The optimized first six modal shapes are shown in Fig. 5. It can be seen that due to the good symmetry of the structure, there is no significant difference in the modal shapes of the optimized structure. However, under the premise of reduced mass, the natural frequency can be significantly increased, which plays an important role in improving the stiffness of steel structures.
Table 5Optimized results and data
Design variables | m / kg | f / Hz | Weight reduction rate | Increase rate of natural frequency |
l=1775 mm | 679.2 | 24.25 | 5.36 % | 20.14 % |
w=1406 mm | ||||
h=1504 mm |
4. Conclusions
1) Finite element analysis serves as a crucial and reliable technique in modal analysis, extensively utilized in the engineering domain due to its high computational precision. Conducting modal analysis on modular steel structures facilitates a comprehensive understanding of their vibration characteristics, allows for the determination of natural frequencies, thereby mitigating the risk of resonance and preventing structural damage resulting from such phenomena. The analytical results indicate that the first-order natural frequency of the initial structure is 19.39 Hz, suggesting that there remains significant potential for optimization.
2) By employing the central composite design methodology, 14 sampling points were established within the design space for the variables, resulting in an optimized mathematical model through second-order response fitting. Utilizing the particle swarm optimization technique implemented in Isight, a Pareto optimal solution set for the optimization model was obtained, and its accuracy was corroborated through finite element analysis. The results demonstrate that this optimization can achieve a mass reduction of over 5 % while increasing the first-order natural frequency by more than 20 %.
Fig. 5The optimized first six modal shapes
a) The first order (24.25 Hz)
b) The second order (24.98 Hz)
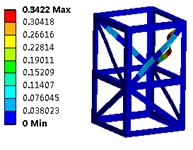
c) The third order (28.03 Hz)
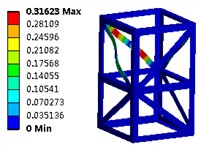
d) The fourth order (28.22 Hz)
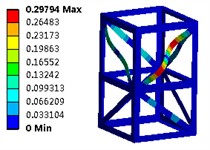
e) The fifth order (28.34 Hz)
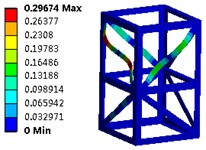
f) The sixth order (29.17 Hz)
References
-
Z. G. Sun and Ch. Wang, “Industry foundation class-based building information modeling lightweight visualization method for steel structures,” Applied Sciences, Vol. 14, No. 13, pp. 5507–5507, Jul. 2024, https://doi.org/10.1016/10.3390/app14135507
-
A. Ras and H. Basri, “Enhancing steel building dynamic performance under cyclic loadings using plate steel shear panels,” Asian Journal of Civil Engineering, Vol. 25, No. 5, pp. 4241–4250, Apr. 2024, https://doi.org/10.1007/s42107-024-01044-6
-
H. D. Chalak, A. M. Zenkour, and A. Garg, “Free vibration and modal stress analysis of FG-CNTRC beams under hygrothermal conditions using zigzag theory,” Mechanics Based Design of Structures and Machines, Vol. 51, No. 8, pp. 4709–4730, Aug. 2023, https://doi.org/10.1080/15397734.2021.1977659
-
R. K. Bhamu, A. Shukla, S. C. Sharma, and S. P. Harsha, “Vibration response of steam turbine healthy and cracked blade under the stress stiffening and spin softening effects,” Proceedings of the Institution of Mechanical Engineers, Part K: Journal of Multi-body Dynamics, Vol. 236, No. 2, pp. 224–243, Feb. 2022, https://doi.org/10.1177/14644193221078656
-
I. Aarab, K. E. Amari, A. Yaacoubi, A. Etahiri, and A. Baçaoui, “Optimization of the flotation of low-grade phosphate ore using DOE: a comparative evaluation of fatty acid formulation to sodium oleate,” Mining, Metallurgy and Exploration, Vol. 40, No. 1, pp. 95–108, Dec. 2022, https://doi.org/10.1007/s42461-022-00706-w
-
R. Talebitooti, H. D. Gohari, and M. R. Zarastvand, “Multi objective optimization of sound transmission across laminated composite cylindrical shell lined with porous core investigating non-dominated sorting genetic algorithm,” Aerospace Science and Technology, Vol. 69, No. 1, pp. 269–280, Oct. 2017, https://doi.org/10.1016/j.ast.2017.06.008
About this article
The authors have not disclosed any funding.
The datasets generated during and/or analyzed during the current study are available from the corresponding author on reasonable request.
The authors declare that they have no conflict of interest.

