Abstract
In order to enhance the stability and reliability of the vibrating screen, modal and harmonic response characteristics were simulated and analyzed using the finite element method. The final assembly model was established in Creo, serving as an intermediate format for material definition and mesh accuracy verification. The analysis of natural frequency and mode revealed that the overall structural stiffness was basically satisfactory. However, harmonic response analysis indicated issues related to excessive stress and stress concentration within the structure. Subsequent optimization of the frame structure confirmed nearly unchanged low-order natural frequencies, while maximum stress was reduced by 22.15 %, holding significant implications for process cost control.
Highlights
- In order to enhance the stability and reliability of the vibrating screen, modal and harmonic response characteristics were simulated and analyzed using the finite element method.
- Through harmonic response analysis, the deformation and stress distribution of vibrating screen body are obtained.
- In order to further optimize the stress response results, the structure of the vibrating screen frame has been improved to reduce the loss of materials and reduce the difficulty in manufacturing.
1. Introduction
The vibration isolation characteristics of the motor support significantly impact the safety and reliability of the entire equipment [1-2]. Taking vibrating screening equipment (also named shaker) as an example, it utilizes the vibration of the porous working surface to separate particles of different sizes for screening operations and material recycling. The DYS type circular vibrating screen is a large-scale circular vibrating screen, with a width exceeding 3 m and a length exceeding 6 m. Due to the substantial mass of the screen box, it requires a significant exciting force to drive continuous vibration [3-4]. Additionally, due to structural limitations and bearing size constraints, the DYS circular vibrating screen necessitates a dual drive system, involving the installation of two shaft eccentric vibrators driven by two motors. These vibrators are connected on the opposite side of the motor-driven screen using synchronous tooth belts to ensure that they maintain the same phase and rotation direction. In principle, there are no differences in other parts of the structure compared to YA circular vibrating screens. However, due to substantial impact loads during operation, the stiffness and strength of the circular vibrating screen often fall short in meeting expected service life [5]. Therefore, modal characteristics analysis is necessary. In order to efficiently separate materials of different particle sizes and enhance structural strength and reliability of the vibrating screen itself, this paper optimizes a large three-layer circular vibrating screen by effectively addressing issues such as screen body deformation, side plate cracking, and beam fracture.
2. Simulation and analysis of modal characteristics
2.1. The establishment of finite element model
The finite element method (FEM) is a crucial component of computational mechanics and applied mathematics, and has found extensive use in both scientific research and engineering applications. The widely utilized finite element analysis software ANSYS Workbench is based on the finite element method, allowing for the structural analysis of complex mechanical structures in various settings due to its integration of multiple modules [6]. ANSYS Workbench includes 3D modeling software capable of creating simple part models, but due to the complex structure of the three-layer circular vibrating screen, a multitude of parts are involved. Therefore, the finite element model must be established using external 3D software Creo5.0, and the model needs to be simplified before importing into ANSYS Workbench. The simplification involves meshing, block eccentric exciter, bracket, bolt and bolt hole components; however, this may result in irregular deformed elements with poor mesh quality around these features during meshing process leading to non-convergence errors in finite element solution results. Upon importing the simplified model as a “*.x_t” file into ANSYS Workbench, it is essential to verify for any missing parts, as shown in Fig. 1.
Fig. 1Three-dimensional model of finite element: 1 – side plate; 2 – upper discharge port; 3 – middle discharge port; 4 – cross beam; 5 – trunnion and spring support; 6 – lower screen frame; 7 – feed port; 8 – upper screen frame; 9 – upper back plate; 10 – middle screen frame; 11 – middle back plate
2.2. Preprocessing of the model
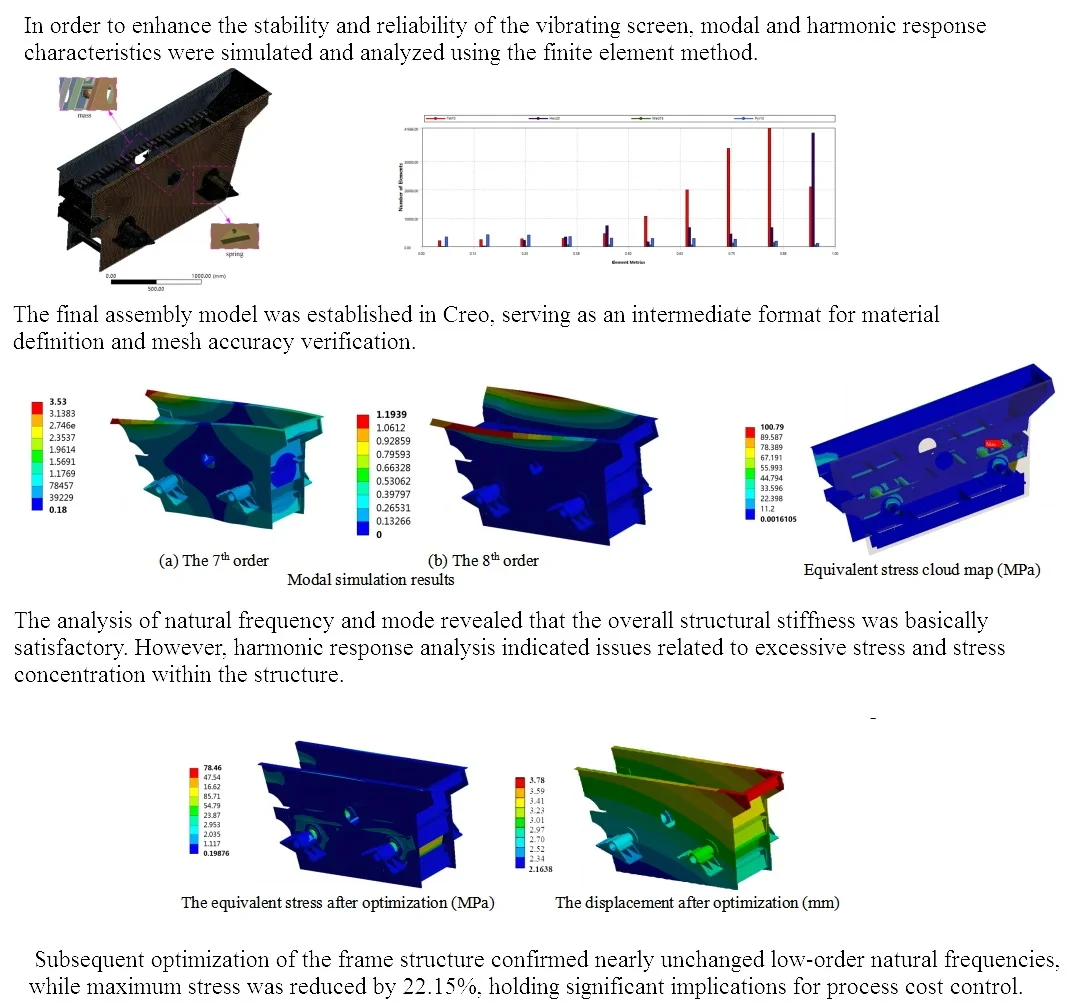
After importing the model, pre-treatment is required for the three-layer circular vibrating screen. Firstly, the material parameters of the vibrating screen need to be defined, considering Q235 as the material with its properties. Secondly, contact settings between different parts inside the vibrating screen should be established as bonded connection to limit relative movement. To simulate the influence of rubber springs on the vibration isolation system, springs in three directions should be set to restrict motion. Finally, for accurate analysis results, a mass point is applied to replace the simplified eccentric shaker's influence on the vibrating screen. After completing the material parameter setting for the three-layer circular vibrating screen, it is essential to also consider grid division in ANSYS Workbench, taking into account the structural characteristics of the vibrating screen and the features of different meshing methods [7]. The sweeping method is adopted for grid division of regular parts such as beams and side panels, while hexahedron-based grid division is used for complex parts like the screen frame and discharge port. Fine processing is necessary for grid division of parts with large forces, such as trunnion and spring support. The pre-processing finite element analysis model obtained has a total of 783,360 nodes and 235,603 elements, as shown in Fig. 2.
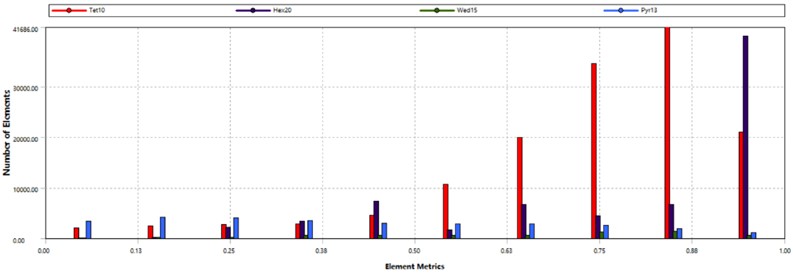
The mesh division of the finite element model significantly influences the feasibility and credibility of subsequent analyses. The Element Quality and Skewness values, which are assessment methods based on ANSYS Workbench, both range from 0 to 1. A higher value for Element Quality indicates better quality, while a lower value for Skewness is preferred. The histogram distribution of the three-layer circular vibrating screen's quality after mesh division is illustrated in Fig. 3. It can be seen that most of the cell types in the grid cell quality histogram are tetrahedral units, and their values are above 0.63. In the grid cell inclination, tetrahedral units are concentrated within 0.5, and most other units are also distributed here. According to the results of grid evaluation, the grid division of the three-layer circular vibrating screen can meet the requirements of simulation and result accuracy.
Fig. 2The results of mesh
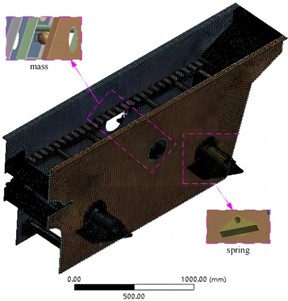
Fig. 3Quality assessment of mesh
2.3. Modal calculation and simulation
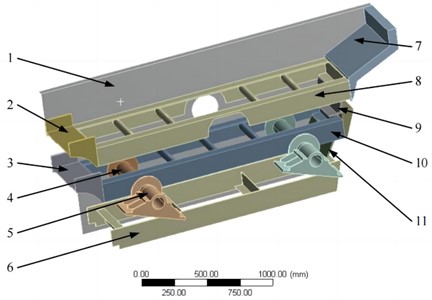
On the premise of setting the modal analysis parameters and selecting the Subspace method for modal analysis, the modal analysis of the three-layer circular vibrating screen was completed, and the first 2 efficient modes (7th and 8th order) of vibration were obtained, as shown in Fig. 4. The first six vibration modes of the three-layer circular vibrating screen are characterized by rigid body motion, with minimal spring deformation and no significant change in the overall structure of the vibrating screen. This is primarily due to the calculation of vibration modes corresponding to the first six natural frequencies based on the mass of the vibrating screen and overall spring stiffness. From the seventh mode onwards, however, deformation occurs in the vibrating screen, as its modal parameters are determined by its structural characteristics.
Fig. 4Modal simulation results
a) The 7th order
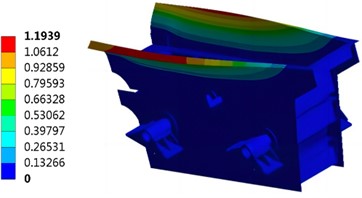
b) The 8th order
Through modal analysis, natural frequencies of order 7-12 and corresponding vibration motion are obtained, as shown in Table 1. It can be seen that the seventh natural frequency of the vibrating screen has a large difference with the operating frequency of 13 Hz. The vibration type corresponding to the sixth natural frequency is rigid body motion, and the vibrating screen has not deformed, and the influence on the vibration is small, so the vibrating screen will not resonate at the working frequency.
Table 1Modal simulation results
Order | Nature frequency / Hz | Description of vibration shape |
7 | 36.89 | Reverse twisting of the outlet and inlet |
8 | 39.68 | Both sides of the discharge port reverse swing |
9 | 43.35 | The top of the screen body and the end of the discharge port are snaking |
10 | 48.96 | The inlet swings up and down |
11 | 57.39 | Both sides of the discharge port and the inlet port reverse swing |
12 | 88.29 | The bottom of the screen body and the end of the discharge port swing serpentine |
2.4. Harmonic response analysis
The finite element model established before is used to continue the harmonic response analysis, which requires the application of load excitation. According to the working conditions, it can be concluded that the exciting force required by the vibrating screen is 14370 N, so the force in the direction of each other is perpendicular to the vibration holes on both sides of the finite element model, the force size is 7185 N, and the phase difference is 90°. The mode superposition method is used to analyze the harmonic response. Because the three-layer circular vibrating screen works at a frequency of 13 Hz, the sweep frequency range of the harmonic response analysis is 10-15 Hz, and the influence of the exciting force on the vibrating screen is analyzed every 0.5 Hz. The equivalent stress cloud diagram of the vibrating screen at the operating frequency of 13 Hz is shown in Fig. 5.
Fig. 5Equivalent stress cloud map (MPa)
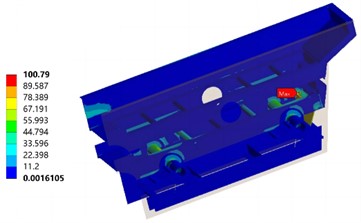
It can be seen that the maximum stress is 100.79 MPa, which is somewhat large for the vibrating screen with long-term continuous work. The larger stress value of the three-layer circular vibrating screen is mainly distributed in the middle back plug plate, the middle screen frame, the upper discharge port, the cross beam and accessories. The stress value at the connection between the middle screen frame and the rear plug plate is up to 51.98 MPa, and the stress near it is distributed in a strip, which is because the middle screen back plug plate is connected with the screen frame through the top bolt, equivalent to hanging on the screen frame, under the influence of inertial force, resulting in the stress at the joint of the two becomes larger, but the stress value does not exceed the standard stress value of the vibrating screen design 74.33 MPa. The larger stress value of the middle screen frame appears in the round steel pipe near the beam, and the stress distribution is strip, which is mainly because the round steel pipe bears part of the screen mass for the beam, so the stress is larger. The stress value at the connection between the upper discharge port and the side plate is large, and the stress distribution is striped, which may be because the discharge port is connected with the side plate on both sides by bolts, and there is a distance from the top of the side plate. Under the action of the inertia force of the discharge port, the stress value of the connection part of the two is large. The larger stress value of the beam and trunnion appears at the joint of the circular steel pipe and the flange, and is distributed in a ring, the main reason may be that the two not only support the overall quality of the vibrating screen, but also bear the impact load transmitted by the vibrating screen and the earth through the spring, and it is easy to crack and break under the frequent action of the load.
3. Structure optimization and analysis
3.1. The adjustment of frame structure
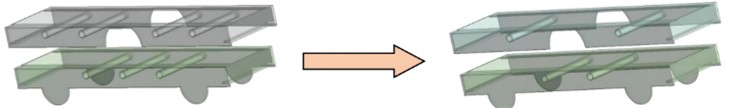
Through harmonic response analysis, it is found that the stress change of the circular steel pipes in the upper and middle screen frames of the vibrating screen is small. Considering the processing difficulty and the overall mechanism of the vibrating screen, the number of circular steel pipes in the two screen frames is simplified, and the number of circular steel pipes is reduced from seven to four, as shown in Fig. 6. This structure optimization method can not only maintain good load-bearing equilibrium, but also effectively simplify the complexity of the machining process. The optimized frame structure needs to meet the strength and working requirements, so it is necessary to conduct modal and harmonic response analysis of the optimized model to verify whether the optimization is feasible.
Fig. 6Structure optimization scheme
3.2. Verification of modal characteristics
The optimized frame structure is reassembled into the final assembly model, and the optimized vibrating screen also needs to be pre-treated before modal analysis. The effective natural frequency after optimization is shown in Table 2. The friction natural frequency after optimization is not much different from that before optimization, so it can be verified that the optimized vibrating screen will not have resonance phenomenon.
Table 2Natural frequency calculation results
Order | 7 | 8 | 9 | 10 | 11 | 12 |
Nature frequency / Hz | 33.28 | 35.59 | 41.28 | 46.60 | 54.37 | 77.24 |
3.3. Verification of modal characteristics
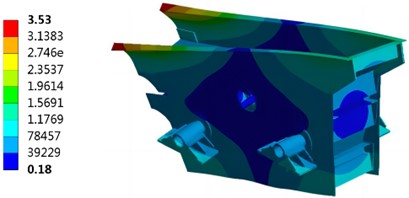
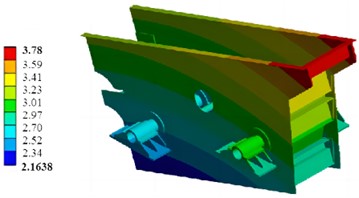
Under the same conditions, the harmonic response of the optimized vibrating screen is analyzed, and the stress calculation results can be obtained as shown in Fig. 7. It can be seen that the maximum stress of the optimized model is 78.46 MPa, which is reduced by 22.15 % compared with that before optimization, and the stress concentration problem is significantly reduced. This proves that after the improvement of the screen frame structure, the vibrating screen not only has no great change in the stress at work, but also reduces the difficulty in processing, which can achieve good economic benefits. The optimized deformation results is shown in Fig. 8, where it can be seen that the maximum deformation is 3.78 mm, which is only 1.2 % higher than the initial value, indicating that the structure still maintains good deformation stiffness.
Fig. 7The equivalent stress after optimization (MPa)
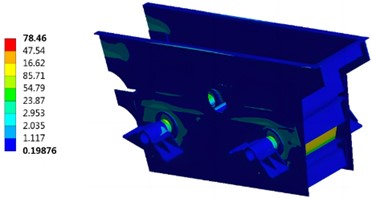
Fig. 8The displacement after optimization (mm)
4. Conclusions
ANSYS Workbench finite element analysis software is used to analyze the vibration screen modal and harmonious response. Through modal analysis, the effective natural frequency of the model is obtained, and according to the operating frequency, the overall structure does not have resonance phenomenon. Through harmonic response analysis, the deformation and stress distribution of vibrating screen body are obtained. In order to further optimize the stress response results, the structure of the vibrating screen frame has been improved to reduce the loss of materials and reduce the difficulty in manufacturing. The results show that the maximum stress of the vibrating screen is obviously reduced and the complexity of the process is reduced after the structure improvement, which is conducive to controlling the production cost of the vibrating screen.
References
-
D. C. Simone, “Modal analysis through response-based FRFs: Additional modes for local diagnoses,” Journal of Sound and Vibration, Vol. 549, No. 1, pp. 101–109, 2023, https://doi.org/10.1016/ j.jsv.2023.117574
-
M. R. Zarastvand, M. H. Asadijafari, and R. Talebitooti, “Acoustic wave transmission characteristics of stiffened composite shell systems with double curvature,” Composite Structures, Vol. 292, No. 1, p. 115688, Jul. 2022, https://doi.org/10.1016/j.compstruct.2022.115688
-
R. Talebitooti, M. Zarastvand, and H. Darvishgohari, “Multi-objective optimization approach on diffuse sound transmission through poroelastic composite sandwich structure,” Journal of Sandwich Structures and Materials, Vol. 23, No. 4, pp. 1221–1252, Jun. 2019, https://doi.org/10.1177/1099636219854748
-
R. Talebitooti, H. D. Gohari, and M. R. Zarastvand, “Multi objective optimization of sound transmission across laminated composite cylindrical shell lined with porous core investigating Non-dominated Sorting Genetic Algorithm,” Aerospace Science and Technology, Vol. 69, No. 1, pp. 269–280, Oct. 2017, https://doi.org/10.1016/j.ast.2017.06.008
-
H. D. Chalak, A. M. Zenkour, and A. Garg, “Free vibration and modal stress analysis of FG-CNTRC beams under hygrothermal conditions using zigzag theory,” Mechanics Based Design of Structures and Machines, Vol. 51, No. 8, pp. 4709–4730, Aug. 2023, https://doi.org/10.1080/15397734.2021.1977659
-
R. K. Bhamu, A. Shukla, S. C. Sharma, and S. P. Harsha, “Vibration response of steam turbine healthy and cracked blade under the stress stiffening and spin softening effects,” Proceedings of the Institution of Mechanical Engineers, Part K: Journal of Multi-body Dynamics, Vol. 236, No. 2, pp. 224–243, Feb. 2022, https://doi.org/10.1177/14644193221078656
-
A. Daşdemir, “A modal analysis of forced vibration of a piezoelectric plate with initial stress by the finite-element simulation,” Mechanics of Composite Materials, Vol. 58, No. 1, pp. 69–80, Mar. 2022, https://doi.org/10.1007/s11029-022-10012-7
About this article

The paper is supported by Shandong Province undergraduate teaching reform research project (project number: M2020307).
The datasets generated during and/or analyzed during the current study are available from the corresponding author on reasonable request.
The authors declare that they have no conflict of interest.
