Abstract
In order to achieve more scientific design of the reduction gear and reduce material waste, pre-stressed modal analysis method was combined with multi-objective optimization algorithm to optimize the structure of the reduction gear basic body. The model was simplified and parameterized and the maximum stress and equivalent stiffness under different parameter size combinations were obtained through finite element analysis. Separately, genetic clustering method, neural network method, and Kriging method were used to construct the response surface function. Through error verification and comparison, it was found that the Kriging method was more suitable for the gear model. In the design of variable extremum search, multi-objective genetic algorithm and sequential quadratic programming were compared and analyzed. The results show that the mass of the gear can be reduced by 39.9 %, while the maximum stress remains unchanged, the equivalent stiffness is not reduced, and a good optimization design effect is achieved.
Highlights
- Pre-stressed modal analysis method was combined with multi-objective optimization algorithm to optimize the structure of the reduction gear basic body.
- The model was simplified and parameterized and the maximum stress and equivalent stiffness under different parameter size combinations were obtained through finite element analysis.
- Genetic clustering method, neural network method, and Kriging method were used to construct the response surface function.
1. Introduction
Anchoring equipment, as an important part of deck machinery, plays a very important role in fixing, emergency, and assisting ship operation [1]. The transmission device is usually designed by empirical methods, which have problems such as being too heavy and having an unreasonable safety factor. By optimizing and studying the design, it can promote the lightweight development of ships and have a positive impact on energy and the environment. The reduction gear, as an important part of the transmission device of the anchor machine, needs to meet the requirements of safety and stability [2, 3], and has high requirements for modal and strength, which makes it have the characteristics of being heavy in weight and high in cost [4, 5]. Using finite element analysis and optimization design to lighten the reduction gear design and research can not only reduce energy consumption, but also reduce maintenance costs and the number of maintenance times. Especially for ocean-going vessels, reducing self-weight can effectively improve its range [6]. Therefore, in this paper, it is proposed that, while meeting the force requirements, the self-weight can be reduced by a considerable margin, and the structure design can be made more reasonable, greatly reducing material redundancy and improving material utilization rate is an important development direction, which also provides new methods and ideas for the structural lightweighting of other ship equipment. In order to improve the efficiency and reliability of optimization design, this paper innovatively uses agent-based models to construct optimization schemes, and uses different response surface functions to fit mathematical models. By error analysis, the precision of the fitting function can be improved.
2. Modal and strength analysis of reduction gear model
2.1. Simplification and parameterization of the model
The structure and composition of the anchor winch transmission system are shown in Fig. 1, which is arranged axially and mainly responsible for anchoring, unanchoring, and hauling operations. The load on the reduction gear is mainly torque, which is crucial for ensuring the stability of the vessel during docking, so the structural integrity and safety of the system are one of the most important indicators of the performance of the anchor winch. The reduction gear bears a larger load, so it is selected from the modified 40Cr material, which can effectively meet the requirements of wear resistance, fatigue resistance, static strength, and impact toughness. To save materials, the overall structure of the reduction gear is designed as a hub plate, reinforced by reinforcing ribs, and the internal structure is set to be symmetrical hollow to avoid stress concentration caused by uneven loading. Since the gear tooth shape, module, and number of teeth all meet the national standard requirements, they are no longer considered as optimization design parameters. To improve the calculation efficiency, the pitch circle diameter is kept constant, and the tooth shape structure is omitted in the gear model, as shown in Fig. 2. The design variables mainly include five types of parameters, whose code and value ranges are shown in Table 1. In the parameterized model of the reduction gear, the rib is set to be a symmetrical structure, so the hole spacing between the two sides is set to change synchronously, i.e., P2 = P3.
Fig. 1Assembly model of transmission mechanism
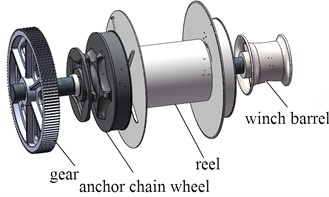
Fig. 2Simplified model of the reduction gear
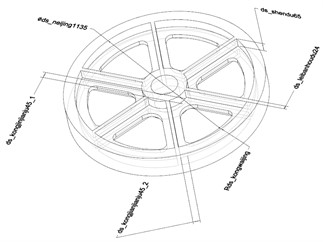
Table 1The dimensions variable range
Name of dimensions | Code | Initial dimensions | Minimum dimensions | Maximum dimensions |
ds_kongjinjianju45_1 | P1 | 45 | 35 | 55 |
ds_kongjianjianjianju45_2 | P2 | 45 | 35 | 55 |
ds_leibanhoudu24 | P4 | 24 | 20 | 28 |
Φds_neijing1135 | P5 | 1135 | 1100 | 1140 |
ds_shendu65 | P6 | 65 | 45 | 75 |
The reduction gear is the most important load-bearing component in the transmission system, and the main shaft that rotates synchronously with it is the torque output axis for the entire transmission device. According to actual engineering applications, the tooth profile of this gear has not shown any significant wear, cracking, or fracture faults in long-term heavy-duty conditions, and the tooth strength and safety factor are relatively high. Since adjusting the tooth shape would change the production process and significantly increase the equipment manufacturing cost, the structural parameters of the tooth are not considered as design variables in the lightweight design study. With the maximum load of 523 kN as the analysis condition, the limit load state of the anchor winch, the torque is converted from the equilibrium condition in mechanics and applied to the outer surface of the gear. The gear model in Creo is imported into ANSYS through the interface and defined in the modeling module. Then, the static structural analysis module is established in the ANSYS Workbench, and the modal analysis module is coupled with the structural analysis module, with the equivalent stiffness serving as a reference.
2.2. Modal analysis of prestress
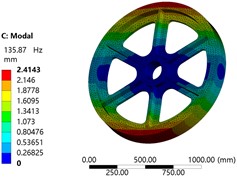
In the material library, the material properties of the model are defined as 40Cr, and the quality parameter is set as the optimization target, with the code P7. For the mesh division, the adaptive type is used, and the mesh resolution level is set to 7, with the transition between different planes selected as a slow mode, the center of the span angle selected as a medium mode. Finally, the number of elements is 88168, the number of nodes is 141582, and the mesh division results are shown in Fig. 3. Through the mesh optimization and local refinement verification, it is shown that this mesh division method can achieve high accuracy and computational efficiency. The inner hole of the reduction gear is defined as a fixed constraint, and the gravity factor is considered. The torque of the outer cylindrical surface is set to 2.12e8 N·mm, and the final results of the equivalent stress, total deformation, and first-order vibration analysis are shown in Fig. 4, Fig. 5, and Fig. 6, respectively. It can be seen that the maximum stress (set code as P8) of the reduction gear is 278.46 MPa, far less than its yield limit of 785 MPa. The maximum deformation of the model is 1.2 mm, set code as P9. The first-order natural frequency in the prestressed condition (set code as P10) is 135.87 Hz. After returning to the parameter definition module, the equivalent stiffness parameter is increased and defined as P11.
Fig. 3Meshing results
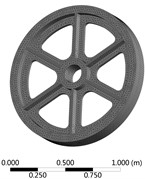
Fig. 4Stress analysis results
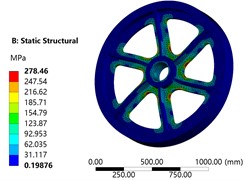
Fig. 5Displacement analysis results
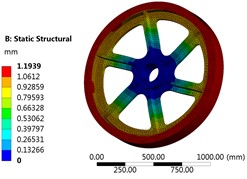
Fig. 6The first mode shape
3. Multi-objective optimization design
3.1. Computation of discrete data samples
According to the range of values of the design variables, it can be seen that in the condition of allowable assembly dimensions, most of the design variables have a symmetrical distribution of values, but P1 and P5 have asymmetrical value results. Therefore, the Latin hypercube design (LHD) method is used to obtain sample data. In the continuous data interaction and iterative calculation between ANSYS and Creo, the parameter variables are shared in real time, and finally, the optimized objectives corresponding to different design variables are shown in Table 2. The target samples include P7 (mass), P8 (maximum stress), P9 (maximum deformation), P10 (first-order natural frequency), and P11 (equivalent stiffness). These discrete sample data are the key to completing the response surface function fitting. If the accuracy of the fitting function is insufficient, the sampling range and sampling scheme need to be adjusted. The parallel computing forms of the optimization objectives P7 and P8 are shown in Fig. 7, respectively, under the center group and design method conditions. The changes in the combination structure and sample values of the design variables and optimization objectives under the conditions of all boundary values and target extreme values are shown in Figs. 5 and 6, respectively. It can be seen that the maximum deformation and equivalent stiffness changes are typical inverse relationships, so parameter P9 can be represented to some extent by parameter P11.
To study the effects of design variables on the target and the lightweighting range, a model of the quality response surface, stress response surface, and equivalent stiffness response surface was built based on the experimental design data. The relationship between the design variables and the quality is linear, and the quality increases as the design variables increase. The relationship between the design variables and the maximum equivalent stress is nonlinear, and it decreases as the design variables increase.
Table 2Sample data set
No | P1/ mm | P2/ mm | P4/ mm | P5/ mm | P6/ mm | P7/ kg | P8/ MPa | P9/ mm | P10/ Hz | P11/ N/m |
1 | 488.33 | 49.76 | 25.52 | 1240.75 | 70.00 | 348.74 | 339.34 | 1.33 | 183.05 | 1.16e7 |
2 | 501.67 | 53.57 | 22.48 | 1152.92 | 47.14 | 692.93 | 103.51 | 0.48 | 155.69 | 1.67e7 |
3 | 451.67 | 39.29 | 24.38 | 1214.92 | 65.71 | 448.16 | 314.33 | 1.29 | 156.54 | 1.09e7 |
4 | 495.00 | 44.05 | 25.14 | 1194.25 | 55.71 | 558.22 | 179.01 | 0.80 | 154.68 | 1.33e7 |
5 | 458.33 | 46.90 | 26.67 | 1230.42 | 45.71 | 654.56 | 103.79 | 0.45 | 175.39 | 2.01e7 |
6 | 518.33 | 41.19 | 24.76 | 1183.92 | 67.14 | 462.80 | 382.53 | 1.74 | 133.03 | 8.16e6 |
7 | 491.67 | 43.10 | 20.95 | 1245.92 | 54.29 | 476.74 | 190.84 | 0.87 | 163.35 | 1.26e7 |
8 | 515.00 | 50.71 | 21.33 | 1204.58 | 72.86 | 373.51 | 518.86 | 2.12 | 135.44 | 6.82e6 |
9 | 471.67 | 37.38 | 20.19 | 1158.08 | 52.86 | 631.03 | 217.31 | 1.00 | 136.76 | 1.17e7 |
10 | 468.33 | 48.81 | 26.29 | 1225.25 | 60.00 | 497.91 | 168.06 | 0.70 | 165.54 | 1.36e7 |
11 | 478.33 | 51.67 | 27.81 | 1142.58 | 58.57 | 650.11 | 147.02 | 0.60 | 147.87 | 1.41e7 |
12 | 465.00 | 42.14 | 24.00 | 1189.08 | 71.43 | 437.09 | 465.08 | 1.87 | 130.8 | 7.45e6 |
13 | 485.00 | 52.62 | 23.24 | 1168.42 | 50.00 | 667.49 | 112.70 | 0.50 | 153.62 | 1.57e7 |
14 | 505.00 | 35.48 | 21.71 | 1178.75 | 57.14 | 535.26 | 294.92 | 1.44 | 135.15 | 9.74e6 |
15 | 475.00 | 36.43 | 25.90 | 1147.75 | 64.29 | 572.22 | 326.36 | 1.44 | 128.86 | 9.47e6 |
16 | 511.67 | 47.86 | 27.05 | 1163.25 | 62.86 | 550.74 | 222.01 | 0.95 | 149.04 | 9.02e6 |
17 | 508.33 | 45.95 | 23.62 | 1220.08 | 68.57 | 386.81 | 362.51 | 1.57 | 159.54 | 1.21e7 |
18 | 498.33 | 38.33 | 27.43 | 1235.58 | 51.43 | 525.86 | 180.66 | 0.86 | 173.26 | 9.80e6 |
19 | 461.67 | 54.52 | 20.57 | 1199.42 | 61.43 | 520.54 | 165.86 | 0.67 | 143.33 | 1.57e7 |
20 | 455.00 | 45.00 | 22.86 | 1173.58 | 74.29 | 441.56 | 625.58 | 2.31 | 115.00 | 1.06e7 |
21 | 481.67 | 40.24 | 22.10 | 1209.75 | 48.57 | 595.72 | 165.11 | 0.77 | 155.80 | 5.81e6 |
3.2. Fitting of response surface functions
Based on the sample calculation results, a response surface model was established and the accuracy of the approximate model was verified. Response surface methodology (RSM) is an approximate model whose core idea is to create an approximate mathematical model to replace the finite element analysis model and use the approximate model for optimization design. In the engineering field, the response surface method is widely used in product design, process optimization, and quality control. By statistically analyzing and regression processing of experimental data, a mathematical expression describing the relationship between dependent and independent variables can be obtained, providing important reference in actual production.
In addition, the response surface method has strong robustness and universality, and can play a role in different industries and fields. It can help engineers better understand the complex interactions within the system and provide reliable basis for improving product design, improving production efficiency and reducing costs. At the same time, with the development of big data technology and artificial intelligence technology in modern manufacturing industry, the response surface method is gradually integrated into intelligent manufacturing systems, providing scientific support for enterprise decision-making. In summary, response surface methodology, as an effective experimental design and optimization tool, has played a positive role in advancing scientific research and engineering practice, and will continue to be valued and further improved and expanded in the future. Separately, the genetic clustering method (GA), neural network method (Neural Network, NN), and Kriging method (K) were used to construct the response surface function. Since P11 is determined by P7 and P10, the fitting effects of P7, P8, and P10 were validated. The fitting accuracy of various response surface functions was compared, and the evaluation criteria were the fitting coefficient of determination R2, root mean square error (RMS), relative maximum absolute error (RMAE), and relative average absolute error (RAAE). The error determination results are shown in Table 3. It can be seen that the Kriging model (shown in Fig. 7) is more suitable for the response surface function fitting under the conditions of the limit strength analysis of the large gear model.
Fig. 7The response of the design variables to the target
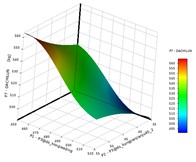
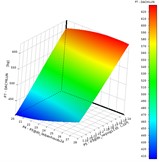
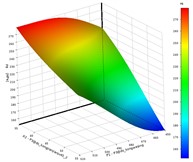
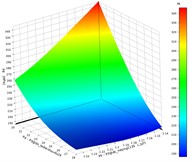
Table 3Error determination and comparison of results
Target parameters | Response surface form | R2 (optimal value is 1) | RMS (optimal value is 0) | RMAE (optimal value is 0) | RAAE (optimal value is 0) |
P7 | GA | 1 | 0.012 | 0 | 0 |
NN | 1 | 8.59 | 21.58 | 6.89 | |
K | 1 | 1.14e-13 | 0 | 0 | |
P8 | GA | 1 | 5.54 | 8.71 | 3.11 |
NN | 0.96 | 28.82 | 70.59 | 8.04 | |
K | 1 | 6.42e-9 | 0 | 0 | |
P10 | GA | 1 | 0.18 | 2.33 | 0.86 |
NN | 0.94 | 4.04 | 51.48 | 17.56 | |
K | 1 | 2.23e-13 | 0 | 0 |
3.3. Fitting of response surface functions
In order to ensure that the gear reducer with lightweight design still has good strength and stiffness, we converted the target parameters P8 and P11 into boundary conditions, requiring P8 not to exceed 278.46 MPa and P11 not to be less than 1.69e7 N/m. The optimization goal is to make the mass parameter P7 reach the minimum value. After fitting and verifying the response surface function, we need to choose an appropriate optimization algorithm to find the extreme points of the function. For the bearing characteristics and lightweight design requirements of the gear parts, we conducted a comparative analysis of the multi-objective genetic algorithm MOGA and the sequential quadratic programming NLPQL, and obtained the parameter variables and target extreme value results shown in Table 4.
Table 4Optimized design results
Optimization algorithm | P1/ mm | P2 /mm | P4/ mm | P5/ mm | P6/ mm | P7/ kg | P10/ MPa | P9/ (N/m) | Weight loss rate/ % |
Initial value | 499 | 45 | 24 | 1135 | 65 | 578.97 | 278.46 | 1.69e7 | |
NLPQL | 457.7 | 48.2 | 28 | 1248.5 | 70.53 | 348.21 | 266.92 | 1.69e7 | 39.9% |
MOGA | 469.3 | 47.1 | 27.6 | 1248.4 | 69.8 | 350.84 | 275.45 | 1.69e7 | 39.4% |
It can be seen that under the condition of the NLPQL algorithm, the mass of the large gear can be reduced by 39.9 %, while the maximum stress remains unchanged and the equivalent stiffness is not reduced, which is a very significant optimization effect.
4. Conclusions
1) The natural frequency and mass are the key factors determining the equivalent stiffness, but they are interrelated, so multi-objective optimization techniques need to be adopted. The first-order natural frequency can be obtained through modal analysis, and the response values of the optimization objectives can be obtained by discretizing the design variables. Different response surface functions are used for fitting to verify that the Kriging model has the highest accuracy and is suitable for constructing the optimization model.
2) The influence of different search algorithms on the optimized design results is negligible, which also proves the high precision of the response surface function. Under the premise of not reducing the strength and equivalent stiffness, the mass of the reduction gear can be reduced by more than 39 % to achieve good economic and social benefits.
References
-
J. Wang, Y. Nie, H. Yuan, and H. Song, “Thermal-structural and prestressed modal analyses for a solar sail with nonlinear shape memory alloy spring,” Advances in Space Research, Vol. 74, No. 4, pp. 1770–1780, Aug. 2024, https://doi.org/10.1016/j.asr.2024.05.047
-
R. Talebitooti, M. Zarastvand, and H. Darvishgohari, “Multi-objective optimization approach on diffuse sound transmission through poroelastic composite sandwich structure,” Journal of Sandwich Structures and Materials, Vol. 23, No. 4, pp. 1221–1252, Jun. 2019, https://doi.org/10.1177/1099636219854748
-
J. Ghorbani, A. Sounthararajah, T. T. Dutta, and J. Kodikara, “Modelling rapid non-destructive test using light weight deflectometer on granular soils across different degrees of saturation,” Journal of Rock Mechanics and Geotechnical Engineering, Vol. 16, No. 7, pp. 2732–2748, Jul. 2024, https://doi.org/10.1016/j.jrmge.2023.11.026
-
H. D. Chalak, A. M. Zenkour, and A. Garg, “Free vibration and modal stress analysis of FG-CNTRC beams under hygrothermal conditions using zigzag theory,” Mechanics Based Design of Structures and Machines, Vol. 51, No. 8, pp. 4709–4730, Aug. 2023, https://doi.org/10.1080/15397734.2021.1977659
-
R. K. Bhamu, A. Shukla, S. C. Sharma, and S. P. Harsha, “Vibration response of steam turbine healthy and cracked blade under the stress stiffening and spin softening effects,” Proceedings of the Institution of Mechanical Engineers, Part K: Journal of Multi-body Dynamics, Vol. 236, No. 2, pp. 224–243, Feb. 2022, https://doi.org/10.1177/14644193221078656
-
I. Aarab, K. E. Amari, A. Yaacoubi, A. Etahiri, and A. Baçaoui, “Optimization of the flotation of low-grade phosphate ore using doe: a comparative evaluation of fatty acid formulation to sodium oleate,” Mining, Metallurgy and Exploration, Vol. 40, No. 1, pp. 95–108, Dec. 2022, https://doi.org/10.1007/s42461-022-00706-w
About this article

The authors have not disclosed any funding.
The datasets generated during and/or analyzed during the current study are available from the corresponding author on reasonable request.
The authors declare that they have no conflict of interest.
