Abstract
The high stiffness and low mass gearbox structure design requirements were met through multi-objective optimization based on finite element modal analysis. The correlation between structural parameters and optimization objectives was identified, providing guidance for optimal design. A parametric finite element model of the box cover was established to calculate the first-order modal shape and equivalent stiffness. By using mass and equivalent stiffness as optimization objectives, a discrete data set was constructed with key dimensions of the box cover as design variables, from which a surrogate model was obtained. Standard response surface and full second-order polynomial fitted response surface function were applied after error verification. Different optimization algorithms were employed to search for the optimal value, resulting in obtaining design variables meeting the optimization objectives. The results indicated a reduction in optimized mass by approximately 6.8 %, with an error of less than 1 %.
Highlights
- The correlation between structural parameters and optimization objectives was identified, providing guidance for optimal design.
- A parametric finite element model of the box cover was established to calculate the first-order modal shape and equivalent stiffness.
- Standard response surface and full second-order polynomial fitted response surface function were applied after error verification.
1. Introduction
The gearbox is a critical component of the reducer, playing an indispensable role in safeguarding the internal mechanical structure and ensuring overall load stability [1, 2]. However, the current design approach for the box lid lacks clarity regarding its structural-performance relationship, leading to high prototype and labor costs. This hinders product development cycle reduction and adaptation to modern industry’s specialized production and rapid market response [3, 4]. Given that gearbox excitation vibration occurs during operation, understanding modal characteristics of the box lid is essential for optimization design [5]. The application of numerical technology in engineering has led to a trend towards expressing approximation function relationships with accurate calculations within local ranges using methods such as DOE (Design of Experiment) optimization. By selecting a regression model, complex response relationships can be fitted with good robustness [6]. Utilizing DOE optimization enables multi-objective optimization of the box lid to enhance stability and cost performance while improving stiffness and yielding economic and social benefits. Therefore, this paper focuses on equivalent stiffness as an optimization basis for lightweight design and model optimization of the box lid. ANSYS is widely used finite element analysis software capable of addressing engineering problems across various industries. It facilitates not only simple linear analysis but also complex nonlinear system analysis. Its adaptive grid offers flexibility in displaying problems while effectively solving difficult convergence calculation issues related to nonlinear transient dynamics or completely coupled strength analyses. Consequently, multi-objective optimization design and analysis are achieved based on modal analysis.
2. Model establishment and parameterization
2.1. Determination of optimization variables
Parameterized model of the part is established, and design variables (structural parameters) and optimization objectives (mass, peak stress, first order natural frequency, equivalent stiffness, etc.) are determined according to the geometry of the part. The parametric modeling and analysis are carried out by using Creo and ANSYS/Workbench. According to the preliminary analysis results, the overall calculation workload is very large. According to the force characteristics of different parts, the key structural parameters are selected as design variables. The optimization objectives are selected as mass, peak stress and first order effective natural frequency, etc. Because the influence of changes in different structural dimensions on the mass and strength is unknown, it is necessary to carry out sensitivity analysis on each dimension parameter and select design variables reasonably. Sensitivity is represented as the gradient change of function to independent variable in mathematics, and the response speed of performance parameters to structural parameters in structural design, which has important guiding significance for the optimization and modification of the model. Sensitivity is essentially the derivative of the response surface function (objective function) to the optimized variable.
2.2. Design of parametric models
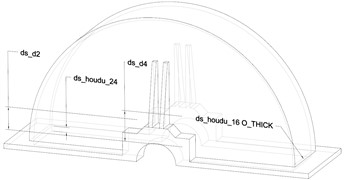
The model and parametric size of the upper box cover of the transmission device are shown in Fig. 1. In order to ensure the efficiency of simulation calculation, under the premise of keeping the assembly size of each component unchanged, the structures that have less impact on the performance and quality of the structure are removed. According to the structural characteristics, there are four kinds of parameterized sizes, namely the thickness of the bottom plate ds_houdu_24 (code P1), the thickness of the semicircular shell ds_houdu16O_THICK (code P2), the fixed size of the trapezoidal rib plate ds_d4 (code P3), and the height of the bearing seat boss ds_d2 (code P4). The design range of these four types of parameterized sizes is shown in Table 1, which can ensure that there is no structural interference or reference failure under the condition of limit size. According to the characteristics of the model structure size, there will be no structural errors when the upper and lower limits of the equivalent value are changed, so the lower limit of the size is set to 90 % of the initial size, and the upper limit of the size is 110 % of the initial size.
Table 1The value range of the size variable of the box lid
Design variable | Code | Initial size / mm | Lower limit of size / mm | Upper limit of size / mm |
ds_houdu_24 | P1 | 24 | 21.6 | 26.4 |
ds_houdu16O_THICK | P2 | 16 | 14.4 | 17.6 |
ds_d4 | P3 | 148 | 133.2 | 162.8 |
ds_d2 | P4 | 110 | 99 | 121 |
Fig. 13D model and parameterized size of upper box lid
2.3. Modal analysis
The load of the upper box lid in the transmission device is relatively small, so the free modal analysis is carried out without considering the prestress. The modal analysis module is established in ANSYS Workbench to connect with the model data in real time. The material of the upper box lid is Q235. After defining the material properties, the quality is parameterized and the code is set as P5. The solving algorithm of the software solver has universality, and the analysis content ranges from static linear to complex dynamic, and even nonlinear multi-coupling physical field operation. In terms of grid division, the software can carry out large deformation analysis of thin-walled parts through the adaptive grid function.
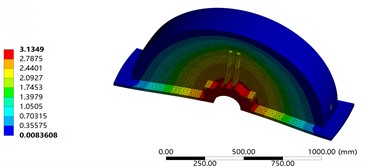
In the grid division stage of the model, in order to ensure high computational efficiency and accuracy, the grid division mode is set as adaptive, and the grid resolution level is 7. The transition of different planes is selected as slow mode, and the span angle center is selected as medium mode. The final result is that the number of units is 59587 and the number of nodes is 110948. The results are shown in Fig. 2. Since the seventh order mode is the actual calculation result under the free modal condition, the natural frequency of the seventh order is extracted as the target variable and the code is set as P6. After the modal analysis, the grid is encrypted and calculated again. The results show that the deviation of P6 before and after the encryption is only 0.12 %, and the initial grid accuracy meets the requirements. The seventh order vibration mode diagram of the upper box lid is shown in Fig. 3. It can be seen that the maximum relative vibration position is located at the bearing seat position, and the corresponding natural frequency is 144.06 Hz.
Fig. 2Mesh partition results
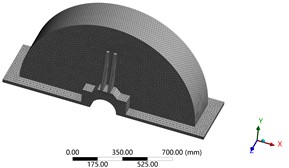
Fig. 3The seventh-order mode shape
3. Lightweight design based on modal results
3.1. Calculation of discrete sample data
Since the value range of design variables has the characteristics of small changes and symmetry, the central composite design method is preferred to construct sample data. Through continuous data interaction and iterative operation, the optimization objectives corresponding to different design variables are finally obtained. These sample data are the key to complete the fitting of response surface function. If the fitting function is insufficient in accuracy, the value range of the sample and the sampling scheme need to be readjusted. The parallel calculation forms of the optimization objectives P5 and P6 are shown in Fig. 4 and Fig. 5 respectively. Under the conditions of central group and design method, the combination structure of design variables and the change of sample value of the optimization objectives can be obtained respectively, which all cover the value boundary and the target extreme value.
3.2. Fitting of response surface functions
Genetic Aggregation (GA), Standard Response Surface-Full 2nd Order Polynomials (SRS) and Kriging (Kriging, SRS) were used respectively. K) Construct the response surface function. Compared the fitting accuracy of various response surface functions, the fitting decision coefficient R2, root mean square difference RMS, Relative Maximum Absolute Error, RMAE and Relative Average Absolute Error (RAAE) are used as the evaluation basis, and the error determination results are shown in Table 2.
Fig. 4Optimizing objective of P5
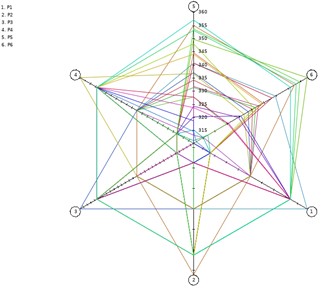
Fig. 5Optimizing objective of P6
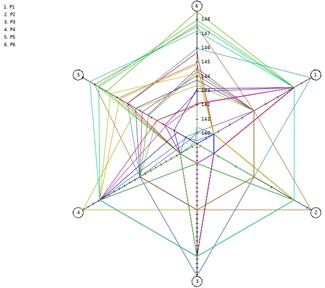
Table 2Error judgment and comparison results
Target parameter | Response surface form | R2 | RMS | RMAE | RAAE |
P5 | GA | 1 | 0 | 0 | 0 |
SRS | 1 | 2.5e-5 | 0 | 0 | |
K | 1 | 1.3e-12 | 0 | 0 | |
P6 | GA | 1 | 0.003 | 0.31 | 0.10 |
SRS | 1 | 0.006 | 0.39 | 0.16 | |
K | 1 | 4.9e-10 | 0 | 0 |
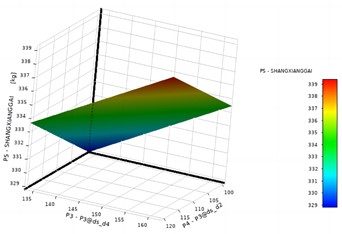
It can be seen that the structure achieves good response surface fitting accuracy under the condition of free modal analysis. Due to the good linearity of the model, the response surface function fitted by standard response surface and full second-order polynomial is selected as the research object, and its three-dimensional response surface characteristics are shown in Fig. 6 and Fig. 7.
Fig. 6Response surface characteristics of P5
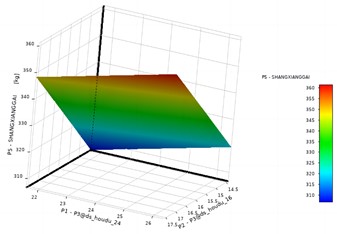
a) Response of variables P1 and P2
b) Response of variables P3 and P4
Fig. 7Response surface characteristics of P6

a) Response of variables P1 and P2
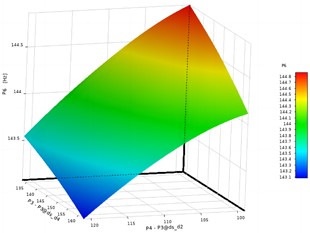
b) Response of variables P3 and P4
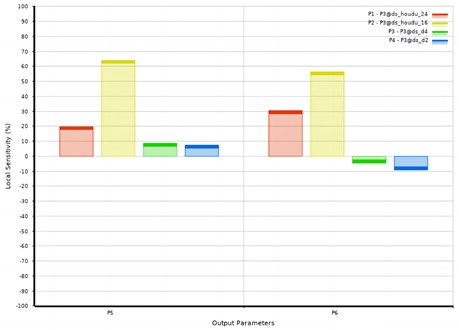
In these diagrams related to response surface functions, the axis title is named as code-P3@design variable. It can be seen that the quadratic relationship between design variables and optimization objectives is not significant, especially the linearity of variables P1 and P2 is obvious. The sensitivity analysis results of design variables to the optimization target are shown in Fig. 8. It can be seen that compared with P3 and P4, the change rate of variables P1 and P2 has a greater impact on the target value.
Fig. 8Sensitivity of the design variable to the optimization objective
3.3. Verification of optimization results
After completing the fitting and verification of the response surface function, it is necessary to select a reasonable optimization algorithm to solve the extreme value of the function. Aiming at the requirements of lightweight design of upper box lid, the optimization mathematical function is defined as min(P5), and the optimization objective P6 is converted into boundary conditions, that is, the minimum value of part quality is obtained under the premise that the natural frequency is not reduced. Multi-Objective Genetic Algorithm (MOGA) and Sequential Quadratic Programming (Schittkowski modified, Sequential Quadratic Programming) Parameter variables and target extreme values obtained from NLPQL are shown in Table 3. It can be seen that under the premise of ensuring that the natural frequency is not reduced, the NLPQL algorithm can reduce the weight of the upper box lid by 6.8 % and the MOGA algorithm can reduce the weight by 6.1 % during the extreme value search process, and the lightweight effect of the two algorithms is relatively obvious.
Table 3Comparison of optimization results
Algorithm | P1 / mm | P2 / mm | P3 / mm | P4 / mm | P5 / kg | P6 / Hz | Weight loss rate / % | Verification | |
P5 | P6 | ||||||||
Initial value | 24 | 16 | 148 | 110 | 334.08 | 144.06 | |||
NLPQL | 26.4 | 14.9 | 133.2 | 99 | 311.43 | 144.05 | 6.8 % | 0.35 % | 0.28 % |
MOGA | 24.9 | 15.4 | 133.3 | 99.5 | 313.47 | 144.08 | 6.1 % | 0.36 % | 0.33 % |
4. Conclusions
Using the finite element analysis software ANSYS, the finite element model of the box is established to analyze its own modal characteristics. Aiming at reducing redundant materials, the lightweight structure of the box is designed, and the resonance of the box is avoided through modal analysis of the lightweight box. At present, the high-power gearbox using this method has been mass-produced, and the weight of the gearbox box after lightweight is reduced by 6.8 %, so as to achieve the purpose of lightweight. With the rapid development of industry, higher and higher requirements have been put forward for the reliability, bearing capacity, volume and weight of the box. At the same time, lightweight technology is of great significance to reduce the production cost of enterprises. How to reduce the weight of the gearbox as much as possible under the premise of satisfying the performance is a key issue facing the gearbox design, in which the lightweight of the gearbox is the key to the lightweight of the gearbox.
References
-
J. Kang and S. Zeng, “Uncertainty quantification in operational modal analysis of time-varying structures based on time-dependent autoregressive moving average model,” Journal of Sound and Vibration, Vol. 548, No. 1, p. 117549, Mar. 2023, https://doi.org/10.1016/j.jsv.2022.117549
-
H. D. Chalak, A. M. Zenkour, and A. Garg, “Free vibration and modal stress analysis of FG-CNTRC beams under hygrothermal conditions using zigzag theory,” Mechanics Based Design of Structures and Machines, Vol. 51, No. 8, pp. 4709–4730, Aug. 2023, https://doi.org/10.1080/15397734.2021.1977659
-
R. K. Bhamu, A. Shukla, S. C. Sharma, and S. P. Harsha, “Vibration response of steam turbine healthy and cracked blade under the stress stiffening and spin softening effects,” Proceedings of the Institution of Mechanical Engineers, Part K: Journal of Multi-body Dynamics, Vol. 236, No. 2, pp. 224–243, Feb. 2022, https://doi.org/10.1177/14644193221078656
-
A. Daşdemir, “A modal analysis of forced vibration of a piezoelectric plate with initial stress by the finite-element simulation,” Mechanics of Composite Materials, Vol. 58, No. 1, pp. 69–80, Mar. 2022, https://doi.org/10.1007/s11029-022-10012-7
-
I. Aarab, K. E. Amari, A. Yaacoubi, A. Etahiri, and A. Baçaoui, “Optimization of the flotation of low-grade phosphate ore using doe: a comparative evaluation of fatty acid formulation to sodium oleate,” Mining, Metallurgy and Exploration, Vol. 40, No. 1, pp. 95–108, Dec. 2022, https://doi.org/10.1007/s42461-022-00706-w
-
X. Yin, Z. Huang, and Y. Liu, “Damage features extraction of prestressed near-surface mounted CFRP beams based on tunable Q-factor wavelet transform and improved variational modal decomposition,” Structures, Vol. 45, No. 1, pp. 1949–1961, Nov. 2022, https://doi.org/10.1016/j.istruc.2022.10.036
About this article

The authors have not disclosed any funding.
The datasets generated during and/or analyzed during the current study are available from the corresponding author on reasonable request.
The authors declare that they have no conflict of interest.
