Abstract
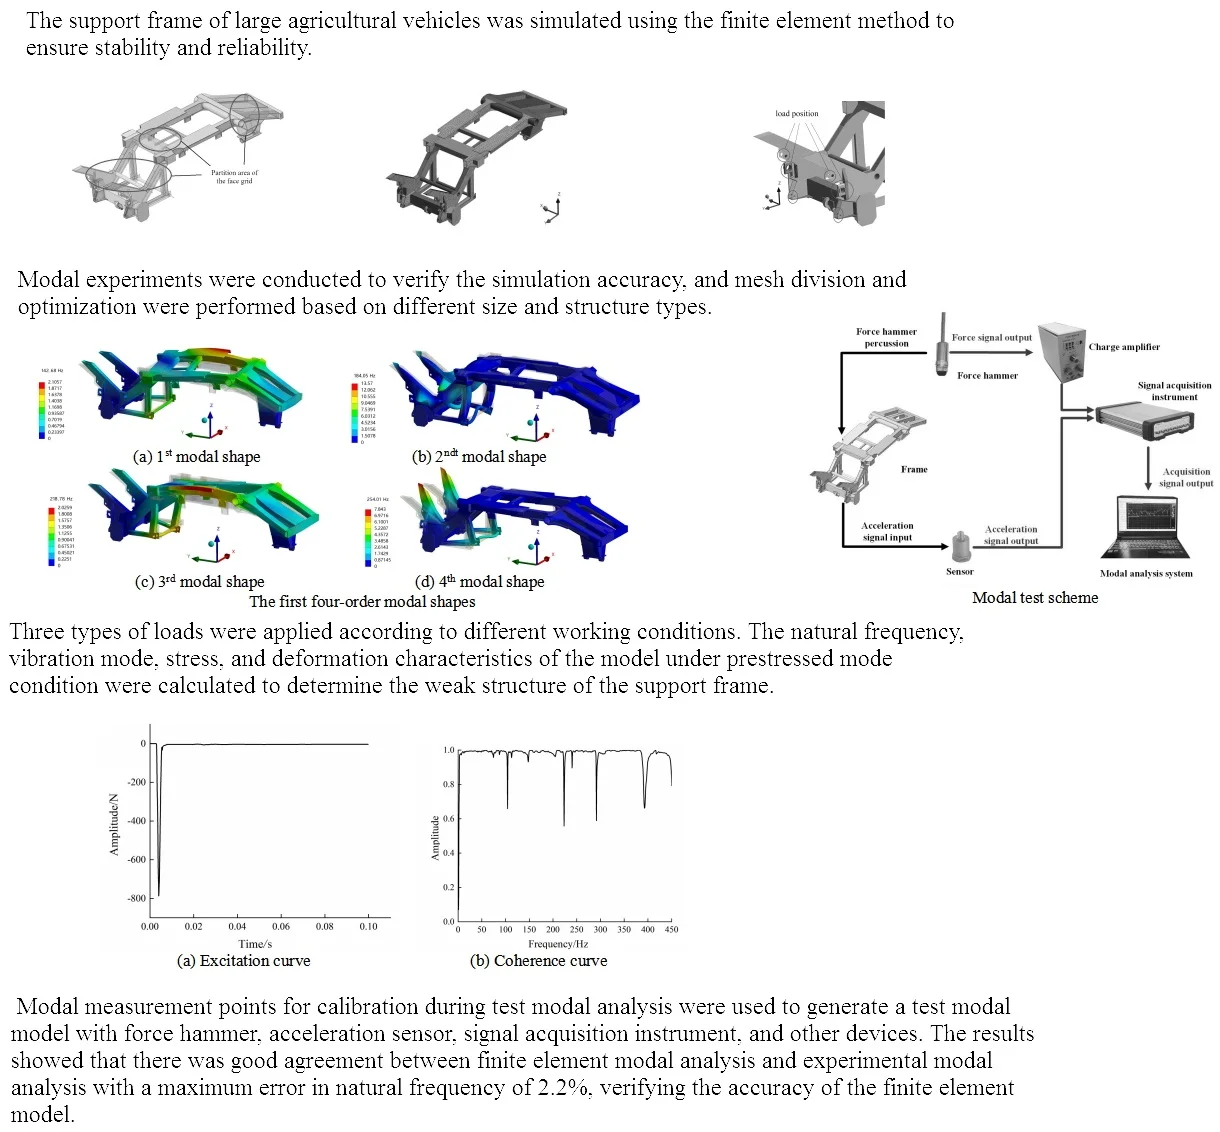
The support frame of large agricultural vehicles was simulated using the finite element method to ensure stability and reliability. Modal experiments were conducted to verify the simulation accuracy, and mesh division and optimization were performed based on different size and structure types. Three types of loads were applied according to different working conditions. The natural frequency, vibration mode, stress, and deformation characteristics of the model under prestressed mode condition were calculated to determine the weak structure of the support frame. Modal measurement points for calibration during test modal analysis were used to generate a test modal model with force hammer, acceleration sensor, signal acquisition instrument, and other devices. The results showed that there was good agreement between finite element modal analysis and experimental modal analysis with a maximum error in natural frequency of 2.2 %, verifying the accuracy of the finite element model.
Highlights
- The support frame of large agricultural vehicles was simulated using the finite element method to ensure stability and reliability.
- Modal experiments were conducted to verify the simulation accuracy, and mesh division and optimization were performed based on different size and structure types.
- The natural frequency, vibration mode, stress, and deformation characteristics of the model under prestressed mode condition were calculated to determine the weak structure of the support frame.
1. Introduction
Agricultural vehicles typically operate at low speeds and heavy loads, necessitating a support frame with high stability and strength. During operation, the inertia force from the engine and other rotating parts leads to complex vibration conditions in the support frame. Resonance phenomena may occur when the excitation frequency falls within the natural frequency range, resulting in significant deformation of the support frame and performance issues such as bolt loosening and fatigue damage, ultimately impacting overall machine reliability and production efficiency. In engineering applications, the low-order frequency significantly influences the vibration characteristics of support frames due to their prolonged low-frequency vibration and large amplitude. Conversely, high-frequency vibrations result in smaller amplitudes, rapid decay of transient response components, and easier stabilization of the structural system. Therefore, the risk associated with low-frequency vibrations is higher than that of high-frequency vibrations. The performance of the support frame, as a critical bearing component in agricultural vehicles, has a direct impact on agricultural production.
The modal analysis of the frame can verify whether the excitation generated by the internal vibration source is within the resonance frequency range, and obtain the relative vibration amplitude of different structural positions. Therefore, in the subsequent structural improvement, the design variables and optimization objectives of the frame performance optimization will be more reasonable, which can avoid the excitation frequency and prevent the resonance phenomenon, and fundamentally enhance the stability and reliability of agricultural machinery. It is imperative to conduct an in-depth investigation into the vibration characteristics of the support frame, comprehensively understand its vibration and vibration coupling characteristics under various excitations, and effectively mitigate machine-wide vibrations and noise while enhancing structural integrity.
2. Finite element analysis of support frame
2.1. The establishment of finite element model
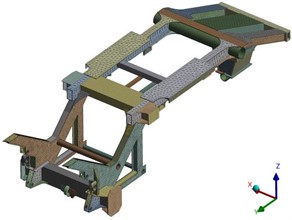
The three-dimensional model of the support frame was imported into the finite element analysis software ANSYS Workbench and subsequently underwent appropriate simplification. Non-essential features such as part chamfers and mounting holes, which had negligible impact on overall model meshing quality, were disregarded. Furthermore, materials were assigned, meshing was refined, and constraints were applied. The support frame comprises several thin-walled components with a thickness ranging from 5-10 mm, which is relatively small in comparison to the overall structure. Directly dividing the grid without processing would lead to an increase in computational workload. Midface extraction can be employed for simplifying the thin-walled parts of the model. To enhance computational efficiency, midface extraction processing of these thin-walled parts is conducted within the Design Modeler module.
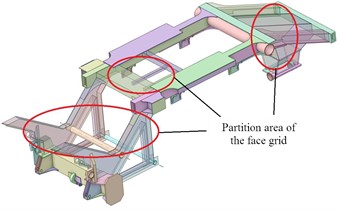
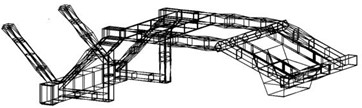
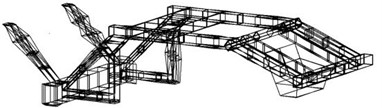
Mesh division, as a critical component of model pre-processing, exerts significant influence on the accuracy of subsequent strength and modal analysis results. The support frame exhibits complex structures and non-uniform sizes, rendering the tetrahedron-led method an expedient choice for accelerating the division process and enhancing grid precision. To ascertain the superior quality of the model post midplane extraction compared to its pre-processed state, identical grid divisions are applied to both iterations of the support frames. Typically serving as a benchmark for evaluating mesh quality, grid measurement yields an average unit quality of 0.36, indicating subpar performance. In contrast, the treated model demonstrates an average mesh quality of 0.71, underscoring its enhanced quality relative to its untreated counterpart. The optimized grid division model is shown in Fig. 1.
Fig. 1The optimized grid division model
The external load, in addition to its own weight, is distributed as follows: the engine load acts on the rear, the fan load acts on the front, and the picking head and cab loads act on the front. The load is connected to the picking head suspension through three hinge holes on the rack. The forces acting on these three hinge holes are intricate, as depicted in Fig. 2(a). All loads can be applied in the Workbench, and the direction of these loads is shown in Fig. 2(b).
Fig. 2Setting of load
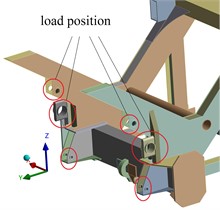
a) Load position of hinge holes
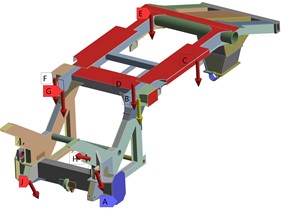
b) Load direction
2.2. Finite element modal analysis
Modal analysis, as a research methodology in the field of structural dynamics, is commonly employed for studying structural vibrations. It encompasses two main approaches: finite element modal analysis and experimental modal analysis. The former involves discretizing the structure, establishing a mathematical model to determine system eigenvalues, and solving for the eigenvalues and eigenvectors of the system – which represent its natural frequencies. ANSYS Workbench is employed for conducting theoretical modal analysis of the frame, which encompasses free and prestressed modes within the software. The free mode represents the unconstrained state of the structure, reflecting its inherent properties. Conversely, the prestressed mode depicts the modal solution under specific boundary conditions and loads, showcasing structural characteristics under constraints. While free modal analysis is easily simulated but costly to conduct experimentally, it becomes challenging due to the large mass and high stiffness of the support frame, making it difficult to achieve free boundary conditions using springs. Therefore, prestressed modal analysis provides a more accurate representation of modal characteristic parameters under operational conditions.
The first four-order modal shapes were depicted in Fig. 3. It is evident from the figure that the first-order natural frequency is 142 Hz, with an overall vibration mode characterized by torsional motion of the welding frame around the axis, and bending of both left and right longitudinal beams as well as the back longitudinal beam along the axis in unison, with maximum displacement occurring at midspan of the left and right longitudinal beams. The second order natural frequency is 184 Hz, revealing a vibration mode where the entire frame exhibits sinusoidal bending on the axis coupled with torsional motion around the axis, with maximum amplitude located at a specific position on welded frame. The natural frequency of the third order is 218 Hz, and the mode is wavy bending on the -axis, while twisting on the -axis, and the maximum amplitude is located at the stringer position. The fourth order natural frequency is 254 Hz, the mode is a torsional mode on the -axis, and the maximum amplitude is located at the welding frame position.
Fig. 3The first four-order modal shapes
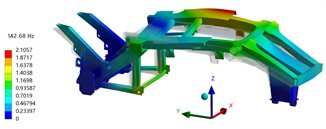
a) 1st modal shape
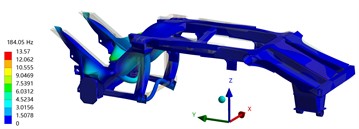
b) 2ndt modal shape
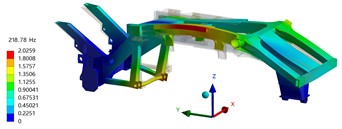
c) 3rd modal shape
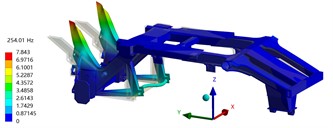
d) 4th modal shape
2.3. Strength analysis
The equivalent stress and total deformation under loading conditions are illustrated in Fig. 4. It is observed that, due to the planar configuration of the mechanism, the maximum equivalent stress occurs at the joint of the rear bridge welding frame following a shift in the center of gravity, with a peak value of 105 MPa. Under standard operating conditions, with a safety factor of 1.5, the allowable stress is 230 MPa. Thus, the maximum stress remains significantly below this threshold at 230 MPa. Consequently, there is no necessity for stress optimization. The total deformation spans from 0 to 0.841 mm, with maximal deformation occurring in the outer connecting plate; minimal distortion takes place within the main body itself. As such, it can be concluded that under transportation conditions, structural strength aligns with design requirements.
Based on the strength analysis, it can be concluded that the support frame possesses adequate strength to meet operational requirements. Subsequent optimization focuses on reducing weight while maintaining optimal stiffness and strength, rather than prioritizing it as the primary objective of the optimization process. The support frame undergoes finite element analysis to assess stress and deformation under unloading conditions, as depicted in Fig. 5. The maximum equivalent stress is concentrated at the joint of the rear axle welded frame, reaching a peak value of 126 MPa. Overall stress levels predominantly remain below 50 MPa, significantly lower than the allowable stress threshold of 230 MPa even without optimization. The total deformation range for the support frame spans from 0 to 0.939 mm, with the outer connecting plate exhibiting maximum deformation while minimal distortion occurs within the main body structure. Consequently, it can be concluded that the structural integrity under unloading conditions satisfactorily aligns with design specifications.
Fig. 4Strength analysis results under loading conditions
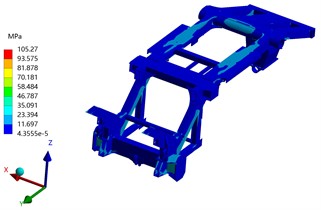
a) Stress nephogram
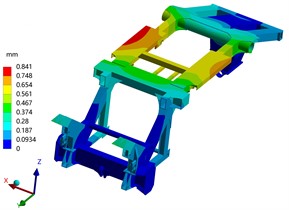
b) Displacement nephogram
Fig. 5Strength analysis results under unloading conditions
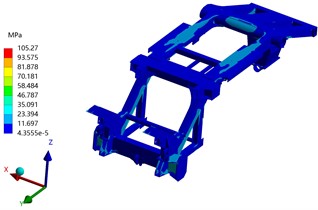
a) Stress nephogram

b) Displacement nephogram
3. Modal characteristic test
3.1. Design of experimental scheme
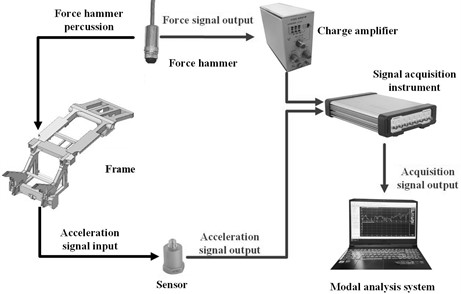
The specific procedure for experimental modal testing is depicted in Fig. 6. Excitation equipment typically involves the use of an exciter and an impact hammer for stimulation. The advantage of the exciter lies in its capacity to deliver substantial excitation energy, as well as its versatility in applying various excitation methods and ease of control. Conversely, the force hammer offers simplicity, making it suitable for field testing without impacting the dynamic characteristics of the specimen. The vibration pickup component comprises a force sensor and an accelerometer sensor, with the latter demonstrating excellent stability and a wide dynamic range. Given the challenges associated with installing and operating a vibration exciter, alongside the convenience and non-intrusive nature of using a force hammer on specimen dynamics, this study opts for utilizing the force hammer as the test vibration excitation equipment while employing an acceleration sensor as the vibration pickup device.
The study primarily focuses on the parameters of low-frequency orders (0-400 Hz). Generally, the single-point excitation method is adequate for inducing modal response. In conjunction with the testing equipment, a combination of single-point excitation and multi-point output method is employed, utilizing a force hammer as the single-point input excitation and an acceleration sensor to capture the output signal. In accordance with Shannon’s sampling theorem, the sampling frequency must be at least twice that of the highest frequency present in the measured signal. Taking into account the impact of low-frequency vibrations generated by large agricultural machinery, an analysis of modal response within 400 Hz is conducted, and an acceleration sampling frequency of 2500 Hz is established. Subsequently, DASP modal analysis software is employed to compute the corresponding pulse signal, response signal, and coherent signal.
Fig. 6Modal test scheme
3.2. Analysis of test results
The results of the signal test are depicted in Fig. 7. It is evident that there is minimal pulse fluctuation from the beginning to the end of the signal, with a brief duration and absence of distortion or overload phenomena, indicating satisfactory quality.
Fig. 7The results of the signal test
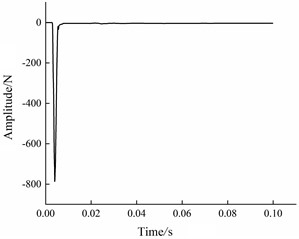
a) Excitation curve
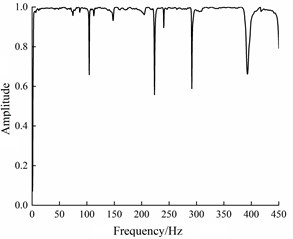
b) Coherence curve
Analysis of the coherence function diagram reveals superior coherence within the frequency range of 0-400 Hz, a significant decrease in coherence at the anti-formant, and near-perfect coherence at other frequencies, signifying high measurement quality. By utilizing modal analysis software to compute the system's response function and correlating the response parameters with the response test model, it is possible to determine the natural frequency and mode shapes. The extraction of second-order frequencies and vibration modes at the front of the rack is illustrated in Fig. 8. As depicted in the figure, significant deformation occurs at the front and side load positions during testing, followed by deformation at the longitudinal beam position, and finally at the rear longitudinal beam position. This pattern closely aligns with results obtained from finite element modal analysis. Consequently, substantial front and side deformation should be considered in subsequent structural improvement processes. By comparing the results of finite element modal analysis and experimental modal analysis, it can be seen that the modal patterns are consistent and the maximum error of natural frequency is less than 2.2 %, which indicates that the finite element model has good accuracy.
Fig. 8The first two-order modal shapes
a) 1st modal shape (139.78 Hz)
b) 2ndt modal shape (181.54 Hz)
4. Conclusions
1) Under the condition of prestress modal analysis, the maximum stress of the support frame is 126 MPa, which is less than the allowable stress of 230 MPa, and the total deformation range is 0-0.94 mm, which meets the strength requirements under different working conditions. It can be seen that for the support frame, it is more effective to improve the stiffness of the overall structure than the strength.
2) According to the test results, it is evident that utilizing a force hammer as the excitation device and an acceleration sensor as the vibration pickup device for modal testing is more suitable for field tests without compromising the dynamic characteristics of the specimen. It is essential to avoid placing measurement points on mode nodes during testing, as this may result in missing multiple modes. Additionally, a limited number of measuring points will lead to similar vibration patterns, while increasing the number of measuring points will yield more accurate results.
References
-
A. Daşdemir, “A modal analysis of forced vibration of a piezoelectric plate with initial stress by the finite-element simulation,” Mechanics of Composite Materials, Vol. 58, No. 1, pp. 69–80, Mar. 2022, https://doi.org/10.1007/s11029-022-10012-7
-
M. R. Zarastvand, M. H. Asadijafari, and R. Talebitooti, “Acoustic wave transmission characteristics of stiffened composite shell systems with double curvature,” Composite Structures, Vol. 292, No. 1, p. 115688, Jul. 2022, https://doi.org/10.1016/j.compstruct.2022.115688
-
R. Talebitooti, M. Zarastvand, and H. Darvishgohari, “Multi-objective optimization approach on diffuse sound transmission through poroelastic composite sandwich structure,” Journal of Sandwich Structures and Materials, Vol. 23, No. 4, pp. 1221–1252, Jun. 2019, https://doi.org/10.1177/1099636219854748
-
H. D. Chalak, A. M. Zenkour, and A. Garg, “Free vibration and modal stress analysis of FG-CNTRC beams under hygrothermal conditions using zigzag theory,” Mechanics Based Design of Structures and Machines, Vol. 51, No. 8, pp. 4709–4730, Aug. 2023, https://doi.org/10.1080/15397734.2021.1977659
-
R. K. Bhamu, “Vibration response of steam turbine healthy and cracked blade under the stress stiffening and spin softening effects,” Proceedings of the Institution of Mechanical Engineers, Part K: Journal of Multi-body Dynamics, Vol. 236, No. 2, pp. 224–243, 2022, https://doi.org/10.1177/ 14644193221078656
-
D. C. Simone, “Modal analysis through response-based FRFs: Additional modes for local diagnoses,” Journal of Sound and Vibration, Vol. 549, No. 1, pp. 101–109, 2023, https://doi.org/10.1016/ j.jsv.2023.117574
About this article

The paper is supported by Qingdao Huanghai University Scientific Research Project (Project number: 2022KJ04).
The datasets generated during and/or analyzed during the current study are available from the corresponding author on reasonable request.
The authors declare that they have no conflict of interest.
