Abstract
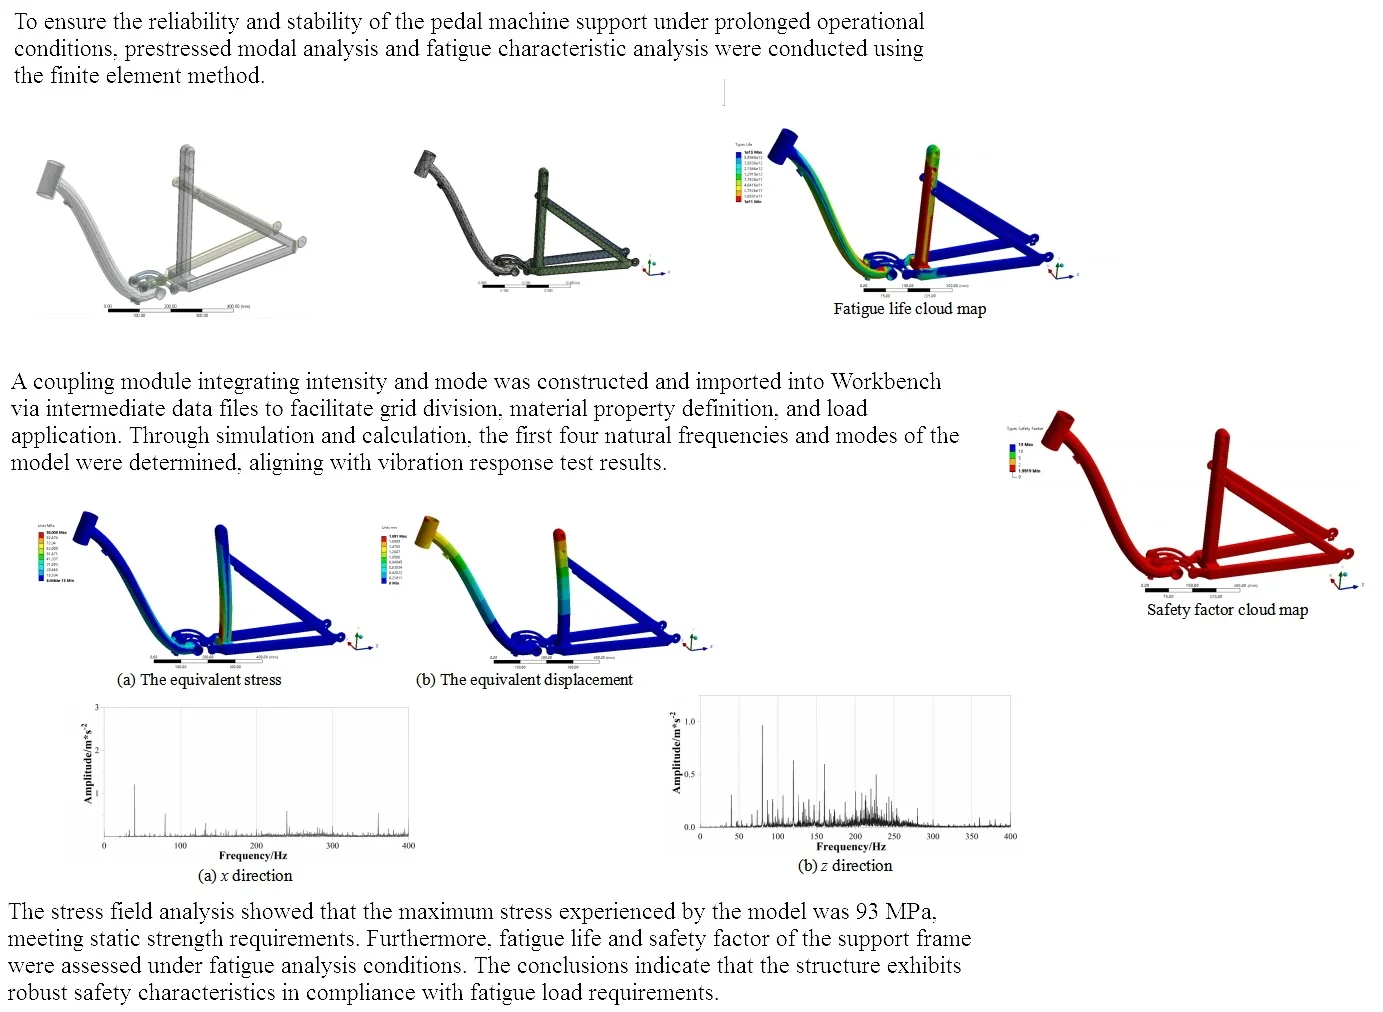
To ensure the reliability and stability of the pedal machine support under prolonged operational conditions, prestressed modal analysis and fatigue characteristic analysis were conducted using the finite element method. A coupling module integrating intensity and mode was constructed and imported into Workbench via intermediate data files to facilitate grid division, material property definition, and load application. Through simulation and calculation, the first four natural frequencies and modes of the model were determined, aligning with vibration response test results. The stress field analysis showed that the maximum stress experienced by the model was 93 MPa, meeting static strength requirements. Furthermore, fatigue life and safety factor of the support frame were assessed under fatigue analysis conditions. The conclusions indicate that the structure exhibits robust safety characteristics in compliance with fatigue load requirements.
Highlights
- To ensure the reliability and stability of the pedal machine support under prolonged operational conditions, prestressed modal analysis and fatigue characteristic analysis were conducted using the finite element method.
- A coupling module integrating intensity and mode was constructed and imported into Workbench via intermediate data files to facilitate grid division, material property definition, and load application.
- Through simulation and calculation, the first four natural frequencies and modes of the model were determined, aligning with vibration response test results.
1. Introduction
The pedal machine is a commonly used piece of sports equipment that effectively facilitates leg muscle exercise and rehabilitation. However, the riding mode and gaps in the assembly process of the relief device can lead to wear on parts and potential fractures in components such as the arc lever arm or differential balance rod within the relief device. Additionally, uneven ground can induce vibration effects, particularly low-frequency vibrations occurring primarily at the fork before the shock absorber under heavy loads [1-2]. The occurrence of vibration problems will exacerbate the fatigue damage of the mechanical structure, making modal characteristics and fatigue response characteristics crucial for ensuring the safety and reliability of the pedal machine. Therefore, it is evident that modal analysis and fatigue analysis are indispensable for verifying the performance of the pedal machine support.
Consequently, three common failure forms may arise due to insufficient strength of parts leading to deformation or fracture caused by ultimate stress exceeding material yield strength [3-4]. In the analysis, it is essential to first determine the maximum load form on the critical section and then assess whether the design complies with safety standards based online marking inspection criteria. During device operation, various types of vibrations are generated. If an external excitation frequency aligns with a specific natural frequency range of the structure, resonance may occur, potentially leading to structural damage [5]. During modal analysis, it is crucial to verify if the natural frequency of the structure corresponds to external frequencies under excitation to prevent resonance failure [6]. Fatigue analysis can predict the service life and safety factor of materials under specific vibration, load and structural conditions, which has an important guiding role in improving the performance of pedal machines. Considering these factors, strength analysis, fatigue analysis, and modal analysis for the support frame are proposed based in FEA method.
2. Prestress modal analysis
2.1. The establishment of finite element model
In ANSYS Workbench, there are two primary methods for constructing models [7]. The first involves utilizing the Design Modeler module within the Workbench, which is suitable for creating simple geometries. The alternative approach is to employ other professional CAD software for modeling, including medium format import and parametric import. Based on the model’s characteristics, solid modeling was utilized for the scaffold, with the 3D solid model established in SolidWorks being imported into Design Modeler in Workbench, as depicted in Fig. 1. It can be seen that there is no point, line and plane loss in the data transmission.
Fig. 1The composition of finite element model
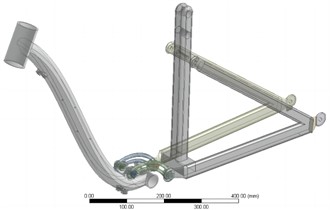
Fig. 2Mesh partitioning
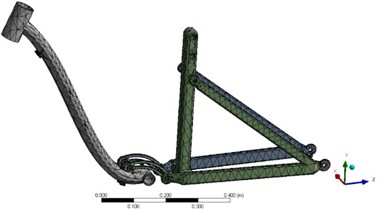
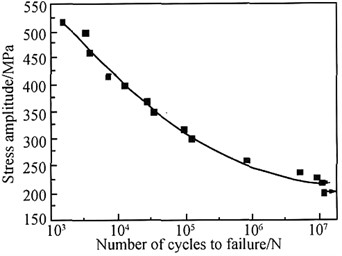
To ensure the lightweight design, aluminum alloy 6061 is employed as the material for the support frame. The material properties are presented in Table 1, and the S-N curve of the material is illustrated in Fig. 3. In finite element analysis, the accuracy and rationality of mesh division directly impact the precision of the finite element analysis results. The Workbench offers a variety of mesh partitioning methods, including automatic partitioning, tetrahedron method, hexahedron method, sweep method, and multi-region method. To comprehensively consider computational efficiency and accuracy, local refinement and optimization techniques were employed to enhance mesh quality, resulting in the mesh partitioning shown in Fig. 2.
Table 1Material property
Material name | Young’ s modulus / GPa | Poisson’s ratio | Density / (kg/m3) | Yield strength / MPa |
Aluminum alloy 6061 | 68 | 0.33 | 2800 | 150 |
Fig. 3S-N curve of the material
A specific support is applied to a part by adding constraints to the part being analyzed. When a constraint is added, it is generally to restrict the movement or rotation of the part in three-dimensional space. In the process of analysis, the stress conditions of the components under actual working conditions are simulated, and some unimportant secondary factors are ignored by limiting the aspects that have a greater impact on the results. In the process of analysis, the degree of freedom of the model should be consistent with the real environment of the component. The center axle and the bottom of the frame are regarded as fixed constraints, and the load is applied to the riser, the connecting hole of the center axle and the front end. The middle connecting hole of the curved lever arm is used as a fixed constraint, and the load is applied to the front and back connecting holes. The upper connecting hole of the U-shaped connecting frame is regarded as a fixed constraint, and the load is applied to the upper hole of the U-shaped connecting frame and the lower connecting foot rod hole.
2.2. Modal characteristics analysis
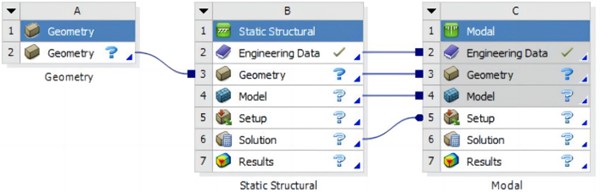
Compared with the free mode, the prestressed mode analysis can better reflect the real working conditions. The coupling unit of the prestressed modal analysis module is shown in Fig. 4. In the actual use of components, there are many orders of natural frequencies, but for components, only the lower order of natural frequencies will affect the components, so the first 4 orders of frequencies are selected for modal analysis in this paper. The solution method of modal analysis is to convert the physical coordinates into modal coordinates, and then use a set of modal coordinates and modal parameters to represent the independent equation, and finally find the modal parameters of the system. General modal analysis is divided into single-degree-of-freedom and multi-degree-of-freedom systems.
Results of the first four modal analyses are shown in Fig. 5. According to the analysis results, the first mode shape of the model is that one side of the rear triangle of the frame wobbles along the -axis, and the other side wobbles slightly in the same direction. The second mode shape is that the two sides of the rear triangle of the frame swing relative along the -axis, and one side of the swing amplitude is large. The front half of the third mode frame fluctuates up and down the -axis. The fourth mode shape is similar to the third mode mode, except that the fourth mode shape oscillates back and forth along the -axis.
Fig. 4The coupling of prestressed modal analysis module
2.3. Static strength analysis
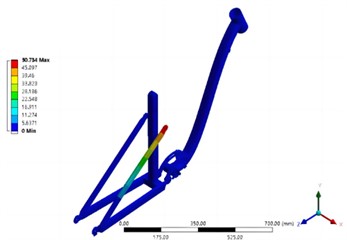
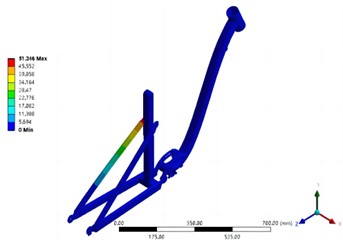
In the prestress modal analysis module, the equivalent stress and displacement of the model can be obtained, as shown in Fig. 6. According to the analysis results, the maximum stress of the whole frame is 93.008 MPa, which occurs at the bottom of the riser. The maximum displacement occurs at the connection between the upper part of the riser and the curved lever arm, and the maximum displacement value is 1.891 mm, which has little weakening on the strength of the structure. It can be concluded that the structure design of the support frame is reasonable, the safety factor is high, and it can meet the static strength requirements.
2.4. Vibration response test
Acceleration sensors were installed at the nodes of different mechanisms of the support frame, and the vibration response of the support frame was tested by hammer method. The vibration response under the condition of maximum amplitude was obtained, as shown in Fig. 7.
Fig. 5Results of the first four modal analysis
a) The first order (46.28 Hz)
b) The second order (49.37 Hz)
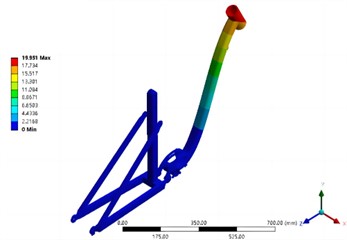
c) The third order (52.27 Hz)
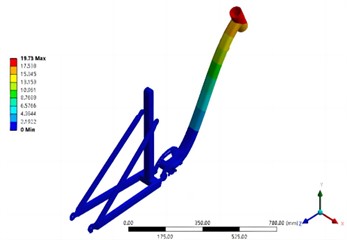
d) The fourth order (66.17 Hz)
Fig. 6Results of static strength analysis
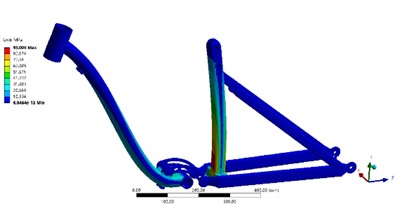
a) The equivalent stress
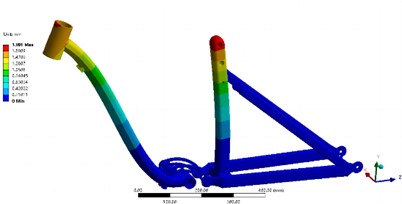
b) The equivalent displacement
From Fig. 7 it can be seen that the distribution of low frequency natural frequency is in good agreement with the simulation results. From the frequency signals in different directions, it can be seen that the axis amplitude is larger than the axis. In the -axis frequency domain signal, its own excitation frequency occupies the absolute dominant level. The effect of coupling excitation frequency is almost negligible. The proper installation of a vibration sensor has a direct impact on its performance. Incorrect installation can lead to readings that are not only influenced by changes in the object being measured, but also by the instability of the sensor itself, resulting in unreliable data. The primary objective of sensor installation and fixation is to achieve the maximum available frequency response for conducting vibration measurements. Given that the condition of the mounting surface affects transferability, various adhesives are available for precisely prepared mounting surfaces. It is essential to mount the accelerometer on a greaseless surface. During both design and installation processes, careful consideration should be given to grounding cable shield or conductor to provide appropriate shielding and prevent grounding loops which can introduce interference as noise into measurement signals at a line frequency of 50-60 Hz.
Fig. 7Results of vibration response test
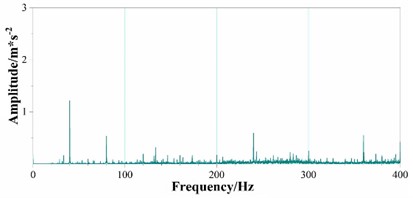
a) direction
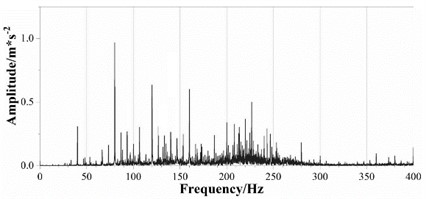
b) direction
3. Fatigue analysis
3.1. Fatigue failure mechanism
In the actual working environment, most components will be subjected to alternating loads, so fatigue failure is the main failure form for components, so the fatigue strength and fatigue life of components are the primary tasks when checking. When the member is subjected to multiple variable loads, the stress value of the member may be lower than the elastic limit, but it is also possible to cause the failure of the member, which is fatigue failure. Since the component will work in different environments, the surface of the component is generally the highest stress part, and it is also the place where cracks and expansion are most likely, so improving the process or design of the surface of the component may extend the life of the component under fatigue. In the analysis, the fatigue characteristics, load conditions and related options of the materials of the support frame and the relief device are determined to carry out fatigue analysis. Infinite life design requires the use of the stress in the component to be controlled at a very low level, the potential of the material cannot be fully developed, for the component that does not need to endure many cycles, infinite life design is very uneconomical. The design that does not cause fatigue damage in the finite long design life of the component is called safe life design or finite life design. Therefore, it is still a challenge to predict the RUL (remaining useful life) of the model reasonably.
3.2. Life prediction
In order to ensure that the RUL meets the requirements of work, two criteria are utilized for analysis: fatigue life and safety factor. The analysis of fatigue life is based on Miner's criterion, where the total fatigue damage of the component is calculated as the sum of the ratio of actual operating cycles at each stress level to the corresponding S-N curve cycles. The linear fatigue cumulative damage theory is suitable for high-cycle fatigue life calculation and can predict the mean fatigue life well. The safety factor module can display the safety factor for all components, with a value less than 1 indicating potential failure.
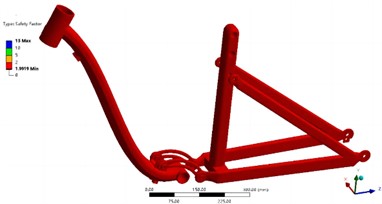
The preliminary results of fatigue life are depicted in Fig. 8. It is evident that, under the influence of load, the weakest points in terms of fatigue life are the bottom of the riser and the axle of the front frame. The static strength analysis confirms that the riser is indeed the weakest component. From a data perspective, the minimum fatigue life is 10e11 times, which satisfies long-term stable usage. The cloud diagram in Fig. 9 illustrates the fatigue safety factor of the support frame. The safety factor represents the ratio between the actual fatigue limit that a component can withstand, and the result obtained from finite element analysis. A ratio greater than 1 indicates that the component can be used safely. It is evident that the minimum safety factor of the frame is 1.99, thus meeting check standards and ensuring safe usage.
Fig. 8Fatigue life cloud map
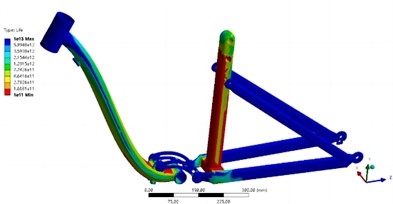
Fig. 9Safety factor cloud map
4. Conclusions
Pedal machine support is the critical load bearing component. Through prestress modal analysis and fatigue analysis, it can be verified that the design of the structure has good stability and safety. Under the verification condition of vibration response test, it can be seen that the finite element model has high precision, and the response frequency matches the natural frequency obviously. At the same time, the feasibility of the finite element analysis method is also verified. It can be seen from the calculation that under the maximum load condition, the maximum stress of the support frame is 93 MPa and the maximum deformation is 1.89 mm. The effective safety factor of the model is 1.99 under periodic load. The S-N curve of materials and Miner's cumulative damage theory are the basis of safe life design.
References
-
X. Liu, X. Wu, and A. D. Calderon, “Analysis and optimization of pre-stressed modal features of ship anchor support parts,” Vibroengineering Procedia, Vol. 54, No. 1, pp. 78–83, Apr. 2024, https://doi.org/10.21595/vp.2024.23831
-
S. R. Jafari and M. Pasbani Khiavi, “Parametric study of the modal behavior of concrete gravity dam by using finite element method,” Civil Engineering Journal, Vol. 5, No. 12, pp. 2614–2625, Dec. 2019, https://doi.org/10.28991/cej-2019-03091437
-
M. Filippoupolitis and C. Hopkins, “Experimental validation of finite element models representing stacked concrete beams with unbonded surface contacts,” Engineering Structures, Vol. 227, No. 2, p. 111421, Jan. 2021, https://doi.org/10.1016/j.engstruct.2020.111421
-
X. Yin, Z. Huang, and Y. Liu, “Damage features extraction of prestressed near-surface mounted CFRP beams based on tunable Q-factor wavelet transform and improved variational modal decomposition,” Structures, Vol. 45, No. 1, pp. 1949–1961, Nov. 2022, https://doi.org/10.1016/j.istruc.2022.10.036
-
R. K. Bhamu, “Vibration response of steam turbine healthy and cracked blade under the stress stiffening and spin softening effects,” Proceedings of the Institution of Mechanical Engineers, Part K: Journal of Multi-body Dynamics, Vol. 236, No. 2, pp. 224–243, 2022, https://doi.org/https://doi.org/10.1177/ 14644193221078656
-
A. Daşdemir, “A modal analysis of forced vibration of a piezoelectric plate with initial stress by the finite-element simulation,” Mechanics of Composite Materials, Vol. 58, No. 1, pp. 69–80, Mar. 2022, https://doi.org/10.1007/s11029-022-10012-7
-
J. Cui, Y. Peng, J. Sun, and B. Li, “Multi-modal stress characteristics under coupling effect of strip and work roll,” International Journal of Precision Engineering and Manufacturing, Vol. 22, No. 10, pp. 1719–1733, Aug. 2021, https://doi.org/10.1007/s12541-021-00559-1
About this article

The authors have not disclosed any funding.
The datasets generated during and/or analyzed during the current study are available from the corresponding author on reasonable request.
The authors declare that they have no conflict of interest.
