Abstract
The safety of wind power equipment under dynamic load is one of the key factors to ensure sustainable energy recovery. In order to effectively improve the reliability of tower structure, the damage identification of flange bolt fracture based on strain mode was studied, and the vibration control and optimization scheme was proposed and verified. The dynamic response of the tower to wind load was calculated using the theory of Davenport spectrum. Combined with computational fluid dynamics, the dynamic load change law of the tower was obtained. Based on ANSYS Workbench, the modal simulation and analysis of the tower were carried out. Under different bolt damage conditions, the distribution characteristics of the strain modal shape of the tower in the axial and radial directions were obtained. The vibration damper was applied to the inside of the tower, and the vibration and stress at different positions under wind load were compared and analyzed to verify the specific vibration reduction and optimization effect. The results show that the strain modal shape of the tower cylinder has a significant peak at the damage site, and the peak height is positively correlated with the damage degree, indicating that the strain modal shape is highly sensitive to the damage. In addition, the vibration and maximum stress of the flange and top position of the tower have been effectively reduced by the shock absorber. The average amplitude of tower top can be reduced by 22.5 %, and the peak stress at the bottom flange position can be reduced by about 38 %.
Highlights
- The dynamic response of the tower to wind load was calculated using the theory of Davenport spectrum.
- Under different bolt damage conditions, the distribution characteristics of the strain modal shape of the tower in the axial and radial directions were obtained.
- The vibration damper was applied to the inside of the tower, and the vibration and stress at different positions under wind load were compared and analyzed to verify the specific vibration reduction and optimization effect.
1. Introduction
The advantages of wind energy lie in its widespread distribution, abundant reserves, high conversion efficiency, cleanliness and lack of pollution, as well as its significant environmental and commercial value [1-3]. Marine wind power generation represents a crucial direction for the development of emerging clean energy sources. The mechanical components within the equipment primarily consist of towers and blades that are vertically erected from the ship’s keel or middle plate. Due to factors such as motor startup, ocean current impact, and tensile loads, wind power equipment is susceptible to operational excitations leading to shock vibrations. These high-frequency excitations significantly influence the fatigue characteristics and reliability of supporting components [4, 5]. Vibration response plays a pivotal role in determining the service life of mechanical components while serving as an important basis for damage prediction. With advancements in ship mechanization, there is an increasing demand for enhanced strength requirements within marine power generation equipment’s mechanical structure. As power processing capacity increases, so does the need for increased mass/stiffness within this equipment itself. The increase in equipment leads to greater moments under strong wind loads and other external forces, causing the tall and flexible towers to shake and swing violently [6]. Failure to control these violent displacements can elevate risks associated with wind turbine collapse while reducing both tower and blade fatigue life spans considerably. Therefore, research on damage identification based on dynamic responses or modal features becomes imperative.
Representative research achievements in damage identification are as follows. Smita [7] proposed a time evolution, generalized, and high pulse frequency acquisition model for structural damage identification, and constructed a three-layer shear frame building model using the generated modal response content, which reflects the relative ability of the structure to generate stable response. Zhilin [8] established an image-based method for damage identification and rapid structural safety assessment of reinforced concrete components, and proposed a comprehensive component damage identification task based on the mechanical damage image dataset of RC components. Schmidt [9] proposed a new method that can identify frequency bands with diagnostic information related to specific cyclic components, so as to determine the optimal frequency band for diagnosing components of interest. This not only detects early damage, but also has robustness to time-varying conditions. It can be used to independently determine the condition of different mechanical components. Gomes [10] particularly emphasized the intelligent signal processing and optimization algorithms based on vibration measurement for damage identification, mainly through the evaluation of vibration and modal data. He discussed the application of optimization algorithms and artificial neural networks in structural monitoring, which can be seen as the starting point for developing SHM systems and data analysis. According to the research status, most of the research on mechanical fault identification focuses on the optimization of detection process or algorithm, lack of the essential analysis of the dynamic response of the model itself structure, which is closely related to the improvement of structure and performance. Therefore, in order to facilitate the subsequent optimization of structure and performance, a damage response and prediction scheme based on modal recognition is studied, the internal relationship between the tower structure and the strain modal is studied, and the specific impact of different bolt failures on the dynamic response is analyzed. The research scheme meets the requirements of structural damage identification and dynamic load response, and effective measures to reduce vibration and stress can be proposed according to the analysis results. This not only brings very objective economic benefits to the enterprise, but also has important theoretical and practical significance for structural health detection.
2. Wind load response and modal analysis of tower structure
2.1. Establishment and simplification of tower model
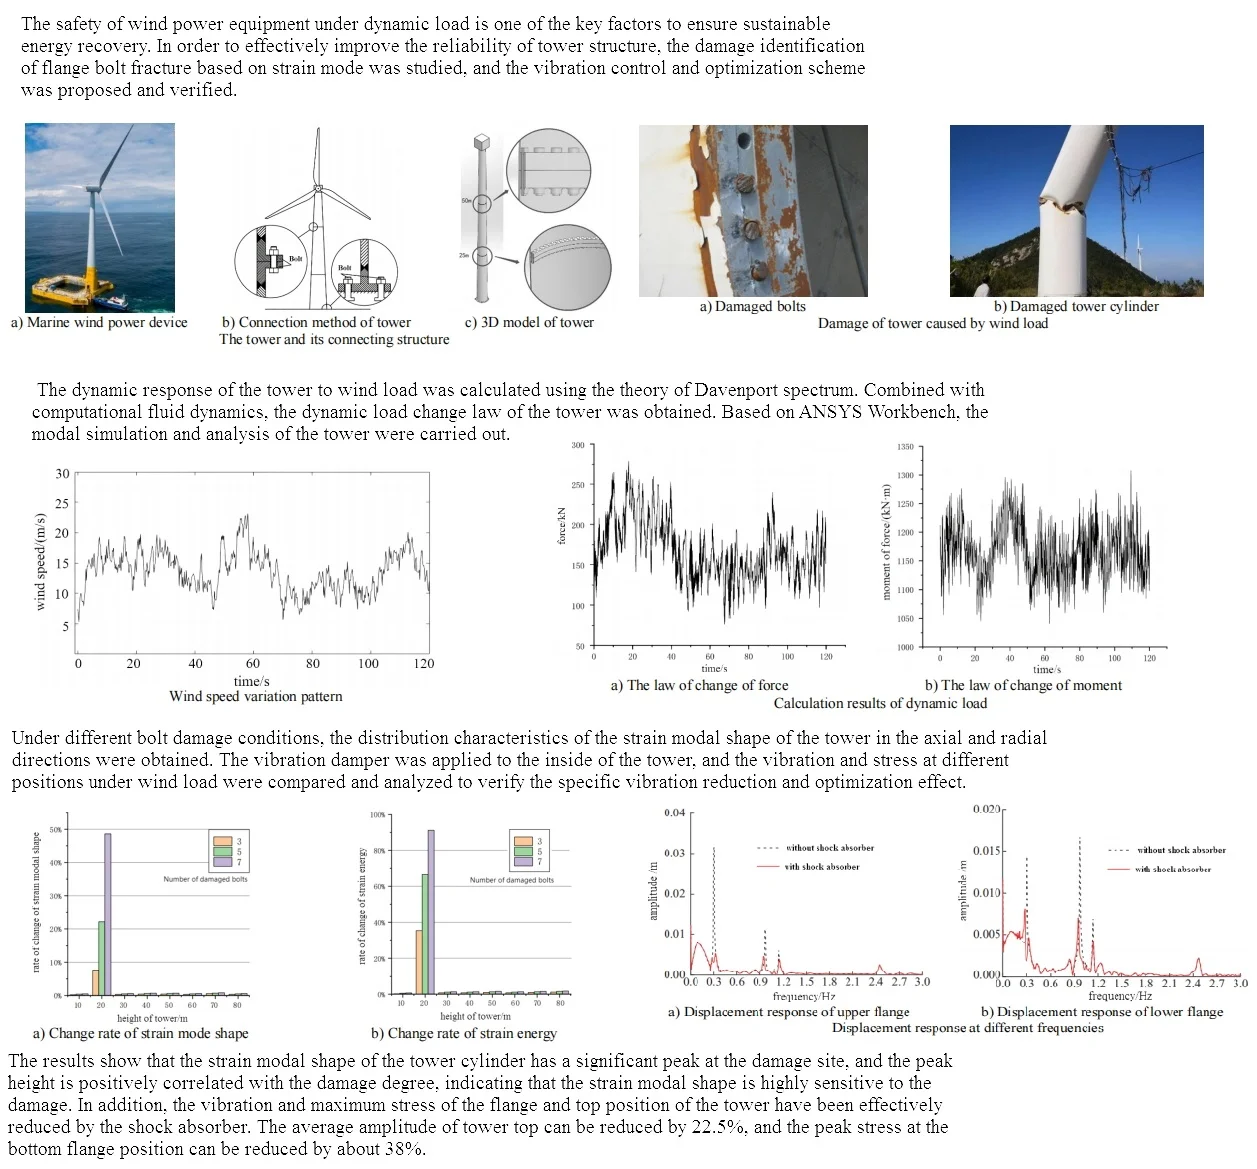
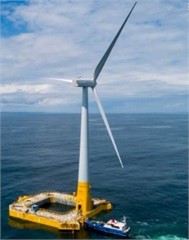
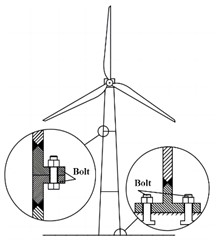
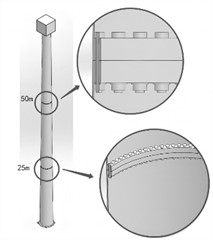
Marine wind power generation equipment is generally designed as a cone-shaped structure, as shown in Fig. 1(a), which has the characteristics of stability and relatively low cost. The photo was taken by author in Qingdao. It is composed of several cylindrical sections, each of which is about 20-30 m long, and each section is rolled and welded from steel plates. The fastening connection of each cylinder section is achieved by welding the flange ring at both ends of the cylinder section and then connecting it with high-strength bolts. In addition, the diameter of the tower varies in the height direction, gradually decreasing from the bottom to the top, and the wall thickness of the tower also becomes thinner from the bottom to the top, as shown in Table 1. The wind power model consists of blades, engine room, three sections of tower, and the corresponding flange rings for each section of tower. Among them, the upper section of the tower is connected by a single row of L-shaped flange bolts, and the bottom end is connected by a double row of T-shaped flange bolts, as shown in Fig. 1(b) and Fig. 1(c). The number and diameter of bolts at different positions are shown in Table 2.
Table 1The structure and physical parameters of the tower cylinder
Tower height / m | Tower base diameter / m | Thickness of tower base / mm | Tower top diameter / m | Thickness of tower top / mm | Material type | Density / (kg/m3) | Young’s modulus /mPa | Poisson’s ratio |
75 | 4 | 30 | 2.6 | 18 | Q235 | 7850 | 2.1e5 | 0.3 |
Table 2Bolt parameters for different positions
25 m altitude position | 50 m altitude position | ||
Number of bolts | Diameter of bolts | Number of bolts | Diameter of bolts |
98 | M50 | 90 | M40 |
Fig. 1The tower and its connecting structure
a) Marine wind power device
b) Connection method of tower
c) 3D model of tower
2.2. Calculation of dynamic loads
The load-bearing capacity of the tower, in addition to the gravity of the blades and the engine room, is mainly due to the bending and shear effects of the blades on the tower caused by wind [11]. The damage of tower under wind load is shown in Fig. 2 (The photo in Fig. 2 was taken by author in Qingdao), mainly occurring at the flange joint, in the form of bolt fracture and cylinder damage. Therefore, the calculation of wind load is very critical for the identification and prediction of damage. The existence of differences in surface air pressure leads to the non-uniformity and randomness of wind, and the pulsating wind generated by these two characteristics is the source of vibration in the wind turbine structure. Therefore, the analysis of pulsating wind is of great significance for the study of wind power response. The intensity and wind speed of pulsating wind vary irregularly with time, and its characteristic parameters include pulsating wind speed power spectrum, turbulence integral length, spatial correlation, etc. The power spectrum of fluctuating wind speed is an important parameter that expresses the characteristics of fluctuating wind spectrum. There are two methods to obtain the spectrum of fluctuating wind speeds: one is to perform Fourier transform on the curves and functions obtained from wind observation and analysis data, and the other is to import strong wind data into low-frequency filters and fit their output curves. Irregularity is a significant characteristic of pulsating wind, but there is a certain correlation between the wind speed time histories of two points in the wind field, which is spatial correlation. The distance and frequency of two points in space determine the degree of correlation between the two points. This spatial correlation is manifested by the small probability of a large change in wind speed at one of the correlation points, while the probability of a large change in wind speed at another correlation point at a long distance is small.
Fig. 2Damage of tower caused by wind load
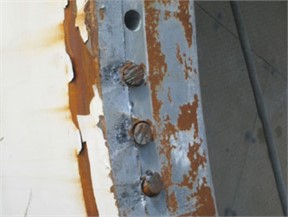
a) Damaged bolts
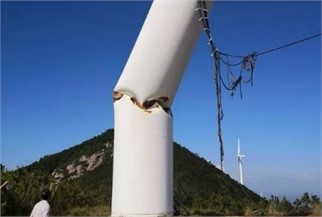
b) Damaged tower cylinder
The Davenport spectrum is the most widely used in wind speed spectrum calculation. The Davenport spectrum records and analyzes strong winds, and summarizes that the turbulence scale in the fluctuating wind speed spectrum does not change with height. It is believed that the turbulence integral scale is a constant, which greatly facilitates people's calculation and use. The Davenport spectrum is the most widely used in wind speed spectrum calculation. The expression for the Davenport spectrum is:
where is the power spectrum of fluctuating wind speed, is the average wind speed at a height of 10 m, is the frequency of fluctuating wind, and is the turbulence integral scale coefficient.
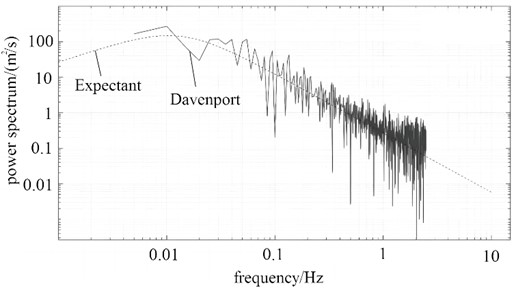
Using linear filtering method to simulate the time history of fluctuating wind speed, and verifying the reliability of simulating fluctuating wind speed based on Davenport spectrum. Write a pulsating wind speed program using Matlab software to simulate the time history curve of pulsating wind speed when the rated wind speed of the fan is 16 m/s. The number of sampling points is 500, the ground roughness coefficient is 0.00464, and the height of the sampling point is 70.65 m from the tower base, with a time step of 0.2 s and a time step of 120 s. The 16 m/s fluctuating wind speed time history is shown in Fig. 3, and the spectral comparison of wind speed reliability is shown in Fig. 4. It can be seen that the Davenport spectrum has the same trend as the target spectrum, with small errors, and the simulation of 16m/s fluctuating wind speed is reliable.
Fig. 3Wind speed variation pattern
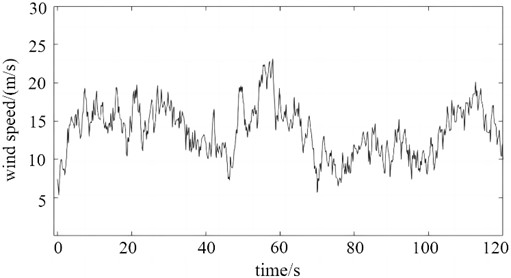
Fig. 4Verification of davenport spectra
2.3. Simulation of dynamic response under wind load
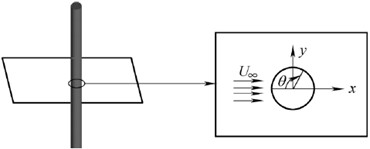
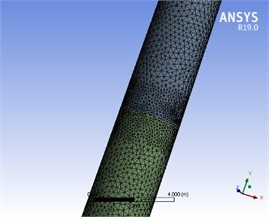
For the load of the tower cylinder, it can be simplified as a two-dimensional transverse flow problem with wind velocity flowing in the positive direction of axis. Assuming that the diameter of the tower barrel is , the distance between the boundary and y boundary from the center can be designed to be 35. The result of the mesh division of the near-wall model is shown in Fig. 5. Compared with laminar flow model, the calculation of turbulence model requires higher quality mesh, and the rationality of mesh division directly determines the accuracy of turbulence solution. As a typical near-wall mesh, boundary layer mesh has different requirements for different near-wall treatments. In order to ensure the quality of the boundary layer mesh, it is necessary to introduce the distance from the dimensionless sublayer to the wall, which is defined as:
where is wall shear stress, is the normal distance along the wall, is aerodynamic viscosity, is the air density.
Fig. 5Mesh partitioning and optimization results

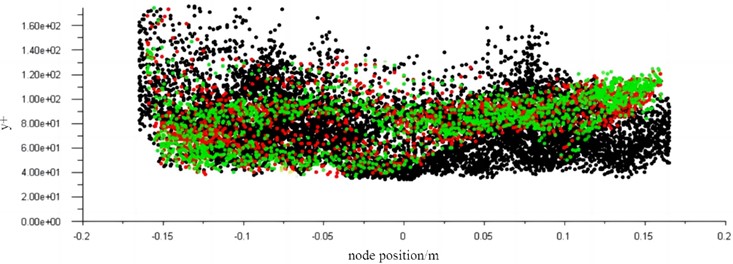
The height of the finite element mesh of the normal first layer of the object surface is determined by . In order to verify the quality of mesh division, the value of the derived surface mesh in the radial direction is shown in Fig. 6. It can be seen that the value of the mesh node in the first layer is 32.5, and the height and density of the mesh meet the requirements of calculation accuracy.
Fig. 6The y+ value at different radial positions
The pressure inlet is used as the entrance boundary condition for the left boundary of the computing domain, where the velocity components along the and directions are and 0, respectively. No slip wall boundary condition is adopted on the surface of the tower model, that is, 0. Symmetric boundary conditions are used for upper and lower boundary of the computational domain, and pressure-outlet boundary conditions are used for right boundary. Using UDF dynamic mesh method, the vibration of two-dimensional tower model under different vibration conditions is realized. The blade-to-tower load can be calculated as follows:
where, the angle of inclination of blade is β, the chord length is , the lift coefficient is , the velocity of the air flowing through the blade is , the axial inducement factor is , the air density is , the axial dimension of the blade is .
According to the effect of fluid load, it can be known that two vortices turning opposite will appear at the tail of the tower equipment, and these falling vortices form two rows of staggered vortices. The flow distance between vortices and vortices is still gradually decreasing, and two rows of vortices are formed in the downstream of the tail vortices. At this time, the vortex shedding is mainly affected by the vibration of tower equipment. Under the action of turbulent wind with a rated wind speed of 16 m/s, the time-history changes of the load and bending moment at the cross-section position of the middle tower are shown in Fig. 7. The calculation results of load response can be used as an important basis for fault identification.
Fig. 7Calculation results of dynamic load
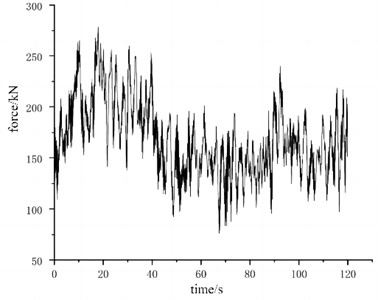
a) The law of change of force
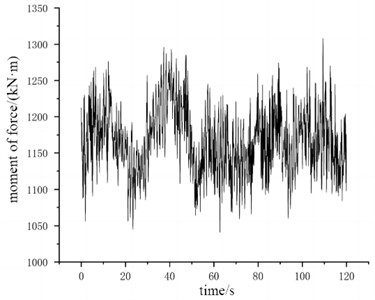
b) The law of change of moment
2.4. Modal calculation under different damage conditions
There is a close relationship between the structural strain mode and the displacement mode. Therefore, Workbench is used to analyze the tower to obtain the displacement mode shape including the natural frequency, and then the strain mode shape is obtained by solving the second derivative of the displacement mode shape. The first three modes of tower displacement are: swing, bending and torsion. Because the energy caused by vibration is mainly concentrated in the low-frequency and low-order modes, and the torsion mode parameters are difficult to measure. Therefore, the first two modes are used in damage identification to consider the effect of complex wind load, that is, the wind load is introduced into the calculation of prestress mode. The fastening connection of high-strength bolts is the key for the tower to withstand various severe loads. Once a single bolt fractures and continues to increase, the tower will collapse and cause huge economic damage. Therefore, by timely diagnosing the health condition of the bolts at the flange of the tower, the maintenance personnel can take measures before the number of bolt fractures further increases and avoid major accidents. This damage is caused by the failure of a bolt under assembly conditions, which is simulated by removing the corresponding bolt. This is also a validation of the applicability of the strain mode damage theory to assembly models [12].
The tower model is set as entity element and divided by unstructured mesh [13]. The mesh size is 0.25 m, and 206481 nodes and 109913 elements are obtained after division, as shown in Fig. 8. The following contact surfaces are set as binding in Contact, including bolt and nut, nut and gasket, bolt and nut and flange end face, top mass block and upper flange end face of upper tower. In addition, friction contact with friction coefficient of 0.2 is formed between flange end faces of tower segment, which completely constrains the bottom surface of flange segment. The first six natural frequencies of tower are obtained by using BlockLancaos method to extract modal parameters, as shown in Table 3. It can be seen that the first and second order natural frequencies are basically the same as the third and fourth order natural frequencies respectively due to the basic symmetry of the model. In order to meet the actual requirements of high-strength bolted connections, a pre-tightening force of 480 kN and 320 kN is applied on each bolt column in the second and third flange sections. Engineering practice has shown that there is a risk of fracture near the connection between the lower and middle tower segments under wind load, indicating that bolt fracture damage is more likely to occur in this area under similar conditions. Therefore, a bolt fracture damage is set at the second flange section of the connection between the lower and middle tower segments, simulating the fracture situation by continuously removing different numbers of bolts from the model.
Fig. 8The partition results of the finite element mesh
a) Finite element mesh for external structure
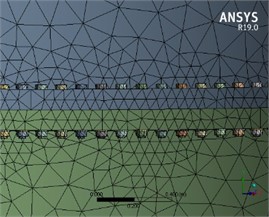
b) Finite element mesh for external structure
Table 3The analysis process of prestressed mode
Modal order | 1 | 2 | 3 | 4 | 5 | 6 |
Natural frequency / Hz | 0.36 | 0.37 | 0.95 | 1.21 | 2.53 | 3.55 |
The tower surface bus was taken at the bolt fracture of the second flange segment of the tower to observe the displacement and fluctuation of strain modal mode after the bolts of the corresponding height of the tower on the bus were fractured. Assuming the strain mode shape and strain energy after damage is and , the strain mode shape and strain energy before damage is and , then the change rate of strain mode shape and the change rate of strain energy can be calculated as:
In order to study the impact of bolt damage on modal mode, the first-order strain modal mode and the change rate of strain energy were obtained under the condition of 3 bolts, 5 bolts and 7 bolts fractured in the bottom flange (spacing removed bolt model), as shown in Fig. 9. It can be seen that the first-order strain modal mode has a significant peak change at the damage of the tower at 20 m, which can be used as an important basis for bolt fracture damage. It is noted that there is no bolt fracture damage at 50 m, that is, the third flange segment, but there is still a small fluctuation. After analysis, it was found that the three-dimensional model of the tower was established by fitting numerous tangents. Due to the limitation of the resolution range, after the model was loaded into Workbench, there was a small rough edge at the flange contact. Therefore, in the simulation process, when the data on the bus were obtained, they would be connected into a straight line, and there would be a small bulge at this point, so there would be a small mutation in the strain modal mode. When there were 3 bolts, 5 bolts and 7 bolts fractured in both the bottom and upper flanges, the corresponding first-order strain modal mode and the change rate of strain energy were obtained, as shown in Fig. 10. It can be seen that the strain mode also changes abruptly at the position of 50 m of the upper flange, indicating that the impact of bolt damage on the overall strain mode is very significant, which can be used as an important basis for damage identification.
Fig. 9Strain modal response of lower flange bolt under damage condition
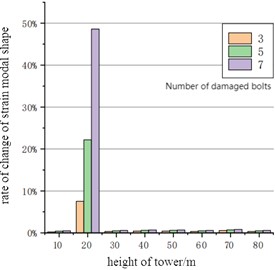
a) Change rate of strain mode shape
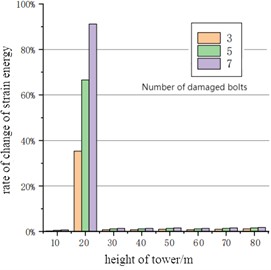
b) Change rate of strain energy
Fig. 10Strain modal response of upper and lower flange bolts under damage condition
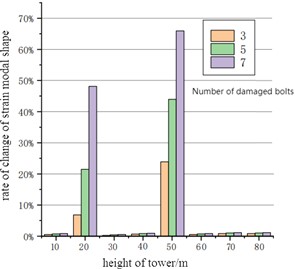
a) Change rate of strain mode shape
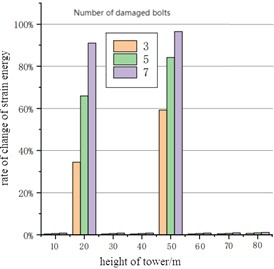
b) Change rate of strain energy
The sensitivity of displacement mode to local damage is greater than other parameters, and the strain mode is more sensitive than the displacement mode. The sensitivity of strain mode to structural damage is greater than that of structural displacement mode and structural natural frequency, and can clearly reflect the existence, size and location of damage. For most modes, the strain mode has an obvious peak at the local damage location, and the size of the peak increases with the increase of the damage degree. The advantage of using strain mode is that the strain of some key points can be directly studied, such as stress concentration problems and the influence of local structural changes on the nearby area. Although the sensitivity of high-order modes to damage is greater than that of low-order modes, in the actual detection of long-size columnar structures, low-order modes are more easily obtained, so it is recommended to focus on the detection of low-order strain modes.
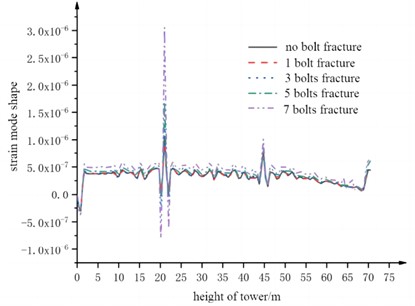
Set different bolts to the damaged position at the bottom of the flange. Under the fracture damage conditions with different bolt numbers, the strain modal modes of the model were calculated respectively, as shown in Fig. 11. It can be seen that except for the condition without bolt fracture, the strain modal modes of other conditions all produced a sudden peak at the second flange segment, namely 21 m, and the height of the peak increased with the increase of the number of bolt fractures. Therefore, it can be proved that the test technique based on strain mode can effectively determine the location and type of damage. Previously, the analysis of various conditions showed a small fluctuation at the third flange segment, but all the fluctuations almost overlapped and had nothing to do with the number of bolt fractures, so it would not interfere with the identification of the damage location. In addition, it was found that compared with the condition without damage, the strain modal modes of other damage conditions had a small deviation in the vertical direction. If the degree of bolt fracture damage is related to the difference of the strain modal mode value before and after damage, this small deviation will affect the judgment of the damage degree, so it is necessary to make corrections.
Fig. 11Strain mode shapes under different damage conditions
2.5. Verification of strain mode
To obtain the strain modal shape, strain gauges must be attached to all measuring points and excited at fixed positions to obtain one or more columns of the strain frequency response function matrix. However, the residual also contains the displacement modal value of the excitation position, so the displacement modal value of the excitation position must be known to solve the strain modal shape [14]. In the actual maintenance and equipment maintenance work, the flange structure needs to be tested. Since the position of the bolt is only in the flange section, the search range of bolt fracture damage can be narrowed down and the focus can be put on the damage of the flange section.
Fig. 12Selection of nodes
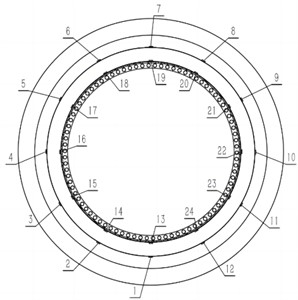
Fig. 13Relative values of strain at different nodes
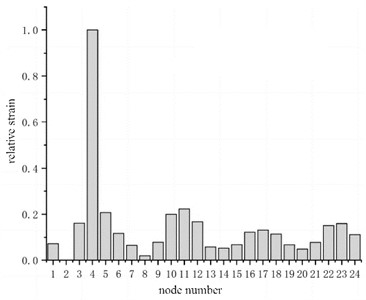
Therefore, this paper proposes to set up detection points along the circumference near the bottom of each flange section. The number of detection points can be set along the circumference according to the need. For example, 12 detection points are evenly set at 30 degrees in the circumference, and 24 detection points are set at the second and third flange sections, as shown in Fig. 12. Six bolts are removed at the No. 4 position, and the simulation and test are carried out respectively. The first-order vibration modes calculated by the finite element method were normalized, and the maximum corresponding strain modes under different damage conditions were finally obtained, as shown in Fig. 13. It can be seen that in the radial direction, the influence of bolt failure on strain mode is also very significant, which proves that strain mode is quite a reliable basis for measuring tower damage.
3. Vibration reduction design and test
3.1. Vibration reduction scheme design
According to the bearing characteristics of the tower, the vibration reduction scheme adopts the structure interaction as shown in Fig. 14(a), that is, the connecting damper between adjacent structures is controlled, which is widely used in large structures. In the wind turbine structure, the wind turbine tower is used as the main structure, and the substructure is constructed for vibration control. The damping shock absorber arranged in the wind turbine tower has the following advantages, including small footprint, no interference collision with the blade, and protective effect on the structural damper. Viscous liquid damper is a kind of damper that uses viscous liquid to frictionally flow and dissipate energy in a sealed cylinder. The piston head has a certain number of small holes to adjust the flow velocity of viscous liquid, which can give different damping forces to the piston rod connected to the controlled structure to change the vibration energy consumption demand. The structure of the viscous liquid damper is shown in Fig. 14(b). In the case of a certain damping coefficient, the tower vibration displacement is related to the height and diameter of column, and the number of circumferential damper on the top. Therefore, it is necessary to explore the optimization of the variable selection, and the optimization index is the maximum displacement reduction rate of the tower top.
Fig. 14Vibration reduction design scheme
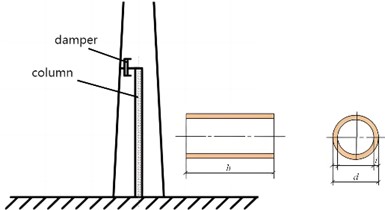
a) Installation schematic diagram of damper
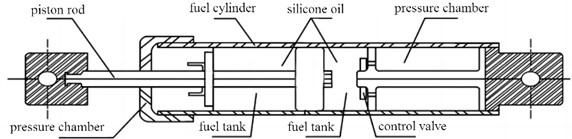
b) Structure composition of damper
In order to study the influence of the column structure parameters on the vibration of the tower cylinder, the control variable method is used to study the total deformation. For the application of load, considering the small wall thickness and stiffness of the cylinder, 10 % of the wind load under the 16 m/s wind speed required by GH Bladed was applied, and the remote point at the top of the cylinder was still applied, as shown in Fig. 15. The effective mass, stiffness and damping of a single damper are 12550 kg, 42335 N/m and 2603 N·s·m-1 respectively. The analytical results for which the maximum deformation can be obtained under different structural parameters are shown in Fig. 16. According to this simulation scheme, the range of values for design variables is shown in Table 4, including the column height , diameter and wall thickness . The optimization objective is set to the minimum value of the maximum deformation and mass .
Fig. 15Application of load
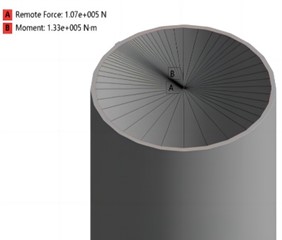
Fig. 16Cloud image of total deformation
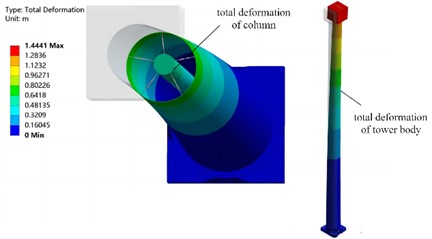
Table 4Structural parameters of shock absorber
Height of column / m | Diameter of column / m | Wall thickness / mm | |
Initial design value | 5 | 0.2 | 6 |
Upper limit value | 4 | 0.15 | 4 |
Lower limit value | 6 | 0.25 | 8 |
The objective function and the constraint function of the vibration optimization problem can be expressed as Eq. (5) and Eq. (6). Based on the multi-objective optimization module in ANSYS workbench, the best structural parameters of shock absorber can be obtained, as shown in Table 5. It can be seen that the maximum deformation can be reduced by 16 % without increasing the mass of column:
where is deformation function, is mass function, is initial mass, is the design variable matrix, and are the minimum and maximum values of the design variable.
Table 5The optimal structural parameters of shock absorber
Height of column / m | Diameter of column / m | Wall thickness / mm | Maximum deformation / m | Reduction rate of maximum deformation | Mass / kg | Reduction rate of mass |
5.6 | 0.22 | 4.7 | 1.21 | 16.0% | 621.5 | 1.6% |
3.2. Testing and analysis of vibration damping effect
In order to verify the effect of the shock absorber, acceleration sensors were installed at the bottom flange and the upper flange respectively. Through spectrum processing, the displacement response under conventional wind load was obtained, as shown in Fig. 17. It can be seen that the natural frequency obtained from the spectrum analysis is consistent with the modal simulation. The shock absorber has a good limiting effect on the displacement at the flange. At the upper flange position, the amplitude under the first-order resonance frequency can be significantly reduced, and the maximum displacement is reduced to 0.572 m, which is only 16.2 % of the case without applying the shock absorber. The displacement response of the lower flange is similar to that of the upper flange, and the vibration reduction effect is very good.
In order to visually view the impact of the damping structure on the overall load response, the flange and bolt structure in the original model was removed when the tower model was established, and a circular platform 30 mm thick was constructed 1m away from the tower top to support the mass block. By setting the density, the mass block was determined to be a cube 840 mm long, wide and high. The model was imported into Workbench to set various parameters, where the friction coefficient between the mass block and the tower top support plate was 0.2. The vertical displacement of the bottom mass was fixed to 0, so that it could only move horizontally on the supporting platform, and could not jump vertically. The wind load actually applied to the tower surface was continuous from bottom to top. However, considering the relatively complex model and the long analysis time, the wind load data of 16 m/s was loaded on the tower top, and the focus point of the wind load was the far point. The remote sensing point was established by selecting the tower top plane, and then the wind load was input into the remote sensing point in the form of three-dimensional component force and bending moment to complete the coupling application of wind load. Response of top acceleration and stress response of bottom flange are shown in Fig. 18. It can be seen that the vibration damper can effectively inhibit the tower top amplitude, and the average amplitude can be reduced by 22.5 %. The vibration damper can also achieve ideal results in the control of stress. The peak stress at the bottom flange position can be reduced by about 38 %. The decrease of stress will reduce the fatigue cracks at the root of the tower and the loosening and fracture of the bolts at the tower flange. This vibration control method can reduce the probability of damage to the tower to a certain extent, and prolong the normal service life of the wind turbine.
Fig. 17Displacement response at different frequencies
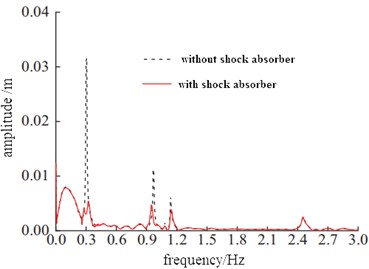
a) Displacement response of upper flange
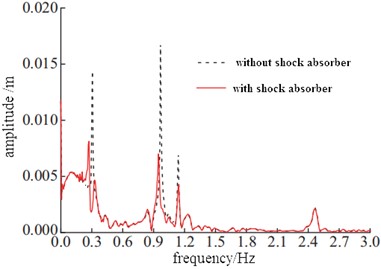
b) Displacement response of lower flange
Fig. 18Simulation results of load response
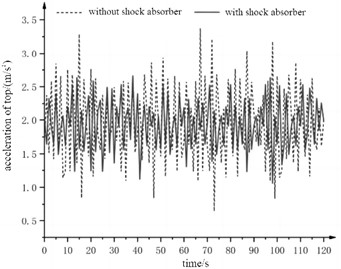
a) Response of top acceleration
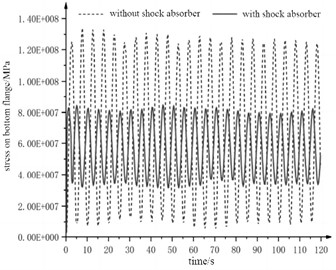
b) Stress response of bottom flange
4. Conclusions
Through the modal analysis of the tower structure, it can be known that the strain mode can be used as an important basis for fault damage or reliability verification, which has great guiding significance for fault prediction and rationality verification of structural design. Combined with the damage response results, a vibration reduction scheme based on the interior of the tower was proposed. Through the dynamic response results of different positions, the vibration reduction effect can be effectively verified. Through the study, the following conclusions can be drawn.
1) Damage to the bolts has a critical impact on the safety of the tower. Except for the condition without bolt fracture, the strain modal modes of other conditions all produced a sudden peak at the second flange segment. In addition, the influence of bolt failure on strain mode is also very significant in the radial direction, which indicates that strain mode is a reliable basis for measuring tower damage.
2) Through the application of shock absorber, the amplitude under the first-order resonance frequency at the upper flange position can be significantly reduced, and the maximum displacement is reduced to 0.572 m, which is only 16.2 % of the case without the application of shock absorber. The deceleration vibration at the top of the tower can be reduced by 22.5 %, and the maximum stress at the bottom flange can be reduced by 38 %. This can prove that the vibration reduction and optimization effect is remarkable and effective.
References
-
M. Bakkari, B. Bossoufi, I. El Kafazi, M. Bouderbala, and M. Karim, “A review of wind energy potential in Morocco: New challenges and perspectives,” Wind Engineering, Vol. 48, No. 1, pp. 101–120, Oct. 2023, https://doi.org/10.1177/0309524x231200582
-
S. Eryilmaz, I. Bulanik, and Y. Devrim, “Computing reliability indices of a wind power system via Markov chain modelling of wind speed,” Proceedings of the Institution of Mechanical Engineers, Part O: Journal of Risk and Reliability, Vol. 238, No. 1, pp. 71–78, Nov. 2022, https://doi.org/10.1177/1748006x221133601
-
M. Liaqat, T. Alsuwian, A. A. Amin, M. Adnan, and A. Zulfiqar, “Transient stability enhancement in renewable energy integrated multi-microgrids: A comprehensive and critical analysis,” Measurement and Control, Vol. 57, No. 2, pp. 187–207, Sep. 2023, https://doi.org/10.1177/00202940231196193
-
R. Manikandan and R. Raja Singh, “Fault diagnosis of wind turbine power converter using intrinsic mode functions with relative energy entropy,” Circuit World, Vol. 50, No. 1, pp. 90–107, Jan. 2024, https://doi.org/10.1108/cw-09-2022-0241
-
Z. Pan et al., “Evaluating effectiveness of multiple tuned mass dampers for vibration control of jacket offshore wind turbines under onshore and seafloor earthquakes,” Earthquake Engineering and Engineering Vibration, Vol. 22, No. 4, pp. 1045–1063, Oct. 2023, https://doi.org/10.1007/s11803-023-2207-7
-
A. H. Rangel-Rodriguez, D. Granados-Lieberman, J. P. Amezquita-Sanchez, M. Bueno-Lopez, and M. Valtierra-Rodriguez, “Analysis of vibration signals based on machine learning for crack detection in a low-power wind turbine,” Entropy, Vol. 25, No. 8, p. 1188, Aug. 2023, https://doi.org/10.3390/e25081188
-
S. Kaloni, P. Tiwari, and G. Singh, “User-defined high impulsive frequency acquisition model for mechanical damage identification,” Proceedings of the Institution of Mechanical Engineers, Part K: Journal of Multi-body Dynamics, Vol. 237, No. 2, pp. 325–340, Feb. 2023, https://doi.org/10.1177/14644193231157176
-
Z. Bai, T. Liu, D. Zou, M. Zhang, A. Zhou, and Y. Li, “Image-based reinforced concrete component mechanical damage recognition and structural safety rapid assessment using deep learning with frequency information,” Automation in Construction, Vol. 150, No. 1, p. 104839, Jun. 2023, https://doi.org/10.1016/j.autcon.2023.104839
-
S. Schmidt, A. Mauricio, P. S. Heyns, and K. C. Gryllias, “A methodology for identifying information rich frequency bands for diagnostics of mechanical components-of-interest under time-varying operating conditions,” Mechanical Systems and Signal Processing, Vol. 142, No. 1, p. 106739, Aug. 2020, https://doi.org/10.1016/j.ymssp.2020.106739
-
G. F. Gomes, Y. A. D. Mendez, P. Da Silva Lopes Alexandrino, S. S. Da Cunha, and A. C. Ancelotti, “A review of vibration based inverse methods for damage detection and identification in mechanical structures using optimization algorithms and ANN,” Archives of Computational Methods in Engineering, Vol. 26, No. 4, pp. 883–897, May 2018, https://doi.org/10.1007/s11831-018-9273-4
-
S. Vulovic, M. Zivkovic, A. Pavlovic, R. Vujanac, and M. Topalovic, “Strength analysis of eight-wheel bogie of bucket wheel excavator,” Metals, Vol. 13, No. 3, p. 466, Feb. 2023, https://doi.org/10.3390/met13030466
-
K. J. Kim, “Light-weight design and fatigue characteristics of automotive knuckle by using finite element analysis,” Journal of Mechanical Science and Technology, Vol. 35, No. 7, pp. 2989–2995, Jun. 2021, https://doi.org/10.1007/s12206-021-0622-0
-
M. Mobaraki and J. Ratava, “Tuning vibration absorbers to mitigate simultaneous regenerative and mode-coupling chatter,” Noise and Vibration Worldwide, Vol. 54, No. 6, pp. 237–247, May 2023, https://doi.org/10.1177/09574565231179731
-
J. Wang, C. Wang, T. Zhang, and B. Zhong, “Comparison of different independent component analysis algorithms for output-only modal analysis,” Shock and Vibration, Vol. 2016, No. 6, pp. 1–25, Jan. 2016, https://doi.org/10.1155/2016/6309084
About this article

The paper is supported by University Science and Technology Plan Project (Project No. 2022KJ12).
The datasets generated during and/or analyzed during the current study are available from the corresponding author on reasonable request.
The authors declare that they have no conflict of interest.
