Abstract
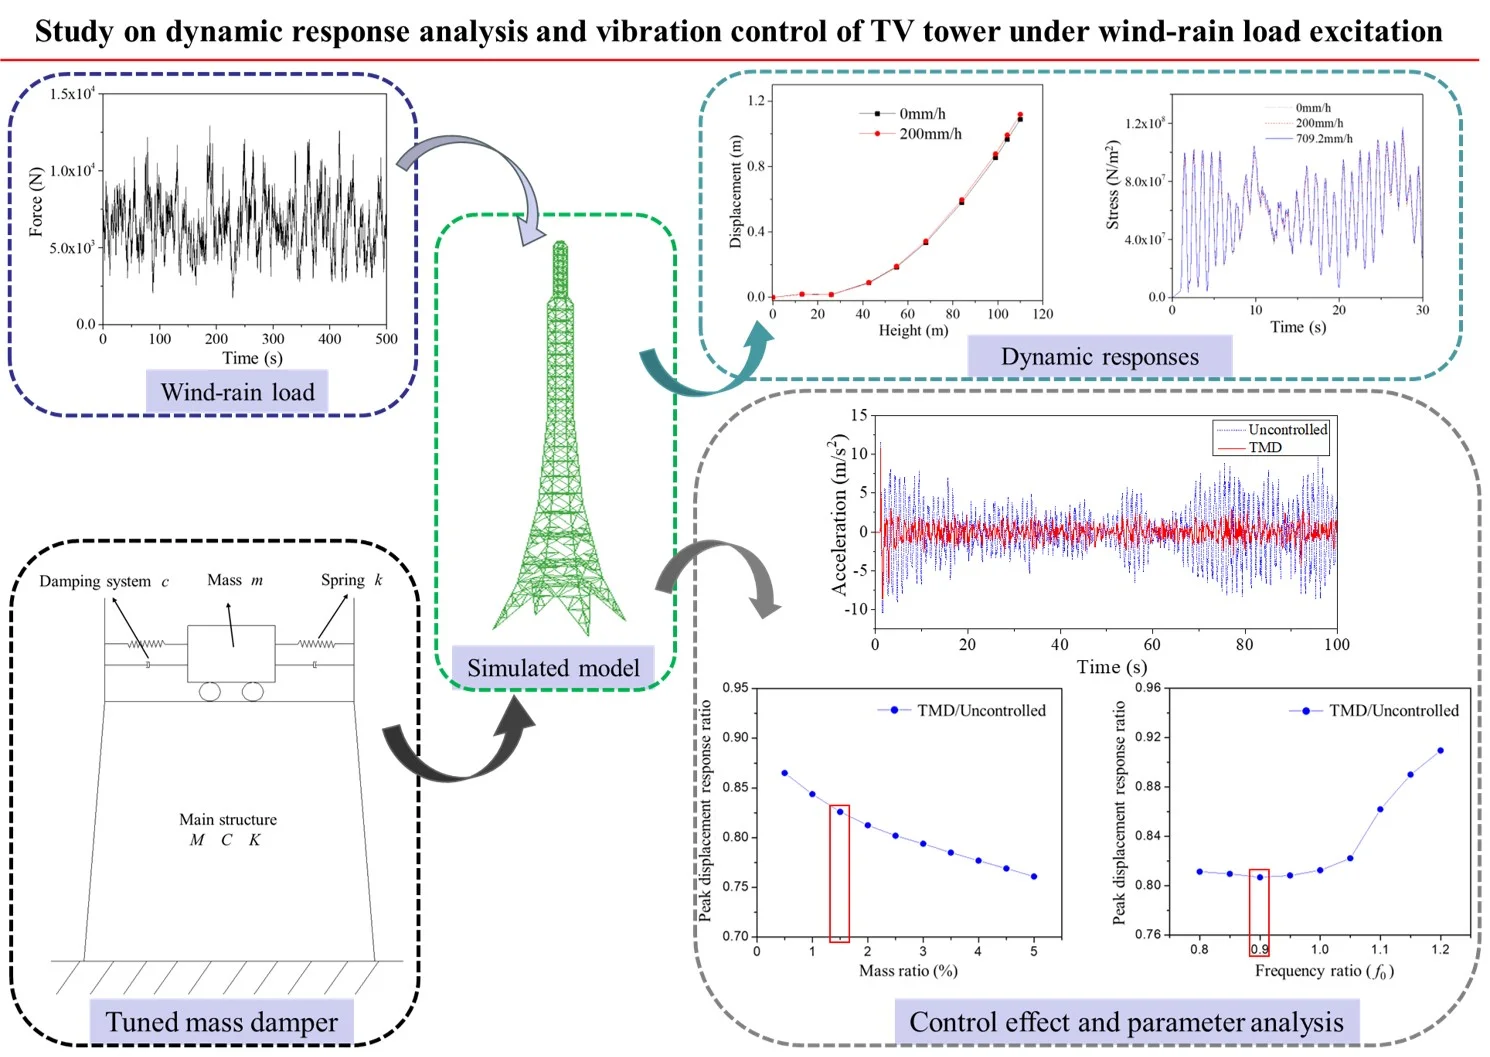
This study thoroughly examines the impact of the coupling effects of wind-rain load on the structural behavior of the television tower, and the effective vibration control method is employed to mitigate the dynamic response of the structure. A refined finite element model of the tower was developed, and the dynamic response characteristics of the structure under varying wind speeds and rain intensities are further investigated. Based on parameter analysis, the influence of mass ratio and frequency ratio on the damping efficiency of tuned mass damper (TMD) was revealed. The results demonstrate that compared to wind load alone, the node displacement increases more significantly near the top of the tower under wind-rain load. When the basic wind speed reaches 40 m/s, the TV tower will be damaged due to the extreme compressive stress of the 45 units on the compression side exceeding the yield strength of the members. Under extreme weather loads, the members on the compressive side at a height of 60 meters are most susceptible to yielding and entering the plastic deformation stage. The overall vibration reduction effectiveness of TMD increases with higher mass ratios, with a mass ratio of 1.5 % identified as optimal. Regarding the reduction of top displacement of the tower, the effectiveness of TMD varies with frequency ratio, showing an initial increase followed by a decrease; optimal vibration control is observed at a frequency ratio of 0.9.
Highlights
- The wind-rain load excitation under varying wind speeds and rainfall intensities is calculated and generated.
- A refined finite element model of the tower is employed to simulate the structural response under varying wind speeds and rain intensities.
- The impact of the coupling effects of wind-rain load on the structural behavior of the television tower is examined.
- The influence of mass ratio and frequency ratio on TMD damping efficiency is revealed, taking 1.5% mass ratio and 0.9 frequency ratio as optimal for effective vibration reduction and displacement control.
1. Introduction
Steel television towers, as typical tall structures, are highly susceptible to severe vibrations under environmental loads, which can impact their overall stability [1]. In extreme cases, this may even lead to structural collapse, causing significant inconvenience to people's daily lives. Television towers, both in appearance and characteristics, are similar to tall buildings; they are slender, flexible, and sensitive structures, highly influenced by strong wind loads. However, strong winds are often accompanied by heavy rain, and in recent years, the collapse of these flexible, sensitive structures under severe storm conditions has become increasingly common. Although research has focused more on wind loads, the impact of rain loads has been overlooked. Therefore, it is imperative to conduct in-depth studies on the dynamic response of structures under the combined effects of wind and rain loads.
Scholars have conducted a series of studies on the dynamic response patterns of tall structures under wind and rain loads. Li et al. [2-3] investigated the structural response of transmission tower-line systems and cable-truss point-supported glass curtain wall systems under wind and rain loads in early research. Their results indicated that the impact of rain loads on tall and large-span structures is significant, with structural responses under extreme rain loads being over 10 % greater than those under wind loads alone. In the study of wind and rain loads, the coupled effects of wind speed and raindrop velocity have often been neglected. To address this, Fu et al. [4] reviewed domestic scholars’ rain load calculation models by comparing different raindrop spectra. They also introduced numerical simulations for wind and rain loads and conducted subsequent research on the structural response of transmission tower-line systems under coupled wind and rain loads. From another perspective, Ke et al. [5] considered the impact of rain loads by proposing that the uniform distribution of raindrops in the air during rainfall effectively increases air density, thus affecting the aerodynamic forces and wind effects on structures. Using a 220-meter tall hyperbolic indirect air-cooled tower as an example, Ke calculated the fluid flow characteristics around the cooling tower's surface, wind and rain load characteristic values, and average pressure coefficient changes under wind and rain loads. The study found that the total rain load on the cooling tower's surface accounted for 6.71 % of the total wind load, and the combined action of wind and rain loads reduced both the overall buckling stability and local stability of the cooling tower.
Structural vibration control technology is an effective method for reducing excessive vibrations in tall structures. Researchers worldwide have explored vibration control in tall structures through theoretical analysis, experimental research, and finite element simulations, achieving significant results. Zhang et al. [6], for example, studied the vibration reduction effects of fluid viscous dampers and tuned mass dampers under fluctuating wind loads using the Hefei TV Tower as a case study. Their analysis showed that the dampers significantly reduced the wind-induced responses and wind vibration input energy of the tower, with peak acceleration responses decreasing by up to 50.7 %. Dai et al. [7] derived the equations of motion for tuned mass dampers and investigated a TMD suitable for controlling tower structure vibrations under multi-dimensional seismic excitations. They analyzed the calculation parameters for the TMD based on the control structure. Xie et al. [8] examined the wind-induced vibration control effects of transmission towers under seven different MR damper distribution conditions. Their results indicated that using different damper configurations can reduce tower vibrations, with the most significant vibration reduction observed when dampers are placed at the edge rods in the lower half of the transmission tower. Tong et al. [9] conducted a simulation study on the vibration reduction effects of tuned mass dampers (TMD) for offshore wind turbines, utilizing TMD as a passive vibration control method. Sun et al. [10] proposed a three-dimensional pendulum tuned mass damper (3D-PTMD) to mitigate the dynamic responses of offshore wind turbines in both the longitudinal and transverse directions, comparing its effectiveness with that of bilinear tuned mass damper (TMD).
Despite significant research by many scholars on the dynamic response and vibration control of tall structures under wind and rain loads, studies specifically focusing on the dynamic response of TV towers are quite limited. This is particularly true for vibration control under the combined effects of extreme weather, such as strong winds and heavy rainfall.
The remainder of this study is organized as follows: Section 2 introduces the finite element model of the television tower and the simulation methods for wind-rain load. Section 3 investigates the dynamic response patterns of the television tower under wind-rain load. Section 4 evaluates the efficiency of using TMD to reduce the dynamic response of the television tower under wind-rain load and reveals the vibration reduction patterns of TMD through parameter analysis.
2. Finite element model and wind-rain load
2.1. Finite element model of the television tower
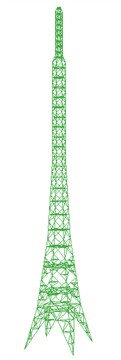
The television tower has a total height of 110 meters, with the primary structural members primarily made of Q420 steel. The diagonal and auxiliary members are mainly composed of Q345 and Q235 steel. The main components are steel pipes, with some auxiliary members made of angle steel. Based on actual engineering data, the structure was modeled using the finite element software ABAQUS. BEAM elements (B31) were selected to simulate the television tower, fully considering the bending moments of the structural components. The tower base is connected in a fixed manner. The dimensions of the structure and the model are shown in Fig. 1.
Fig. 1Dimensional drawing and model diagram of the television tower

2.2. Analysis of dynamic characteristics
To validate the finite element model developed, modal analysis was performed using ABAQUS to determine the model’s modal characteristics. The first ten natural frequencies of the television tower structure are presented in Table 1. The first and second mode shapes of the television tower are illustrated in Fig. 2. These modal analysis results will be utilized in the analysis of structural dynamic response under wind and rain loads, as well as in the study of vibration control.
Fig. 2The first two mode shapes of the television tower

a) First mode shape

b) Second mode shape
2.3. Generation of wind-rain load
In this study, the dynamic time history of wind loads acting on the television tower was simulated using the linear filtering method. The actual wind speed was modeled by superimposing fluctuating wind speed onto the mean wind speed. The Davenport spectrum was selected to represent the fluctuating wind speed spectrum [11], with its expression as follows:
where, ; is the frequency (Hz); is the mean wind speed at a standard height of 10 meters (m/s); and is the ground roughness coefficient.
Based on the conversion relationship between wind speed and wind pressure, the wind load time history can be obtained from the wind speed time history [12]:
where is the shape coefficient of the structure; is the wind speed value; and is the windward area.
Table 1Natural vibration frequencies of television tower structures
Mode shape | Frequency (Hz) | Period (s) |
1 | 0.95586 | 1.046178 |
2 | 0.95587 | 1.046167 |
3 | 2.8726 | 0.348117 |
4 | 3.1539 | 0.317068 |
5 | 3.1541 | 0.317048 |
6 | 4.0651 | 0.245996 |
7 | 4.6175 | 0.216567 |
8 | 5.8011 | 0.172381 |
9 | 5.8019 | 0.172357 |
10 | 6.3349 | 0.157856 |
Table 2Parameters of the simulation points on the TV tower
 | Simulation point | Simulation interval (m) | Height of simulation point (m) | Bearing area (m2) |
7 | 92-110 | 101 | 20.044 | |
6 | 76-92 | 84 | 30.476 | |
5 | 60-76 | 68 | 15.424 | |
4 | 49.17-60 | 55 | 11.011 | |
3 | 35-49.17 | 42 | 13.823 | |
2 | 13-35 | 24 | 12.146 | |
1 | 0-13 | 7 | 10.696 | |
Note: Bearing area refers to the projected area of the windward surface components | ||||
Following the equivalent simplified method with multiple regions and nodes used by relevant scholars [13-16] for analyzing wind-induced responses in tall steel structures, the television tower was divided into reasonable and effective sections. Each region selected an appropriate height for simulation points. The positions of the intervals, the heights of the simulation points, and the areas subjected to wind pressure are shown in Table 2. The television tower, with a total height of 110 meters, was divided into seven sections from top to bottom, each with a simulated length of approximately 15 meters. The tower's lateral width decreases from bottom to top: from the base of the first section to the top of the fourth section, the lateral width gradually reduces from 9 meters to 1.75 meters. From the fifth section to the sixth section, the width remains constant at 1.75 meters. At the 94.6-meter mark of the seventh section, the width abruptly changes to 0.9 meters and remains unchanged to the top of the tower.
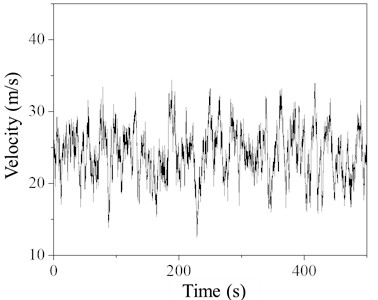
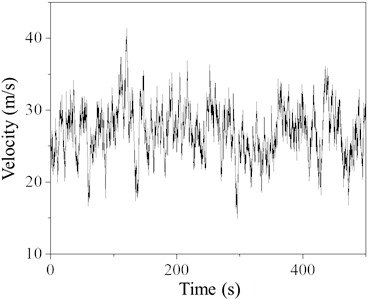
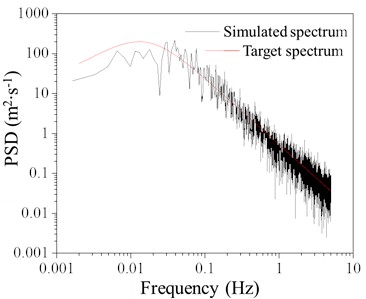
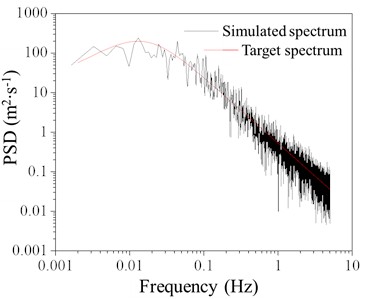
When the basic wind speed is 20 m/s, the wind speed time histories for simulation points 3 and 7 are shown in Fig. 3. Fig. 4 compares the target power spectrum with the simulated power spectrum and includes the autocorrelation curve. As seen in the figure, the simulated spectrum closely matches the target spectrum, indicating a consistent trend. The autocorrelation of the simulated points at different times is weak, demonstrating that the order and parameters selected for the linear filtering method are reliable and effective for simulating wind loads.
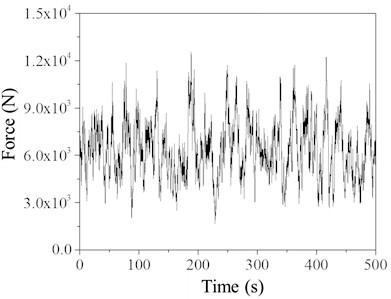
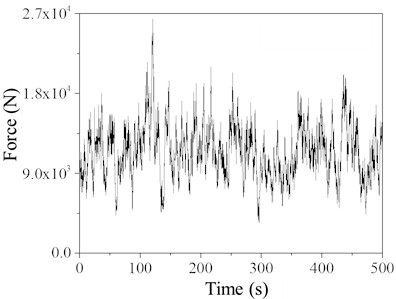
The wind load time history curves for different simulation points were calculated using the wind load formula. The wind load time history curves for simulation points 3 and 7 are shown in Fig. 5. These wind load time histories will be applied to the television tower for subsequent structural response analysis.
Fig. 3Time history of simulated point wind speed
a) Simulation point 3
b) Simulation point 7
Fig. 4Comparison between simulated spectrum and target spectrum
a) Simulation point 3
b) Simulation point 7
The forces exerted by raindrops on structures under horizontal wind and gravity are complex. Currently, there is no consensus on a unified rain load calculation model. This paper synthesizes existing research on rain load calculation models and adopts the model derived by Li et al. [3]. Based on the momentum theorem, assuming a raindrop falls as a sphere with an impact duration of , the impact force of a single raindrop can be simplified as:
Fig. 5Time history of simulated point wind load
a) Simulation point 3
b) Simulation point 7
When applied to a finite element structure, this can be converted into a uniformly distributed load as follows:
where is the area of impact, given by ; is the width of the structural or component cross-section; and represents the raindrop occupancy rate in the air, defined as , where is the number density of raindrops with diameter per unit volume of air, as listed in Table 3. For lattice structures like TV towers, the rain-affected area is doubled, meaning the component cross-section width is also doubled. Substituting and rearranging yields:
Table 3Raindrop total density
Precipitation (mm/h) | 0-1 | 1-2 | 2-3 | 3-4 | 4-5 | 5-6 | 6 |
200 | 4406 | 1153 | 302 | 79 | 20 | 5 | 2 |
709.2 | 4987 | 1775 | 631 | 224 | 80 | 28 | 15 |
Table 4Classification of rainfall levels
Level | Light rain | Moderate rain | Heavy rain | Storm | Heavy storm | Extreme value (Domestic Record) | ||
1 | 2 | 3 | ||||||
Precipitation (mm/h) | 2.5 | 8 | 16 | 32 | 64 | 100 | 200 | 709.2 |
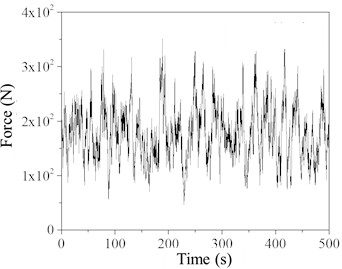
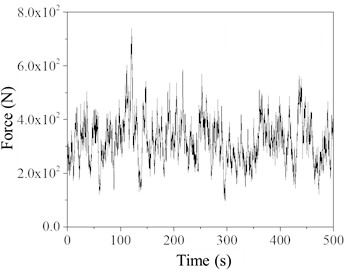
Rainfall intensity is described by the amount of precipitation per unit time. Table 4 presents seven rainfall categories based on the depth of water accumulated on the ground over 24 hours, along with recorded extreme precipitation values in the region. For simplicity in subsequent calculations and considering the research objectives and operational requirements, this study selects two representative rainfall intensities for each scenario: 200 mm/h for heavy rain and 709.2 mm/h for extreme rain. Rain load time history curves for each simulation point are determined based on these rainfall intensities. When the rainfall intensity is 200 mm/h, the rain load time history curves for simulation points 3 and 7 are shown in Fig. 6.
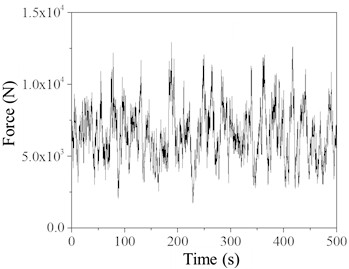
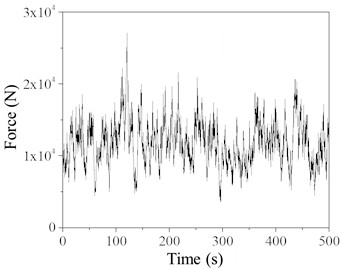
Fig. 7 shows the wind and rain load time history curves for simulation points 3 and 7 on the TV tower. These curves are obtained by summing the wind loads and rain loads calculated from Eq. (2) and Eq. (5). Using the established finite element model of the TV tower and the explicit analysis method in ABAQUS finite element software, the wind and rain load time histories are applied to the nodes of seven segments of the TV tower. Nonlinear time history analysis is then performed to study the dynamic response of the TV tower under various wind speeds and rainfall intensities. Each scenario involves two load steps: one for self-weight and one for combined wind and rain loads, with duration of 1 second and 300 seconds, respectively.
Fig. 6Time history of simulated point rain load (Rain intensity 200 mm/h)
a) Simulation point 3
b) Simulation point 7
Fig. 7Time history of simulated point wind-rain load (Rain intensity 200 mm/h)
a) Simulation point 3
b) Simulation point 7
3. Wind-rain induced dynamic response analysis
3.1. Effect of different rain intensities
When the basic wind speed is 30 m/s and the rainfall intensities are 0 and 200 mm/h, the variation curves of node displacement and main member axial force along the height of the TV tower under the separate and combined actions of wind and rain loads are shown in Fig. 8-9. As observed from the figures, the node displacement increases with height, and the rate of increase accelerates. The wind-rain load results in greater node displacements, especially near the top of the tower, compared to the wind load alone. For the main member axial force, it changes slowly with height below 60 meters. However, above 60 meters, the axial force decreases rapidly with height, with a sudden change occurring at 94.6 meters. This abrupt change is attributed to the geometric characteristics of the TV tower, where there is a sudden change in the lateral dimension at this height.
The dynamic response of the TV tower was calculated for a basic wind speed of 30 m/s under rainfall intensities of 0 mm/h, 200 mm/h, and 709.2 mm/h. The node displacement and acceleration time history curves at the top of the TV tower were extracted, as well as the stress time history curves for element 1572 at the top of the tower and element 45 at the minimum cross-section height of 60 meters. The specific calculation results are as follows.
Fig. 8Variation of node displacement along height
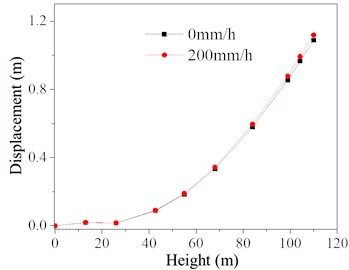
Fig. 9Variation of main material axial force along height
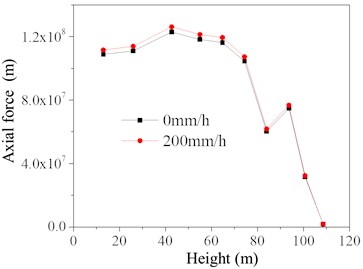
Fig. 10Top dynamic response of TV tower
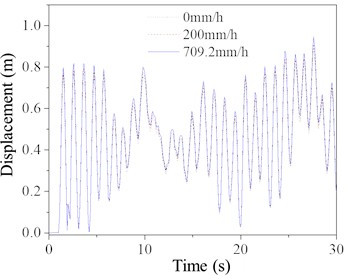
a) Time history of displacement
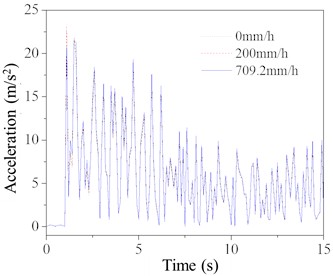
b) Time history of acceleration
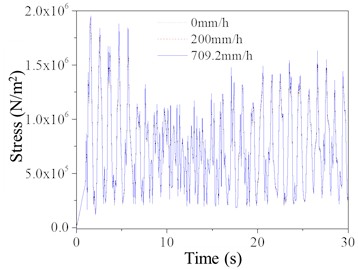
Fig. 10 presents the time history curves of node displacement and acceleration at the top of the TV tower. Although the load duration is 300 seconds, only a portion of the time is displayed for clarity. As seen in the figure, the dynamic response of the TV tower is greater under a rainfall intensity of 709.2 mm/h compared to 0 mm/h and 200 mm/h, but the overall increase is not particularly significant. The dynamic responses under 0 mm/h and 200 mm/h rainfall intensities show minimal differences.
Fig. 11Compressive stress of the elements on the compression side of TV tower
a) Element 1572
b) Element 45
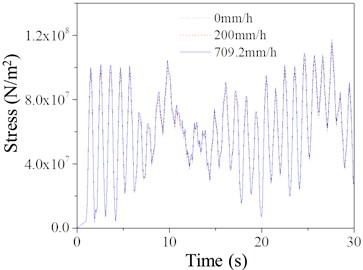
The time history curves of compressive stress for elements on the compressed side of the TV tower is shown in Fig. 11. Element 1572 represents a main structural member at the top of the tower, and its stress level is not comparable to the stress level of element 45, which is a main structural member at a height of 60 meters. This indicates that structural failure is more likely to occur at the 60-meter height than at the top of the tower. For the compressive stress of element 45, the stress is higher under a rainfall intensity of 709.2 mm/h compared to 0 mm/h and 200 mm/h, and the increase is more significant than for element 1572. Therefore, in subsequent analyses, to simplify the results, only the stress response of element 1572 will be extracted and analyzed for the TV tower.
3.2. Effect of different wind speeds and rain intensities
The wind-rain load time histories simulated in the previous section were applied to the TV tower under basic wind speeds of 20, 30, and 40 m/s, and rainfall intensities of 0 mm/h, 200 mm/h, and 709.2 mm/h. The dynamic response characteristics of the TV tower were analyzed for each combination of wind speed and rainfall intensity. The maximum values of displacement response at the top node, acceleration response at the top node, and compressive stress in element 45 were extracted. The specific results are as follows.
Table 5Maximum displacement of top nodes of TV tower (m)
Wind speeds | Rain intensities | ||||
0 mm/h | 200 mm/h | Increase in displacement | 709.2 mm/h | Increase in displacement | |
20 m/s | 0.492 | 0.506 | 2.804 % | 0.522 | 6.047 % |
30 m/s | 1.088 | 1.119 | 2.795 % | 1.154 | 6.033 % |
40 m/s | 1.990 | 2.045 | 2.803 % | 2.110 | 6.032 % |
Table 6Maximum acceleration of top nodes of TV tower (m)
Wind speeds | Rain intensities | ||||
0 mm/h | 200 mm/h | Increase in displacement | 709.2 mm/h | Increase in displacement | |
20 m/s | 12.446 | 12.796 | 2.805 % | 13.200 | 6.048 % |
30 m/s | 25.617 | 26.337 | 2.808 % | 27.167 | 6.047 % |
40 m/s | 42.629 | 43.839 | 2.840 % | 45.265 | 6.185 % |
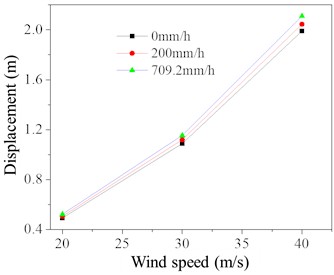
Table 5 shows the maximum displacement values at the top node of the TV tower for various basic wind speeds and rainfall intensities. The data indicates that, for different basic wind speeds, changing the rainfall intensity has a minimal effect on the increase in the maximum displacement of the top node. Specifically, under a rainfall intensity of 200 mm/h, the increase is approximately 2.8 %, and under 709.2 mm/h, it is approximately 6.0 %. This suggests that basic wind speed has little impact on the displacement changes at the top node under different rainfall intensities. According to the “Code for Design of Tall Structures”, the horizontal displacement of the top node of a self-supporting tower should not exceed 1/50 of the tower’s height under wind load-dominant load combinations. Under the condition of a basic wind speed of 40 m/s and a rainfall intensity of 709.2 mm/h, the top node displacement reaches 2.110 meters, which is below the limit of 2.2 meters. This indicates that while the displacement is within the permissible range, it is very close to the limit.
The maximum acceleration values at the top node of the TV tower for various basic wind speeds and rainfall intensities are presented by Table 6. The data reveals that the variation in acceleration at the top node follows a pattern similar to that of displacement. Basic wind speed has little impact on the acceleration changes at the top node under different rainfall intensities. The maximum increase in structural response due to extreme rain load is 6 %, indicating that rain load can be neglected under lighter rainfall conditions. However, in regions with intense precipitation, the impact of rainfall on structural response should be considered.
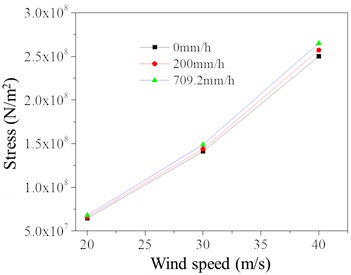
Table 7 presents the maximum compressive stress values for element 45 on the compressed side of the TV tower under different basic wind speeds and rainfall intensities. The data indicates that the increase in maximum compressive stress due to rainfall intensity grows with increasing basic wind speed. For a rainfall intensity of 200 mm/h, the stress increase ranges from 2.59 % to 2.76 % as the basic wind speed increases from 20 m/s to 40 m/s. For a rainfall intensity of 709.2 mm/h, the stress increase ranges from 5.60 % to 5.92 % over the same wind speed range. Under the condition of a 40 m/s basic wind speed and 0 mm/h rainfall intensity, the maximum compressive stress for element 45 reaches 2.50×10⁸ N/mm2, which exceeds the yield strength of the main structural member (2.35×10⁸ N/mm2). This indicates that at a basic wind speed of 40 m/s, the TV tower has already entered a state of plastic buckling and failure.
Table 7Extreme compressive stress of element 45 on the compression side (N/mm2)
Wind speed | Rain intensities | ||||
0 mm/h | 200 mm/h | Increase in stress | 709.2 mm/h | Increase in stress | |
20 m/s | 6.45E7 | 6.62E7 | 2.596 % | 6.81E7 | 5.602 % |
30 m/s | 1.41E8 | 1.44E8 | 2.692 % | 1.49E8 | 5.833 % |
40 m/s | 2.50E8 | 2.57E8 | 2.763 % | 2.65E8 | 5.918 % |
Fig. 12Dynamic response of TV tower under different basic wind speeds and rainfall intensities
a) Maximum displacement of the top node
b) Extreme compressive stress of element 45 on the compression side
The maximum displacement of the top node of the TV tower and the maximum compressive stress of the 45 compression elements under different basic wind speeds and rain intensities are shown in Fig. 12. As illustrated, with increasing basic wind speed and rain intensity, the dynamic response of the TV tower also increases, exhibiting a nonlinear trend. However, from the curves in the figure, it can be inferred that when the basic wind speed is around 38 m/s, the maximum compressive stress in the 45 compression elements of the TV tower reaches the yield strength of 2.35×10⁸ N/mm2, leading to buckling of the main structural members of the tower.
3.3. Analysis of the dynamic response of structures induced by wind and rain
To further elucidate the entire dynamic response process of the TV tower under the combined action of wind and rain loads, a more detailed analysis is conducted. Taking a basic wind speed of 50 m/s and a rain intensity of 200 mm/h, the stress conditions of the tower’s structural members at different time points are examined, as shown in Fig. 13. At 1.5 s, the main structural member on the leeward side at a height of 60 m (the fifth section) of the TV tower first yields. The internal forces within the tower’s main structure are redistributed. As the wind and rain loads continue, at 11.6 s, the main structural member on the leeward side of the fourth section begins to yield. The number of yielding members in the TV tower increases, altering the load transfer paths. The stress on the members surrounding the yielding ones increases, leading to structural failure as the plastic stage is reached. From the above analysis, it is concluded that the compressive members on the leeward side at a height of 60 m (the fifth section) of the TV tower are the most prone to yield and enter the plastic stage.
Fig. 13Stress distribution of TV tower components

a)1.5 s

b)11.6 s

c)23.6 s
4. Wind-rain induced vibration control analysis
4.1. TMD vibration reduction mechanism and parameter design
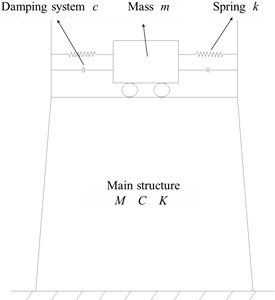
A Tuned Mass Damper (TMD) consists of three main components: a spring, a damper, and a mass block. The principle behind TMD is to tune the frequency of the vibration control system to match the frequency of the main structure. Through the interaction between the TMD and the main structure, energy is transferred, thereby reducing the vibration response of the main structure. The dynamic characteristics of the main structure change when a TMD is installed. When the main structure is subjected to external excitations, the inertia of the TMD’s mass block exerts a counteracting force on the original structure. During this process, the damping system effectively dissipates energy, significantly reducing the structural vibration response.
The simplified model of the TMD is shown in Fig. 14, where represents the mass of the TMD system, is the spring stiffness, and is the damping coefficient. The TMD system can be considered a substructure, primarily controlling the first mode of vibration of the main structure by tuning to the main structure’s first natural frequency. Since the maximum displacement in the first mode occurs at the top of the structure, the vibration control device is optimally placed at or near the top of the main structure. This placement maximizes the vibration reduction benefits of the TMD. The TMD system is connected to the main structure using springs and dampers at both ends, which link the mass block to the main structure.
In this study, the finite element software ABAQUS is used to numerically simulate the TMD. The springs and dampers are modeled using the Spring/Dashpots module, and the mass block is modeled as a Point Mass.
Based on the analysis of the dynamic characteristics of the structure, the first mode frequency in the -direction of the TV transmission tower is 0.956 Hz. The total mass of the main structure is 77311 kg. Unless otherwise specified, the mass ratio is taken as 2 %, representing the ratio of the TMD mass to the total mass of the main structure, resulting in a TMD mass of 1546 kg.
Fig. 14Simplified model of tuned mass damper
The optimal frequency ratio for the TMD can be determined according to Den [6]:
where, represents the mass ratio, which is set at 2 %.
The optimal total stiffness of the TMD system can be calculated using the following formula:
where, represents the mass of the TMD system. In this study, the stiffness of the TMD system is provided by two springs at the ends, which are connected in series. Therefore, the effective stiffness is halved, resulting in. The natural frequency of the structure can be calculated using the following formula:
where is the frequency of the structure. In this study, the TMD system is tuned to the first mode frequency of the main structure, which is 0.956 Hz.
The optimal damping for the TMD system can be calculated using the following formula:
where is the damping ratio of the TMD system, which can be calculated using the following formula:
Based on the above design process, the TMD parameters suitable for the TV tower structure described in this study are listed in Table 8.
4.2. Control effect analysis
To verify the effectiveness of the TMD and evaluate the control performance of the vibration mitigation device, the peak reduction ratio and the root mean square (RMS) reduction ratio are selected as the criteria. The vibration reduction ratio is defined as follows:
where, represents the response of the structure without control, and represents the response of the structure under TMD control.
Table 8TMD design parameters
Design parameters | Value |
0.98 | |
0.09 | |
(kg) | 1546 |
(N/m) | 53571.46 |
(N∙s/m) | 1671.54 |
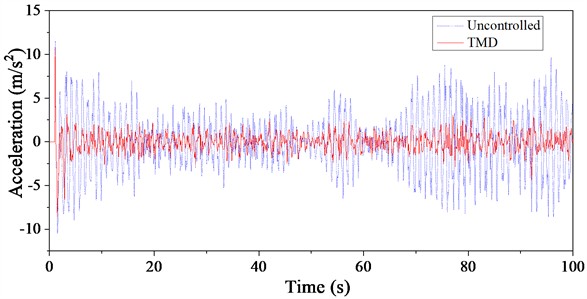
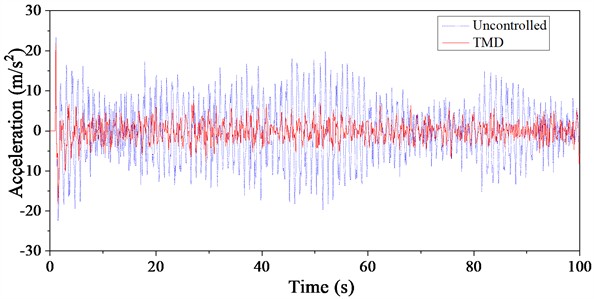
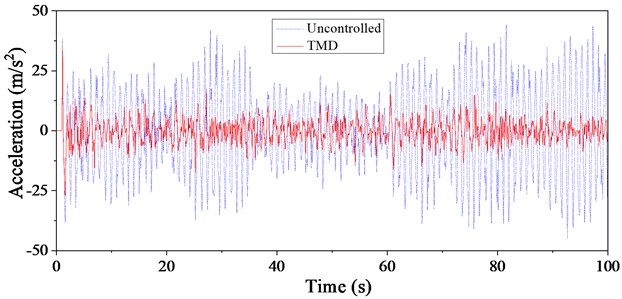
The results of the finite element dynamic response analysis indicate that the acceleration time history curve at the top of the signal transmission tower under extreme rainfall and wind loads is compared in Fig. 15. The acceleration time history curves for the controlled and uncontrolled cases show that both cases exhibit significant peaks around 1.1 seconds. However, after 1.1 seconds, the TMD’s vibration control capability is clearly demonstrated. The acceleration time history curve under TMD control consistently shows lower responses at every time point compared to the uncontrolled structure. The vibration reduction effect of the TMD varies with different basic wind speeds. Based on the envelope of the acceleration curve for the uncontrolled structure, the acceleration response at the top of the signal transmission tower under TMD control remains entirely within the range of the uncontrolled response. This indicates that the TMD provides stable vibration control and has a notable advantage in managing wind and rain loads.
Fig. 15Time history curve of top acceleration of TV tower under wind-rain load
a) Basic wind speed: 20 m/s
b) Basic wind speed: 30 m/s
c) Basic wind speed: 40 m/s
Analyzing the vibration reduction mechanism of the TMD and the spectral characteristics of wind and rain loads provides insight into the observed effects. Pulsating wind and rain loads are inherently random, and the variability in the response induced by these random loads results in differing TMD performance. Long-period wind and rain loads effectively excite the first mode of vibration in the signal transmission tower structure, which aligns well with the TMD’s primary focus on controlling the first mode frequency. Therefore, the TMD demonstrates strong control capabilities for wind and rain-induced vibrations in tall structures. Additionally, from the trend of the curves, the root mean square (RMS) reduction ratio is more favorable compared to the peak reduction ratio. A quantitative analysis of the vibration reduction effect will be conducted in subsequent sections.
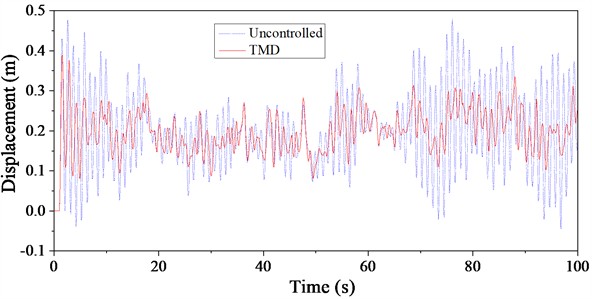
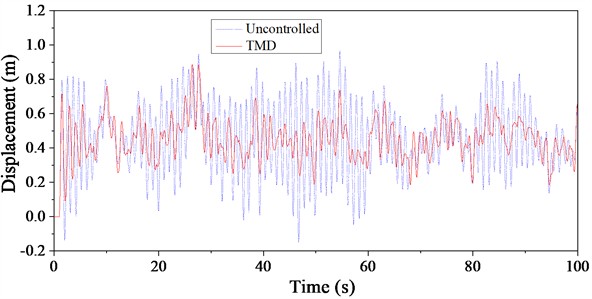
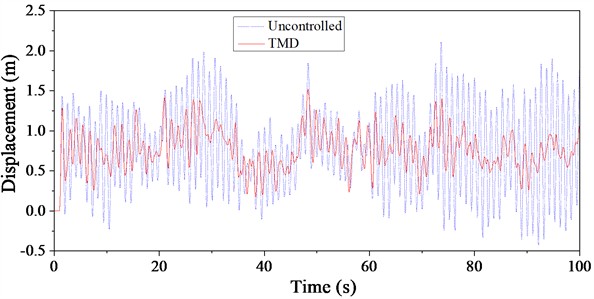
The displacement time history curves under wind and rain loads for the signal transmission tower, with and without TMD control, are compared in Fig. 16. Similar to the acceleration reduction effects, the TMD also demonstrates substantial potential for reducing displacement under wind and rain load excitation. The TMD's reduction effect on displacement follows a pattern consistent with its impact on acceleration, showing similar differences across various basic wind speeds. From the response at each time point, it is evident that the displacement response of the structure under TMD control is consistently smaller than that of the uncontrolled structure throughout the time period, highlighting the stable control capability of the TMD. Among the three basic wind speeds, the peak reduction in displacement under a basic wind speed of 30 m/s is the smallest, indicating a lower peak reduction ratio. In contrast, the TMD shows better peak displacement reduction under the other two basic wind speeds.
Analyzing the vibration reduction effects on displacement in conjunction with the TMD's vibration reduction mechanism, wind and rain loads are characterized by long periods and rich spectral content. These long-period loads effectively excite the primary vibration modes of the structure, leading to maximum responses that align well with the TMD's tuning advantages for vibration reduction.
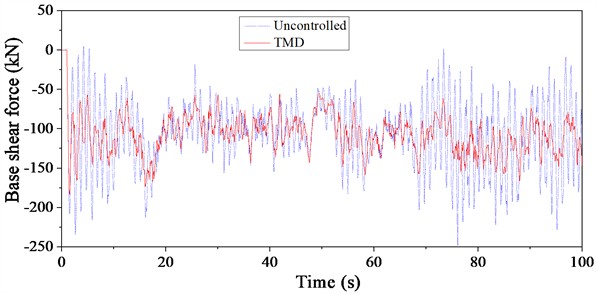
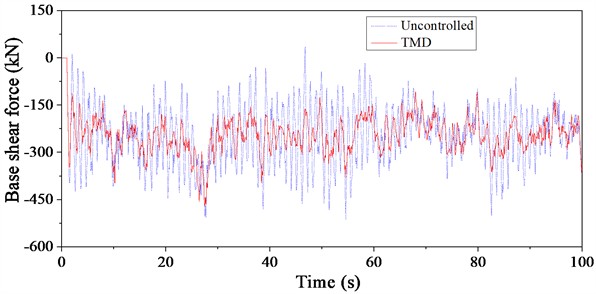
It can be observed that under wind and rain loads, the displacement at the top of the structure primarily shifts in the positive X-direction. Fig. 17 illustrates the comparison of base shear time histories under wind and rain loads. It is evident that the base shear direction is exactly opposite to the displacement direction. The TMD effectively suppresses the wind and rain-induced vibrations at the top of the signal transmission tower. The response of the structure varies with different basic wind speeds, and consequently, the effectiveness of the TMD control also changes. Generally, the TMD performs better under wind and rain loads at basic wind speeds of 20 m/s and 40 m/s compared to a basic wind speed of 30 m/s.
From the perspective of load frequency spectrum characteristics, the wind and rain loads have a rich frequency spectrum and belong to long-period loads, exhibiting a certain degree of randomness. This variability in the excitation leads to differences in the structural response and, consequently, in the vibration reduction effectiveness of TMD. Additionally, the reduction in base shear under TMD control helps mitigate the interaction between the superstructure and the foundation, thereby reducing fatigue damage and ensuring safe operation.
Fig. 16Time history curve of top displacement of TV tower under wind-rain load
a) Basic wind speed: 20 m/s
b) Basic wind speed: 30 m/s
c) Basic wind speed: 40 m/s
Quantitative data on vibration reduction, including acceleration, displacement, and base shear response reduction ratios under wind and rain loads, are presented in Table 9. To illustrate with acceleration response as an example, the peak reduction ratios for basic wind speeds of 20 m/s and 30 m/s are quite similar, at 7.18 % and 7.24 %, respectively. In contrast, the peak reduction ratio is most effective at a basic wind speed of 40 m/s, with a reduction ratio of 21.22 %. The root mean square (RMS) reduction ratio better reflects the TMD's ability to control structural responses to wind and rain-induced vibrations. For basic wind speeds of 20 m/s and 30 m/s, the RMS reduction ratios of the top acceleration response are 64.67 % and 63.23 %, respectively. At a basic wind speed of 40 m/s, the RMS reduction ratio reaches 70.89 %, demonstrating the effectiveness of TMD in controlling wind and rain-induced vibrations.
Fig. 17Time history curve of base shear force of TV tower under wind-rain load
a) Basic wind speed: 20 m/s
b) Basic wind speed: 30 m/s
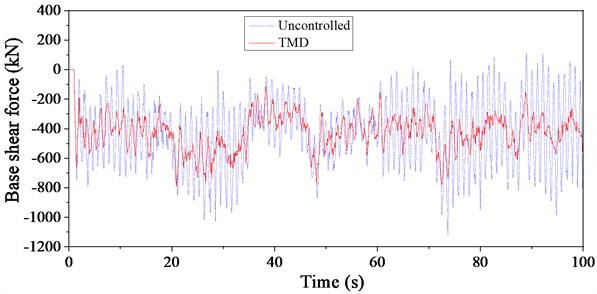
c) Basic wind speed: 40 m/s
Since the structure under wind and rain loads shifts primarily in the -direction, resulting in displacement and base shear responses being skewed to one side of the coordinate axis, the RMS reduction ratio is less suitable for representing the control effectiveness of TMD in this context. However, the peak reduction ratios still clearly indicate a significant decrease in response with TMD control. The response time history curves shown in Fig. 12-14 provide a more intuitive depiction of the TMD’s effective control over wind and rain-induced vibrations.
Table 9Vibration reduction rate of TV tower response under wind-rain load
Evaluation indicators | 20 m/s | 30 m/s | 40 m/s | |
Acceleration | Uncontrolled (m/s2) | 11.56 (3.34) | 23.47 (7.37) | 45.33 (17.9) |
TMD (m/s2) | 10.73 (1.18) | 21.77 (2.71) | 35.71 (5.21) | |
Peak vibration reduction rate % | 7.18 | 7.24 | 21.22 | |
RMS vibration reduction rate % | 64.67 | 63.23 | 70.89 | |
Displacement | Uncontrolled (m/s2) | 0.48 | 0.97 | 2.11 |
TMD (m/s2) | 0.39 | 0.89 | 1.52 | |
Peak vibration reduction rate % | 18.75 | 8.25 | 27.96 | |
RMS vibration reduction rate % | – | – | – | |
Base shear force | Uncontrolled (m/s2) | 249 | 516 | 1121 |
TMD (m/s2) | 184 | 471 | 791 | |
Peak vibration reduction rate % | 26.10 | 8.72 | 29.44 | |
RMS vibration reduction rate % | – | – | – | |
Note: In the “Uncontrolled” and “TMD” columns, the data outside the parentheses represent the maximum absolute value of the peak response, while the data inside the parentheses represent the RMS value | ||||
4.3. Parameter analysis
The analysis of vibration control under wind and rain loads also considers the impact of mass ratio and frequency ratio on the TMD's vibration control capability. A parametric analysis is conducted to determine the optimal TMD control parameters, aiming to achieve the best control effect and effectively suppress undesirable vibrations of the signal transmission tower under wind and rain loads. Unless otherwise specified, the mass ratio is set at 2 %, and the frequency ratio is taken as 1.0. Considering extreme rainfall conditions, wind loads with a basic wind speed of 20 m/s are used as input. The ratio of the peak displacement response at the top of the tower with TMD control to the peak displacement response without control is selected as the metric for evaluating the vibration control effectiveness of TMD.
The results of the parametric analysis of the mass ratio reveal the variation in the peak displacement response ratio with and without control, as shown in Fig. 18. Generally, as the mass ratio increases, the displacement ratio also increases, indicating that a larger TMD mass improves the reduction of the tower top displacement. The slope of the curve between mass ratios of 1 % and 1.5 % is steeper compared to the latter part of the curve. At 2 %, the slope shows a notable change; before this point, the increase in the TMD’s mass results in a more rapid improvement in vibration reduction. Beyond this point, the impact of the mass ratio on the TMD’s vibration reduction capability diminishes, with only a modest increase in reduction effect relative to the mass ratio.
The choice of control parameters is crucial for the TMD’s effectiveness. While a larger mass improves the vibration reduction effect, it also significantly affects the structure and can lead to cumulative damage. Considering both the enhancement in control and the potential impact on the structure, a mass ratio of 1.5 % is selected as the optimal for the TMD.
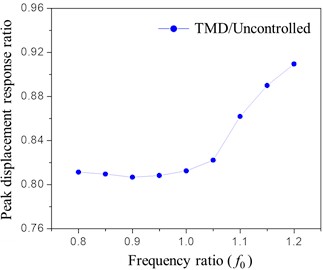
The parametric analysis of the frequency ratio shows the variation in peak displacement responses under different frequency ratios, as illustrated in Fig. 19. As the frequency ratio increases from 0.8 to 1.2, the displacement ratio initially decreases and then increases, indicating that the effectiveness of TMD in reducing tower top displacement first improves and then diminishes. When the frequency ratio is below 0.9, the displacement ratio decreases gradually, with a modest improvement in vibration reduction. However, when the frequency ratio exceeds 0.9, the reduction effect decreases noticeably.
The control frequency is a crucial parameter for the TMD and serves as the core of the tuned mass damper. The displacement ratio response curves for various frequency ratios under wind and rain loads remain below 1.0, demonstrating that the TMD performs well across the entire range of frequency ratios. The frequency ratio of 0.9 represents a significant turning point, where the TMD exhibits optimal control capabilities. Therefore, for wind and rain load conditions, a frequency ratio of 0.9 is selected as the optimal frequency ratio for the TMD.
Fig. 18Analysis of mass ratio under wind-rain load
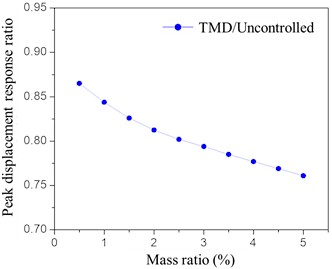
Fig. 19Analysis of frequency ratio under wind-rain load
5. Conclusions
Based on actual engineering projects, a detailed finite element model of the television tower was developed using ABAQUS in this study. The model comprehensively considered the combined effects of wind and rain loads on the structure, and examined the dynamic response under varying wind speeds and rainfall intensities. By strategically installing Tuned Mass Damper (TMD) in the tower, the study compared the dynamic responses of the tower with and without TMD control, assessing the effectiveness of TMD in reducing the dynamic response under wind and rain loads. Parameter analysis was conducted to reveal how variations in mass ratio and frequency ratio affect TMD performance. The key findings of the study are as follows:
1) Under combined wind and rain loads, node displacements near the top of the tower increase significantly compared to wind loads alone. Specifically, under these conditions, as the height exceeds 60 meters, the axial forces in the main materials decrease rapidly with increasing height. However, structural characteristics result in a sudden increase in axial force at 94.6 meters.
2) The dynamic response of the TV tower increases nonlinearly with the rise in basic wind speed and rain intensity. At a basic wind speed of 40 m/s, the maximum compressive stress in the elements exceeds the yield strength of the main structural members, which is 2.35E8 N/mm2, leading to plastic yielding and structural damage. Analysis of the dynamic response of the TV tower under the combined action of wind and rain loads reveals that the compressive members at a height of 60 m are the most likely to yield and enter the plastic stage.
3) Due to the high randomness of wind and rain loads, the effectiveness of TMD varies with changes in wind speed. Long-period wind and rain loads can excite the fundamental mode of the structure, making it more conducive for TMD to harness their vibration reduction advantages. Additionally, TMD demonstrate a greater reduction in the root mean square value of vibration compared to the peak value reduction.
4) Under wind-rain load excitation, the overall vibration reduction effectiveness of the TMD increases with the mass ratio. Based on a comprehensive analysis, a mass ratio of 1.5 % is identified as the optimal for TMD performance. As the frequency ratio increases from 0.8 to 1.2, the vibration reduction effect on the top displacement of the tower initially improves and then deteriorates, with the best vibration control observed at a frequency ratio of 0.9.
References
-
B.-H. Cho, E. Yu, and H. Kim, “Mitigation of wind-induced vibration of a tall residential building using liquid column vibration absorber,” Journal of Vibroengineering, Vol. 18, No. 2, pp. 1031–1040, Mar. 2016, https://doi.org/10.21595/jve.2015.16755
-
H. N. Li, Y. M. Ren, and H. F. Bai, “Dynamic analysis model of transmission tower system excited by wind and rain,” Proceedings of the CSEE, Vol. 27, pp. 43–48, Oct. 2007, https://doi.org/10.13334/j.0258-8013.pcsee.2007.30.001
-
H. N. Li and Q. Wang, “Study on dynamic response of point-supported glass curtain wall with cable truss system under coupled wind and rain loads,” Journal of Architecture and Civil Engineering, Vol. 29, pp. 7–12, Apr. 2012, https://doi.org/10.3969/j.issn.1673-2049.2012.04.002
-
X. Fu, H.-N. Li, and T.-H. Yi, “Research on motion of wind-driven rain and rain load acting on transmission tower,” Journal of Wind Engineering and Industrial Aerodynamics, Vol. 139, pp. 27–36, Apr. 2015, https://doi.org/10.1016/j.jweia.2015.01.008
-
S. T. Ke and W. L. Yu, “Aerodynamic forces and load-bearing performance of super large cooling towers under the combined action of wind and rain,” Journal of Vibration, Measurement and Diagnosis, Vol. 38, pp. 800–809, Aug. 2018, https://doi.org/10.16450/j.cnki.issn.1004-6801.2018.04.022
-
Zhiqiang Zhang, Aiqun Li, and Chen Yan, “Research on wind-induced vibration hybrid control of Hefei TV Tower,” in International Conference on Electric Technology and Civil Engineering (ICETCE), pp. 5387–5391, Apr. 2011, https://doi.org/10.1109/icetce.2011.5774508
-
Y. W. Dai, C. Liu, W. F. Li, and L. Tian, “Research on tuned mass damper for vibration control of tower under multi-dimensional seismic excitations,” Applied Mechanics and Materials, Vol. 353-356, pp. 2181–2186, Aug. 2013, https://doi.org/10.4028/www.scientific.net/amm.353-356.2181
-
W. P. Xie, D. Z. Xia, and W. J. Yang, “Finite element analysis of wind vibration control effect for single transmission tower,” Applied Mechanics and Materials, Vol. 670-671, pp. 1116–1120, Oct. 2014, https://doi.org/10.4028/www.scientific.net/amm.670-671.1116
-
X. Tong, X. Zhao, and S. Zhao, “Passive structural vibration control of a monopile wind turbine tower,” in 54th IEEE Conference on Decision and Control (CDC), pp. 1352–1357, Dec. 2015, https://doi.org/10.1109/cdc.2015.7402399
-
C. Sun and V. Jahangiri, “Bi-directional vibration control of offshore wind turbines using a 3D pendulum tuned mass damper,” Mechanical Systems and Signal Processing, Vol. 105, pp. 338–360, May 2018, https://doi.org/10.1016/j.ymssp.2017.12.011
-
A. Lannuzzi and P. Spinelli, “Artificial wind generation and structural response,” Journal of Structural Engineering, Vol. 113, No. 12, pp. 2382–2398, Dec. 1987, https://doi.org/10.1061/(asce)0733-9445(1987)113:12(2382)
-
K. Rong, L. Tian, J. Luo, and L. Wang, “Study on wind-induced fatigue performance of large-span transmission tower-line system considering the combined distribution probability of wind direction and speed,” Engineering Failure Analysis, Vol. 156, p. 107785, Feb. 2024, https://doi.org/10.1016/j.engfailanal.2023.107785
-
Z. S. Wang, Z. L. Li, and Z. Z. Xiao, “Study on along-wind equivalent static wind load of 1000kv double-circuit UHV transmission tower,” Power System Technology, Vol. 33, pp. 6–11, Dec. 2009.
-
Q. H. Wang et al., “Comparative analysis of equivalent static wind loads obtained from wind tunnel tests and load code calculations for super high-rise buildings with typical cross-sections,” Building Structure, Vol. 45, pp. 70–74, Jan. 2015, https://doi.org/10.19701/j.jzjg.2015.02.015
-
C. F. Wan et al., “Wind-induced vibration response analysis of a goat horn-shaped transmission tower,” Special Structures, Vol. 29, pp. 13–18, Apr. 2012, https://doi.org/10.3969/j.issn.1001-3598.2012.02.004
-
R. Cheng and S. F. Chen, “Study on wind-induced vibration model and characteristics of high-rise steel structure residential buildings,” Building Structure, Vol. 44, pp. 21–25, Oct. 2014, https://doi.org/10.19701/j.jzjg.2014.19.005
About this article
The research work was funded by the project of Slope safety control and disaster prevention technology innovation team of “Youth Innovation Talent Introduction and Education Plan” of Shandong Colleges and universities (Grant No. Lu Jiao Ke Han [2021] No. 51).
The datasets generated during and/or analyzed during the current study are available from the corresponding author on reasonable request.
Na Li: investigation, supervision, software, data curation, writing-original draft. Zhengquan Cheng: conceptualization, resources, supervision, writing-review and editing.
The authors declare that they have no conflict of interest.
