Abstract
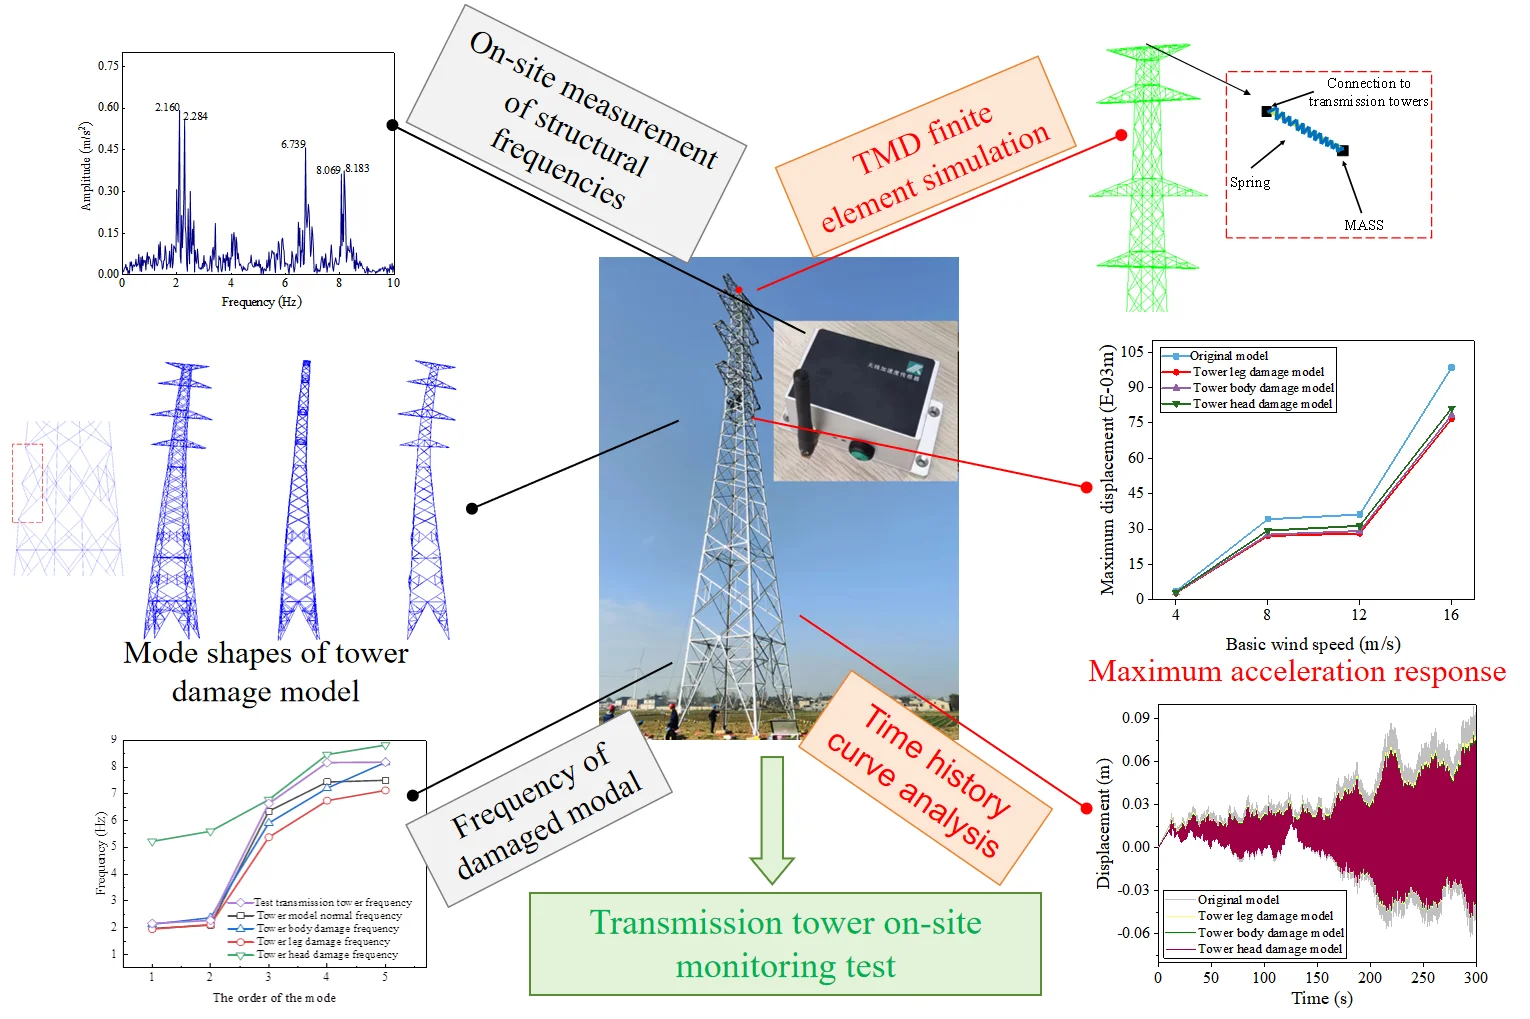
As existing transmission lines gradually approach their service life, health monitoring studies of in-service transmission towers are becoming increasingly important. In this study, relying on the 110 kV transmission line project of Neihuang Dichu to Er’an in Anyang, Henan Province, China, a refined finite element model of the transmission tower structure was established, and the accuracy of the numerical model was validated based on the health monitoring data of the actual engineering structure. Damage and destruction analyses of transmission tower structures considering vibration modes and frequencies were carried out, and the influence of local damage on the vibration reduction effectiveness of controlled structures under wind loads was discussed and analyzed. The results showed that the vibration mode of the local damage model was shifted along the damaged part, and its frequency changed within 15 %; in contrast, the dynamic characteristics of the local damage model changed more significantly. With the vibration mode as the judgment basis of the structural state, the obvious difference can be observed when the structure undergoes local damage, and the vibration mode should be used as the basis for determining the specific damage site of the transmission tower in the actual project. The adopted TMD can effectively reduce the dynamic response of the transmission tower under different wind attack angles and wind speeds, and its vibration reduction effectiveness performed the worst due to the significant change in the dynamic characteristics of the tower leg damage model, resulting in the detuning of the TMD.
Highlights
- Numerical model can capture the dynamic characteristics of transmission tower.
- Vibration modes can be applied to determine the local damage areas of the structure.
- Damage to the tower legs can easily lead to detuning of the dampers.
1. Introduction
With China’s rapid economic growth and increasing social demand for electricity, the continuous and efficient operation of the power grid system has become a matter of widespread concern. Transmission towers, as crucial components of power transmission lines, play a pivotal role in ensuring normal electricity delivery. However, subjected to long-term natural environmental impacts and external factors, transmission towers face various damages and aging issues, leading to reduced structural capacity and potentially compromising the safety and stability of transmission lines. Therefore, there is an urgent need for real-time monitoring and assessment research aimed at the health condition of transmission towers.
In recent years, structural health monitoring technology has rapidly advanced with the development of sensor, wireless communication, and data analytics technologies [1-5]. Sensors deployed on transmission towers enable real-time monitoring of structural conditions, vibration responses, and environmental influences, facilitating safety assessment and maintenance [6-8]. Kaminski et al. [9] proposed reliability assessment and standards formulation methods considering model uncertainties in predicting dynamic responses of steel towers affected by cable fractures. Wang et al. [10] developed an IoT-based vibration analysis system for transmission towers, incorporating functions such as vibration data collection, filtering, and time-frequency domain analysis, along with methods for assessing structural health. Qi et al. [11] improved inspection timeliness significantly by designing a sensor system for detecting vulnerabilities in transmission towers. Debnath et al. [12] studied modal methods for optimizing sensor placement and compared accelerometer measurements and modal participations in large truss bridge structures. Using structural health monitoring and finite element simulation methods, Peng et al. [13] integrated R-FCN network and Haar-AdaBoost algorithm to compute and quantify actual crack widths in bridges using unique crack characteristics in images and target distance data. Rafae et al. [14] proposed a comprehensive bridge detection system to meet exploration and assessment needs for bridge maintenance and reconstruction, demonstrating technical solutions to overcome existing model challenges. Jiang [15] utilized a Bayesian hypothesis testing-based method for assessing structural damage, evaluating the accuracy of identification metrics through differences between experimental data and model predictions.
Under wind loads, flexible transmission tower structures are prone to adverse vibrations. Scholars have conducted studies on structural vibration control methods for transmission line system [16-18]. Kubelwa et al. [19] reduced wind-induced vibrations in transmission towers using friction dampers. Kawaguchi et al. [20] validated the effectiveness of tuned mass dampers (TMD) for controlling vibrations in high-rise structures, proposing a method to estimate TMD behavior and suppression capabilities based on mass ratios. Battista et al. [21] employed nonlinear pendulum dampers to reduce horizontal displacements at the top, achieving a reduction rate of up to 90 % when coupled with the system's frequency. Santos et al. [22] compared the response of buildings with and without control under wind loads and concluded that the damping system can significantly reduce the acceleration of the floor slab. Rong et al. [23] proposed a nonlinear gas-spring damper to mitigate the structural dynamic responses.
In summary, the previous structural health monitoring mainly focuses on bridges, buildings and other engineering structures, while the monitoring of transmission lines mainly relies on manual inspection, the shortcomings of this approach is that it consumes a lot of manpower and material resources and is difficult to find potential structural problems, and the current health monitoring research for this fundamental energy facility structure is relatively small, not to mention judging the structural health of transmission tower based on the structural dynamics characteristics, and even fewer studies have been involved. Moreover, the existing studies on structural wind vibration control have not considered the effect of local damage on the dampers’ control performance.
This study relies on the 110 kV line project of Neihuang Dichu to Er’an in Anyang, Henan Province, China, and establishes a refined finite element model of the transmission tower structure, and the accuracy of the numerical model is validated on the basis of the health monitoring data of the actual engineering structure. The dynamic characteristic analysis of transmission tower considering local damage and destruction of the structure is carried out, and the influence of local destruction on the vibration reduction effectiveness of the controlled structure under wind loading is discussed and analyzed.
2. Finite element model and wind load simulation
2.1. Transmission tower
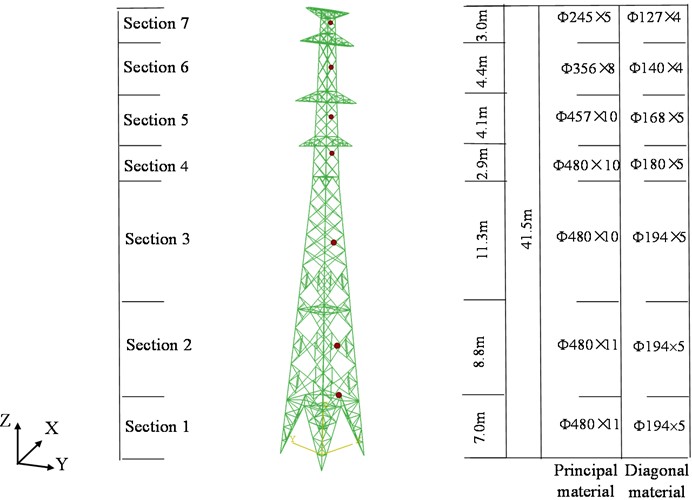
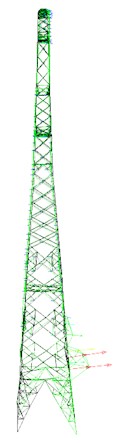
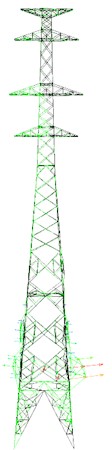
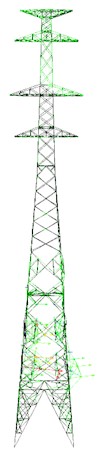
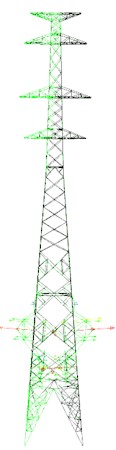
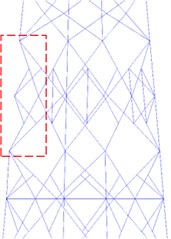
This study relies on the 110 kV transmission line project of Neihuang Dichu to Er’an in Anyang, Henan Province, China, the S2 double-circuit tower with a total height of 41.5 m is selected to establish the transmission tower model in ABAQUS software, and the specific model parameters are shown in Fig. 1. The transmission tower is simulated by beam element (B31), and its elastic modulus is 2.06×10⁵ MPa, and its mass density is 7850 kg/m3, Poisson’s ratio is 0.3, and the damping ratio takes the value of 2 %. Each member is modeled as a beam element, i.e., the element size (mesh size) is equal to the member size. Rigid joint constraints are set at the tower legs of the model to limit the six degrees of freedom in translation and rotation, and the plan dimensions and segments of the tower are given in Fig. 1.
Fig. 13D finite element model of transmission tower
2.2. Numerical model validation
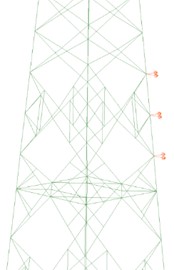
By installing wind speed/direction sensors, accelerometers, and strain monitoring devices on the primary materials of transmission towers, researchers obtain real-time data on micro-meteorological parameters, structural acceleration responses, and material strains. The top acceleration response of the transmission tower structure serves as the main analytical data in this study, with monitoring points illustrated in Fig. 2.
Fig. 2Acceleration monitoring point location
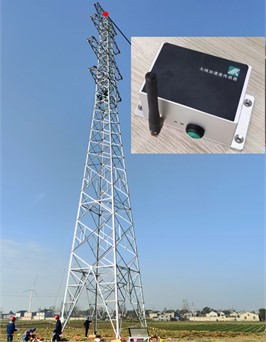
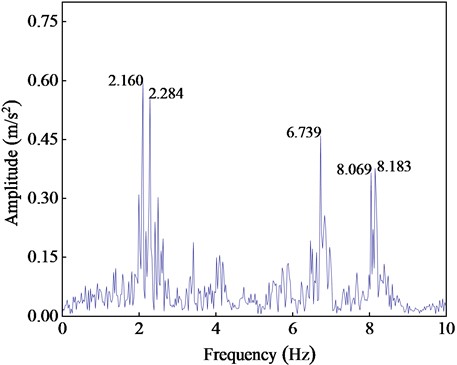
The acceleration sensor used in this study is the M63 series wireless vibration sensor with a range of 2 g, a sampling rate of 0-500 Hz, an accuracy of 0.01 cm/s, a synchronization accuracy of 0.1 ms, and a transmission method of 4G network. Acceleration time history curve at the tower top, derived from accelerometer data, are depicted in Fig. 3. Fourier transforming the acceleration responses reveals the structure's first five natural vibration frequencies: 2.160 Hz, 2.274 Hz, 6.739 Hz, 8.069 Hz, and 8.183 Hz, as shown in Fig. 4.
Fig. 3Acceleration time history curve
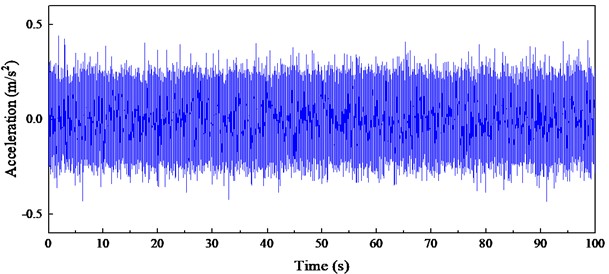
Fig. 4First five frequencies of transmission tower
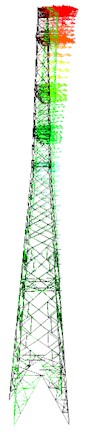
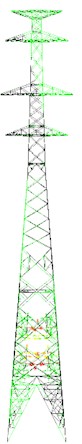
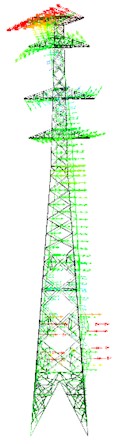
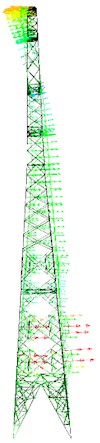
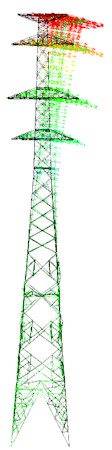
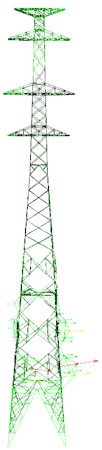
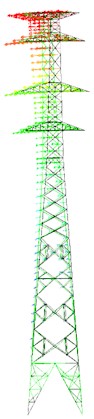
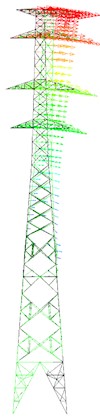
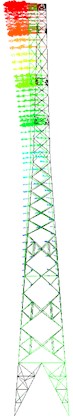
Utilizing a finite element model of the transmission tower structure, dynamic characteristics were analyzed using the Lanczos method to ascertain mode shapes and frequencies, illustrated in Fig. 5. The first mode displays global displacement along the tower’s -axis, while the second mode exhibits displacement along the -axis. The third mode indicates torsional vibration of the tower. In the fourth and fifth modes, notable displacements occur at the tower head, alongside localized modes in the lower section of the tower.
Table 1Comparison of numerical simulation and measured data
Mode order | 1st | 2nd | 3rd | 4th | 5th |
Experimental tower frequencies | 2.160 | 2.274 | 6.739 | 8.069 | 8.183 |
Model tower frequencies | 1.974 | 2.098 | 6.355 | 7.441 | 7.508 |
Error | 8.6 % | 7.7 % | 5.7 % | 7.8 % | 8.2 % |
Table 1 presents the natural frequencies of the transmission tower, showing a close alignment between the frequencies derived from the finite element model and those measured, with a maximum discrepancy of just 8.6 %. This indicates that the finite element model accurately captures the dynamic characteristics of the transmission tower.
Fig. 5First five mode shapes of transmission tower
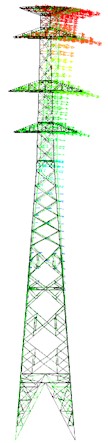
a) First mode shape
b) Second mode shape
c) Third mode shape
d) Fourth mode shape
e) Fifth mode shape
2.3. Wind load simulation
Wind load simulations must account for both mean and turbulent wind effects. MATLAB programming is employed to simulate the dynamic wind load on the tower-line system of the Yellow River Extra High Voltage Transmission Tower, adhering to the International Electrotechnical Commission (IEC) 62920-2017 standard through linear filtering techniques. The wind load acting on the transmission tower is calculated by Eqs. (1-3):
where, and are the components of wind load acting on the tower in and horizontal directions; is the air density, taking 1225; is the wind angle of attack; is the wind speed at a height of 10m; and are the lateral and longitudinal wind-blocking areas of the tower; and are the resistance coefficients perpendicular to the tower in the lateral and longitudinal directions, respectively; and is the wind load combination coefficient of the structure.
Table 2Height of simulation points and windbreak area selected for each segment
Transmission tower | Segment height (m) | -direction wind protection area (m2) | -direction wind protection area (m2) |
1 | 5.50 | 3.76 | 3.76 |
2 | 10.90 | 4.93 | 4.93 |
3 | 22.55 | 5.91 | 5.92 |
4 | 28.75 | 1.06 | 1.06 |
5 | 31.63 | 1.75 | 2.42 |
6 | 37.50 | 1.93 | 2.59 |
7 | 41.65 | 2.54 | 4.37 |
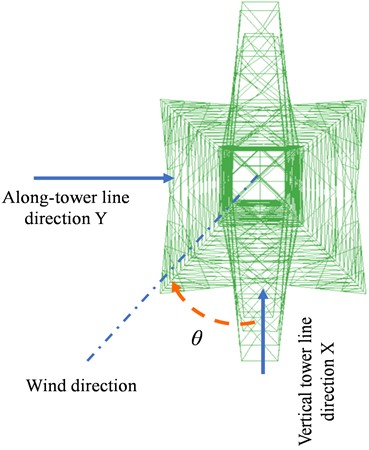
When simulating wind loads on the transmission tower, partition it into seven sections from base to top. Calculate the windward area for each section of the tower structure. Utilize the wind speed at the midpoint of each section to represent the wind speed in the respective simulation area, as illustrated in Fig. 1. Refer to Table 2 for the heights of designated simulation points within each section and their corresponding windward areas. When conducting wind load simulations, follow the wind angle of attack direction outlined in Fig. 6.
Fig. 6Schematic diagram of wind angle of attack of transmission tower
3. Dynamic characteristic analysis of local damage and destruction models
3.1. Analysis of local damage models
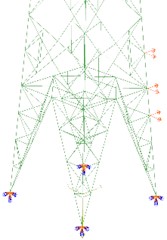
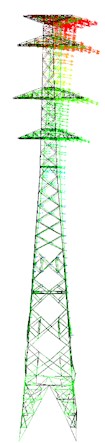
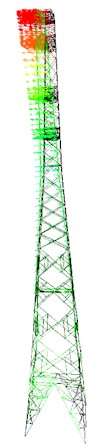
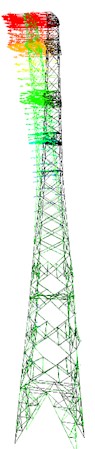
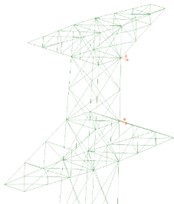
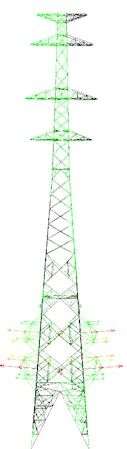
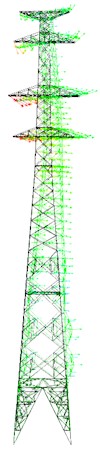
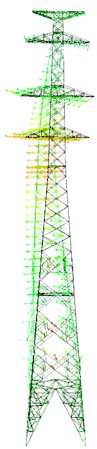
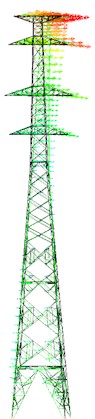
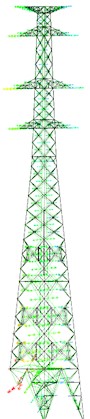
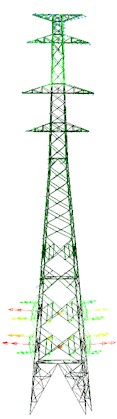
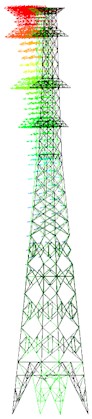
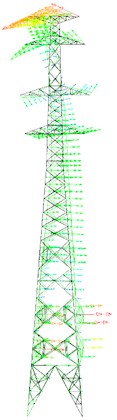
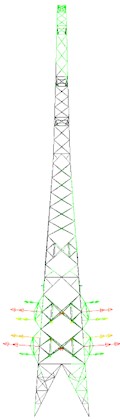
To investigate the variation patterns of mode shapes and frequencies of transmission towers after being damaged, 0.15 m displacements are applied individually to the main legs, main body, and masthead in the tower’s finite element model. Analysis of structural dynamic characteristics provides the first five vibration modes for damaged models of the legs, body, and masthead, illustrated in Figs. 7-9.
Compared to undamaged transmission tower models, damaged models in the legs and body exhibit shifts in the first and second vibration modes along weakened sections. The third mode shows asymmetrical torsional vibration with unequal maximum displacements on either side of the tower body. In the fourth and fifth modes, local maximum displacements are nearer to the lower part of the tower body. Regarding the masthead damage model, the first mode reflects local deformations at the body-leg junction, while the second and third modes depict torsional vibrations of the body with maximum displacement at the lower crossarm. The fourth and fifth modes closely resemble those of the undamaged model.
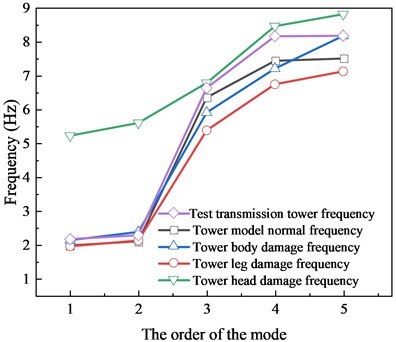
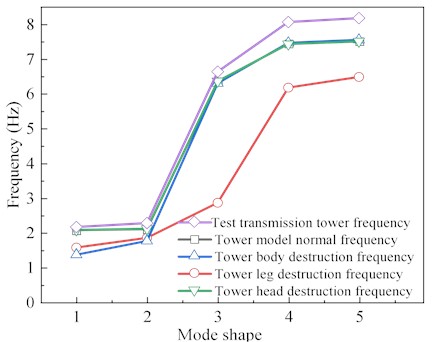
The frequencies for each vibration mode of locally damaged transmission towers are depicted in Fig. 10. Compared to the undamaged model, the leg-damaged model shows slightly lower frequencies in the first two modes and more pronounced differences in the third to fifth modes. Conversely, the body-damaged model exhibits higher frequencies in the first, second, and fifth modes, and lower frequencies in the third and fourth modes. The head-damaged model generally displays higher frequencies, particularly noticeable in the first three modes. However, localized displacements have minimal impact on the overall structural stiffness of transmission towers, resulting in insignificant changes in overall structural frequencies.
Fig. 7First five mode shapes of tower leg damage model
a) Tower body damage model
b) First mode shape
c) Second mode shape
d) Third mode shape
e) Fourth mode shape
f) Fifth mode shape
Fig. 8First five mode shapes of tower body damage model
a) Tower body damage model
b) First mode shape
c) Second mode shape
d) Third mode shape
e) Fourth mode shape
f) Fifth mode shape
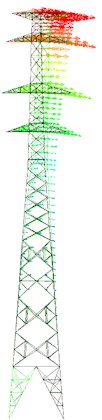
3.2. Analysis of local destruction models
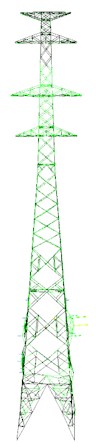
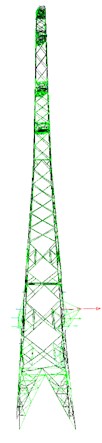
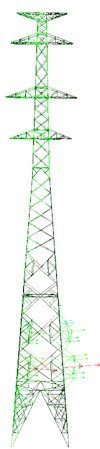
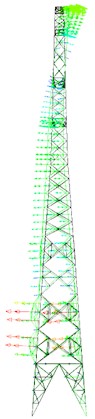
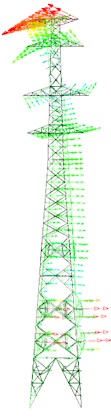
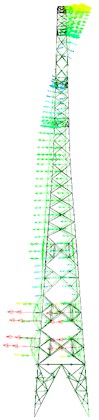
The analysis of vibration modes and frequencies in localized destruction models of transmission towers revealed significant changes in vibration modes following damage, with minor frequency variations. To investigate further, vulnerable sections of the tower’s primary materials were systematically removed using finite element simulation to simulate structural destruction and study its modal characteristics. Modal analysis extracted the initial five vibration modes of the damaged tower, illustrated in Figs. 11-13.
Fig. 9First five mode shapes of tower head damage model
a) Tower head damage model
b) First mode shape
c) Second mode shape
d) Third mode shape
e) Fourth mode shape
f) Fifth mode shape
Fig. 10Frequency line diagram of locally damaged transmission towers
Comparing the damage models, it is evident that the vibration mode changes in the tower leg and body destruction models closely align with the damage model, showing more pronounced variations in vibration modes. However, the vibration modes in the tower head destruction model exhibit significant differences compared to the damage model, with the first two modes displaying substantial displacements along the corresponding principal axes of the tower body. The third mode indicates tower torsion, but with a changed principal direction of twist, predominantly occurring along the tower body. The fourth and fifth modes show minimal changes, but with the maximum displacement direction shifting from the -axis to the -axis, indicating noticeable reverse torsion between the tower head and body.
The frequencies of the destruction transmission tower model, as shown in Fig. 14, are generally lower compared to the undamaged model, albeit with minor differences. Notably, the tower leg damage model exhibits the most significant deviation in frequencies from the undamaged model.
Fig. 11First five mode shapes of tower leg destruction model
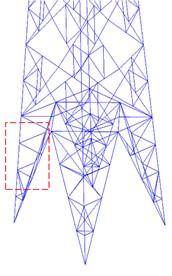
a) Tower leg destruction model
b) First mode shape
c) Second mode shape
d) Third mode shape
e) Fourth mode shape
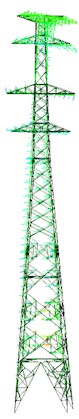
f) Fifth mode shape
Fig. 12First five mode shapes of tower body destruction model
a) Tower body destruction model
b) First mode shape
c) Second mode shape
d) Third mode shape
e) Fourth mode shape
f) Fifth mode shape
4. Influence of local damage on control effectiveness of controlled structures
In Section 3, the results of the dynamic characteristic analysis of the two models show that the vibration mode and frequency changes of the local damage model are the most significant in the three loading modes. According to the working principle of the tuned mass damper, the structural frequency variation has a greater impact on its control performance. Therefore, the local damage model is taken as the research object to carry out the research on wind vibration control of transmission towers to reveal the influence law of the local damage of the structure on the control effectiveness of the damper.
Fig. 13First five mode shapes of tower head destruction model
a) Tower head destruction model
b) First mode shape
c) Second mode shape
d) Third mode shape
e) Fourth mode shape
f) Fifth mode shape
Fig. 14Frequencies corresponding to each vibration mode of locally damaged transmission towers
4.1. Parameter design method
The conventional TMD, recognized as a mature passive control device, utilize well-established quantitative design methods. These methods integrate the dynamic analysis of transmission tower characteristics and derive parameters for stiffness coefficient and damping coefficient , employing Eqs. (4-7) for calculation:
where 𝑚 is the mass of the mass block; 𝜇 is the mass ratio; 𝛽 is the structure damping ratio; and 𝜔 is the fundamental frequency of the structure.
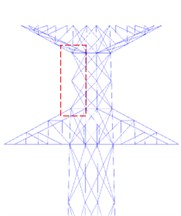
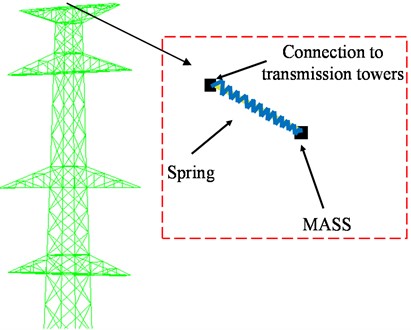
In this study, the transmission tower model itself is selected with a mass of 396,382.1 kg and a first-order vibration mode of 2.266 in the direction, and the TMD configuration parameters applicable to this structure are shown in Table 3. The mass is simulated in ABAQUS using the MASS element, and the stiffness and damping are simulated using the SPRINGS/DASHPOTS element as shown in Fig. 15.
Table 3Configuration parameters of TMD
Design parameters | (kg) | (N/m) | (N/(m/s)) | ||||
Design value | 0.02 | 0.02 | 1.0199 | 0.1596 | 7927.642 | 42342.746 | 31236.287 |
Fig. 15Additional TMD finite element simulation of transmission towers
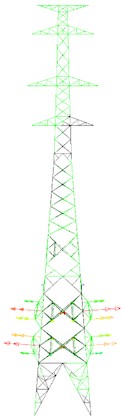
4.2. Influence analysis of different destruction modes on TMD control effectiveness
TMD are applied to three models of transmission towers with local destruction, considering wind attack angles of 0°, 45°, 60°, and 90°. The effectiveness of vibration reduction is assessed for both untreated models and those equipped with TMD. Wind speeds of 4 m/s, 8 m/s, 12 m/s, and 16 m/s are used to simulate fluctuating wind loads over a duration of 300 s, following the method described in Section 2.2.
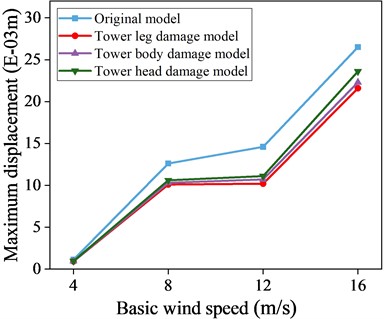
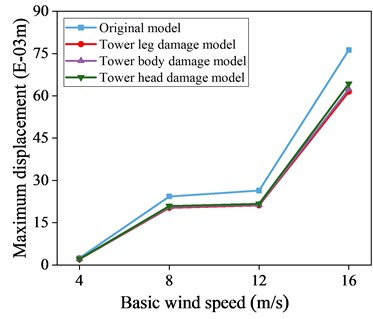
Fig. 16Maximum displacement response data with and without control of local damage model
a) 0° wind angle of attack
b) 45° wind angle of attack
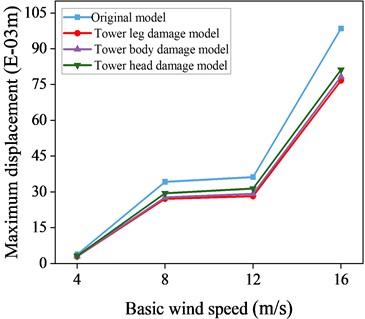
c) 60° wind angle of attack
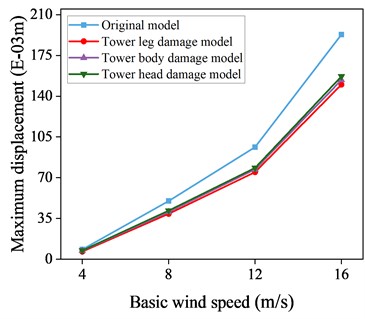
d) 90° wind angle of attack
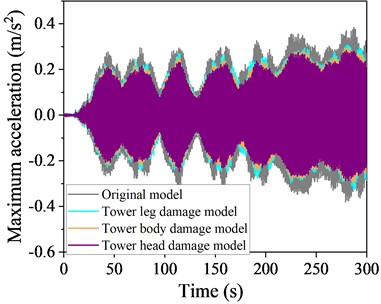
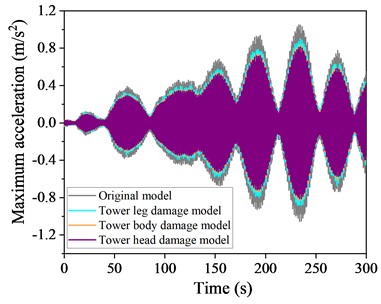
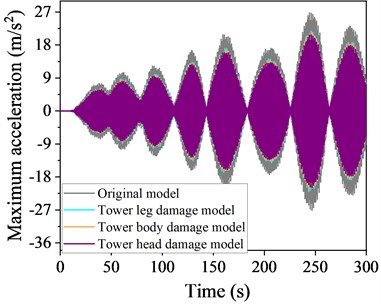
Figs. 16-17 present maximum displacement and acceleration responses for uncontrolled local destruction models under different wind attack angles and speeds. TMD show effective vibration reduction across varying conditions, evident in both displacement and acceleration responses. The greatest reduction occurs at a 90° wind attack angle, where maximum displacement is reduced by 21.6 % and maximum acceleration by 22.7 % at a wind speed of 16 m/s. This outcome is due to the TMD’s alignment with the -axis for vibration reduction at a 90° wind attack angle.
Fig. 17Maximum acceleration response data with and without control of local damage model
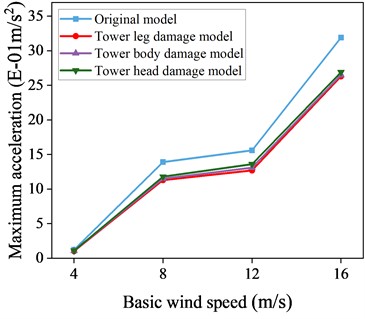
a) 0° wind angle of attack
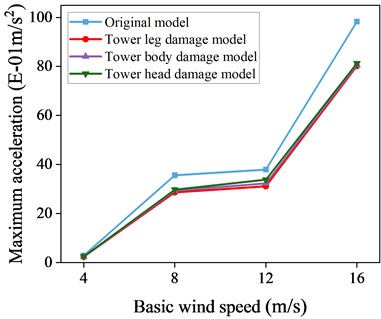
b) 45° wind angle of attack
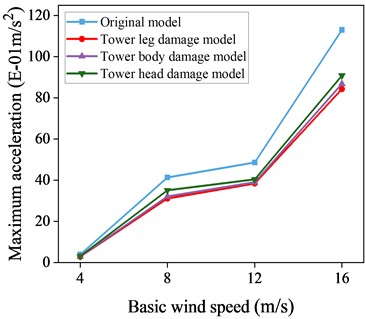
c) 60° wind angle of attack
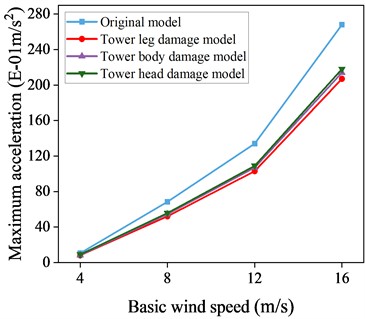
d) 90° wind angle of attack
Fig. 18Time history curve of displacement at the top of a local destruction model structure at 60° wind angle of attack
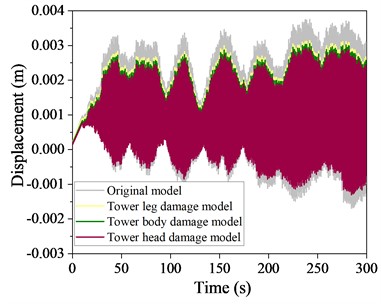
a) Basic wind speed 4 m/s
b) Basic wind speed 16 m/s
Fig. 19Time history curve of acceleration at the top of a local destruction model structure at 60° wind angle of attack
a) Basic wind speed 4 m/s
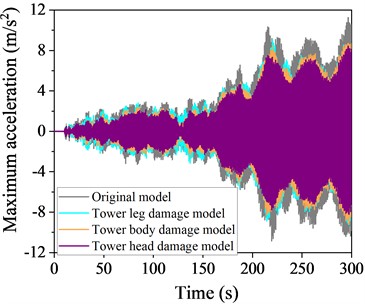
b) Basic wind speed 16 m/s
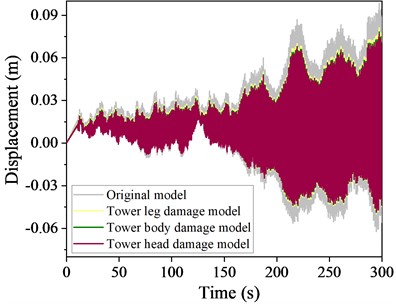
Fig. 20Time history curve of displacement at the top of a local destruction model structure at 90° wind angle of attack
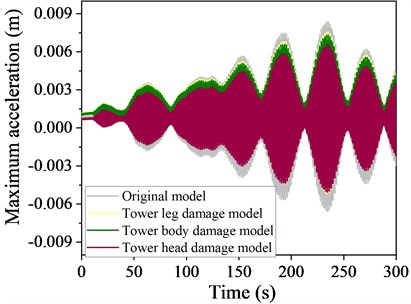
a) Basic wind speed 4 m/s
b) Basic wind speed 16 m/s
To intuitively present the damping effectiveness of the TMD in different damage modes, a comparison of the time history curves of the displacement and acceleration at the top of the structure with and without control of the local damage model at a 60° wind angle of attack is presented in Figs. 18-19, respectively.
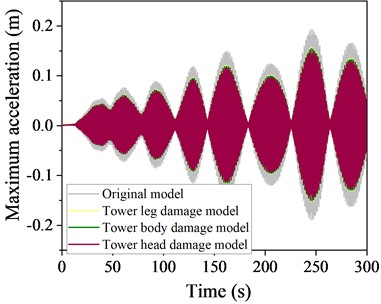
A comparison of the time history curves of the response at a 90° wind angle of attack is presented in Figs. 20-21, respectively. The TMD effectively mitigate these responses at both angles, with the tower head destruction mode showing the most significant reduction, followed by the tower body and leg destruction modes.
Comparing the vibration reduction effectiveness across three destruction modes reveals that, under varying wind attack angles and speeds, all three models benefit from the addition of TMD. The tower head destruction mode shows the best vibration reduction, followed by the tower body and then the leg destruction mode, with reductions of 22.7 %, 21.3 %, and 18.6 %, respectively. This phenomenon arises because structural changes due to leg destruction significantly alter the tower's dynamic characteristics, resulting in TMD detuning and a decrease in control performance. Therefore, in the design and maintenance of transmission towers, particular attention should be paid to the tower legs.
Fig. 21Time history curve of acceleration at the top of a local destruction model structure at 90° wind angle of attack
a) Basic wind speed 4 m/s
b) Basic wind speed 16 m/s
5. Conclusions
Relying on actual engineering, this study establishes a refined finite element model of the transmission tower structure using ABAQUS, and verifies its validity based on field monitoring data. The dynamic characteristic analysis of transmission tower considering local damage and destruction is carried out, and the influence of local destruction on the control pattern of wind vibration response of the controlled structure is further investigated. The main conclusions are as follows:
1) The mode shape of the local damage model shifted along the damaged area, and the difference between its frequency and that of the undamaged model is basically kept within 15 %; in contrast, the mode shape and frequency of the local destruction model changes more dramatically, especially the tower leg destruction model, whose frequency change is up to 37 %.
2) Taking the frequency as the basis of structural state judgement, a significant difference occurs only when local destruction occurs in the structure; while taking the mode shape as the basis, a significant difference can be observed when local damage occurs in the structure. Therefore, the specific damage site of transmission tower should be determined by the change of mode shape in the actual project.
3) TMD can effectively reduce the dynamic response of transmission towers under different wind angles of attack and wind speeds, and the comparison results of the three destruction models show that the tower leg destruction model has the worst damping effect due to the fact that the tower leg destruction leads to significant changes in the structural dynamic characteristics, resulting in TMD detuning.
References
-
R. K. Aggarwal, A. T. Johns, J. A. S. B. Jayasinghe, and W. Su, “An overview of the condition monitoring of overhead lines,” Electric Power Systems Research, Vol. 53, No. 1, pp. 15–22, Jan. 2000, https://doi.org/10.1016/s0378-7796(99)00037-1
-
Y. Momomura, H. Marukawa, T. Okamura, E. Hongo, and T. Ohkuma, “Full-scale measurements of wind-induced vibration of a transmission line system in a mountainous area,” Journal of Wind Engineering and Industrial Aerodynamics, Vol. 72, pp. 241–252, Nov. 1997, https://doi.org/10.1016/s0167-6105(97)00240-7
-
Y. Y. Li, “Hypersensitivity of strain-based indicators for structural damage identification: A review,” Mechanical Systems and Signal Processing, Vol. 24, No. 3, pp. 653–664, Apr. 2010, https://doi.org/10.1016/j.ymssp.2009.11.002
-
C. Papadimitriou, “Pareto optimal sensor locations for structural identification,” Computer Methods in Applied Mechanics and Engineering, Vol. 194, No. 12-16, pp. 1655–1673, Apr. 2005, https://doi.org/10.1016/j.cma.2004.06.043
-
J. A. Vergara, R. Castro-Triguero, D. Bullejos, R. Gallego, and D. Zamora, “Optimal sensor placement for structural health monitoring of power transmission tower-line systems,” in Conference Proceedings of the Society for Experimental Mechanics Series, pp. 415–422, May 2013, https://doi.org/10.1007/978-1-4614-6555-3_45
-
H. Sun and O. Büyüköztürk, “Optimal sensor placement in structural health monitoring using discrete optimization,” Smart Materials and Structures, Vol. 24, No. 12, p. 125034, Dec. 2015, https://doi.org/10.1088/0964-1726/24/12/125034
-
X. Meng, H. Zhang, K. Jia, H. Li, and Y. Huang, “Optimal sensor placement for structural health monitoring based on deep reinforcement learning,” Smart Structures and Systems, Vol. 31, No. 3, pp. 247–257, Mar. 2023, https://doi.org/10.12989/sss.2023.31.3.247
-
J. Kaminski, J. D. Riera, R. C. R. de Menezes, and L. F. F. Miguel, “Model uncertainty in the assessment of transmission line towers subjected to cable rupture,” Engineering Structures, Vol. 30, No. 10, pp. 2935–2944, Oct. 2008, https://doi.org/10.1016/j.engstruct.2008.03.011
-
A. Philips Adewuyi, Z. Wu, and N. H. M. Kammrujaman Serker, “Assessment of vibration-based damage identification methods using displacement and distributed strain measurements,” Structural Health Monitoring, Vol. 8, No. 6, pp. 443–461, Aug. 2009, https://doi.org/10.1177/1475921709340964
-
W. Zhangqi, W. Jian, and Z. Li, “Transmission Tower Vibration Analysis System Based on Internet of Things,” International Journal of Materials, Mechanics and Manufacturing, Vol. 4, pp. 294–298, Jan. 2015, https://doi.org/10.18178/ijmmm.2016.4.4.274
-
Q. Ling, B. Hu, X. Shen, H. Liao, and H. Ni, “Health perception system design based on sensor internet of things for transmission tower’s structure status,” in IOP Conference Series: Earth and Environmental Science, Vol. 668, No. 1, p. 012080, Feb. 2021, https://doi.org/10.1088/1755-1315/668/1/012080
-
N. Debnath, A. Dutta, and S. K. Deb, “Placement of sensors in operational modal analysis for truss bridges,” Mechanical Systems and Signal Processing, Vol. 31, pp. 196–216, Aug. 2012, https://doi.org/10.1016/j.ymssp.2012.04.006
-
X. Peng, X. Zhong, C. Zhao, A. Chen, and T. Zhang, “A UAV-based machine vision method for bridge crack recognition and width quantification through hybrid feature learning,” Construction and Building Materials, Vol. 299, p. 123896, Sep. 2021, https://doi.org/10.1016/j.conbuildmat.2021.123896
-
R. Sacks et al., “SeeBridge as next generation bridge inspection: overview, information delivery manual and model view definition,” Automation in Construction, Vol. 90, pp. 134–145, Jun. 2018, https://doi.org/10.1016/j.autcon.2018.02.033
-
X. Jiang and S. Mahadevan, “Bayesian probabilistic inference for nonparametric damage detection of structures,” Journal of Engineering Mechanics, Vol. 134, No. 10, pp. 820–831, Oct. 2008, https://doi.org/10.1061/(asce)0733-9399(2008)134:10(820)
-
L. Tian and Y. Zeng, “Parametric study of tuned mass dampers for long span transmission tower-line system under wind loads,” Shock and Vibration, Vol. 2016, pp. 1–11, Jan. 2016, https://doi.org/10.1155/2016/4965056
-
K. Rong, L. Tian, J. Luo, and L. Wang, “Study on wind-induced fatigue performance of large-span transmission tower-line system considering the combined distribution probability of wind direction and speed,” Engineering Failure Analysis, Vol. 156, p. 107785, Feb. 2024, https://doi.org/10.1016/j.engfailanal.2023.107785
-
Y. Liu, T. Li, L. Li, Z. Cheng, K. Rong, and L. Tian, “Study on vibration response and isolation of substation structure under subway load excitation,” Journal of Vibroengineering, Vol. 26, No. 3, pp. 690–705, May 2024, https://doi.org/10.21595/jve.2023.23790
-
Y. D. Kubelwa, A. G. Swanson, K. O. Papailiou, and D. G. Dorrell, “On the Euler-Lagrange formalism to compute power line bundle conductors subject to aeolian vibrations,” Mechanical Systems and Signal Processing, Vol. 163, p. 108099, Jan. 2022, https://doi.org/10.1016/j.ymssp.2021.108099
-
A. Kawaguchi, A. Teramura, and Y. Omote, “Time history response of a tall building with a tuned mass damper under wind force,” Journal of Wind Engineering and Industrial Aerodynamics, Vol. 43, No. 1-3, pp. 1949–1960, Jan. 1992, https://doi.org/10.1016/0167-6105(92)90619-l
-
R. C. Battista, R. S. Rodrigues, and M. S. Pfeil, “Dynamic behavior and stability of transmission line towers under wind forces,” Journal of Wind Engineering and Industrial Aerodynamics, Vol. 91, No. 8, pp. 1051–1067, Aug. 2003, https://doi.org/10.1016/s0167-6105(03)00052-7
-
M. A. Santos-Santiago, S. E. Ruiz, and F. Valenzuela-Beltrán, “Wind-induced vibration control for buildings equipped with non-linear fluid viscous dampers,” Vibroengineering Procedia, Vol. 21, pp. 119–124, Dec. 2018, https://doi.org/10.21595/vp.2018.20315
-
K. Rong, Z. Lu, J. Zhang, M. Zhou, and W. Huang, “Nonlinear gas-spring DVA for seismic response control: Experiment and numerical simulation,” Engineering Structures, Vol. 283, p. 115940, May 2023, https://doi.org/10.1016/j.engstruct.2023.115940
About this article

The authors have not disclosed any funding.
The datasets generated during and/or analyzed during the current study are available from the corresponding author on reasonable request.
Chen and Chen and Liang Zhang: investigation, supervision, writing-original draft. Kai Niu and Mengqi Zhai: software, data curation, writing-review and editing. Fengkai Han: writing-review and editing. Kunjie Rong and Li Tian: conceptualization, resources, supervision, writing-review and editing.
The authors declare that they have no conflict of interest.
