Abstract
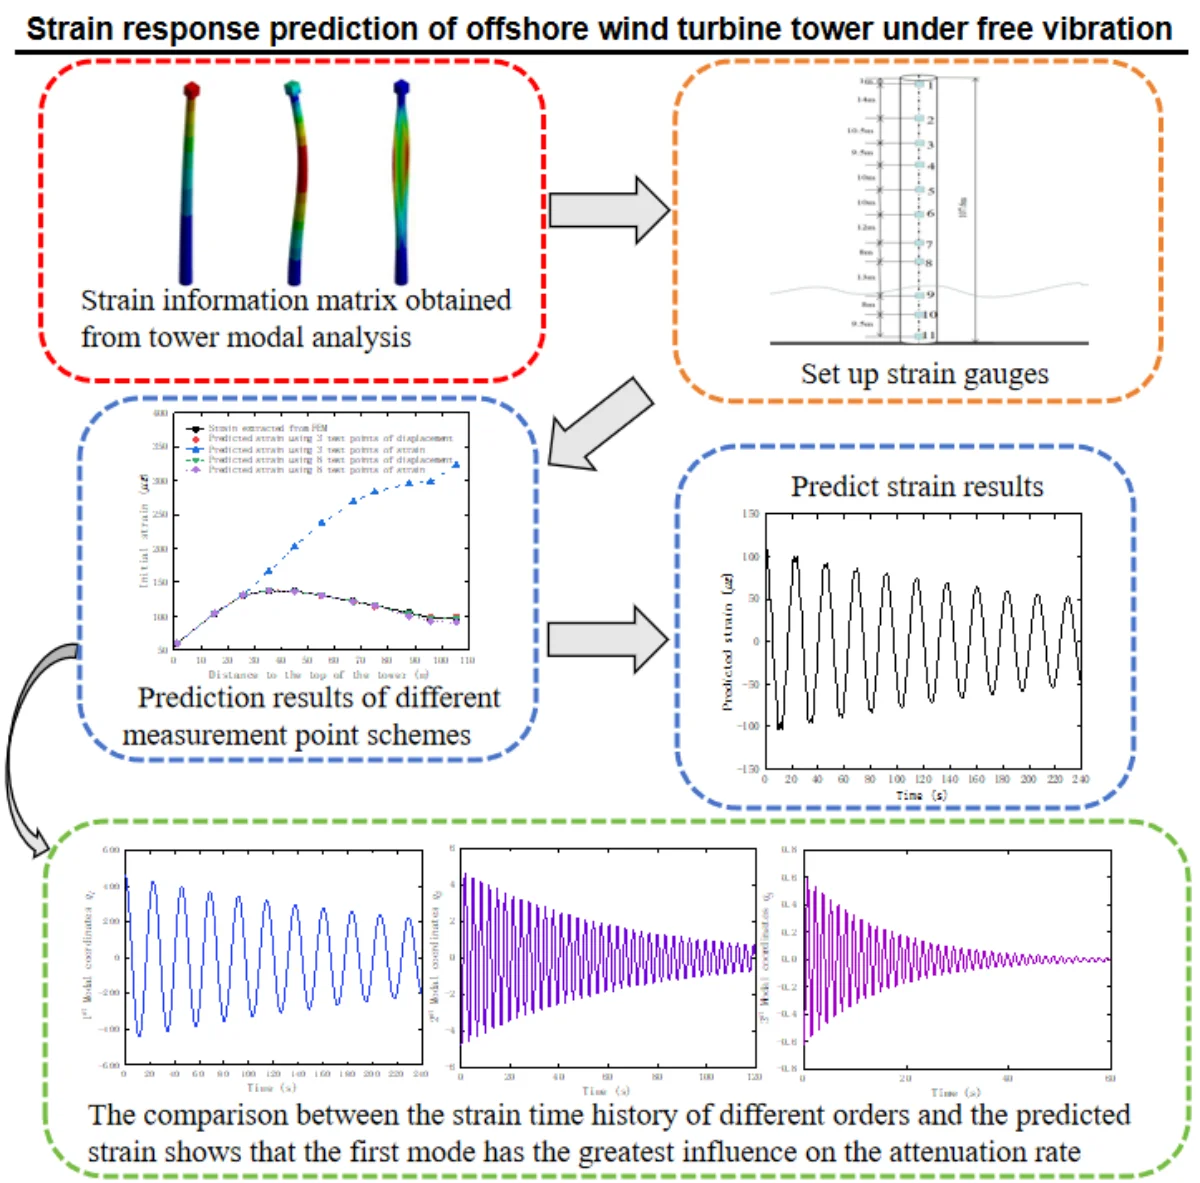
Strain monitoring of critical locations in offshore wind turbine tower is essential for fatigue life prediction and safe operation of wind turbine. This paper theoretically analyses the feasibility of predicting tower strain under free vibration using the modal superposition method. A finite element numerical model of the tower is established, and the displacement mode and strain mode parameters of the tower are extracted. The initial displacement and strain of the tower at cut-out wind speed are analyzed, and the first three modal coordinate of the tower are calculated using test points of displacement or strain separately. Subsequently, the full field strain of the tower is predicted using the modal superposition method. Comparative results demonstrate higher accuracy in modal coordinate values calculated using test points of displacement, and the accuracy and errors of strain prediction using different numbers of test points are compared, emphasizing the crucial role of selecting optimal positions and numbers of test points in improving prediction accuracy.
Highlights
- Explore the feasibility of predicting tower strain under free vibration conditions by employing the modal superposition method.
- Compared the accuracy and errors of strain prediction using different numbers of test points.
- The crucial role of selecting optimal positions and numbers of test points in improving prediction accuracy.
1. Introduction
The tower of offshore wind turbine not only withstands thrust and torque from the blades but also loads waves and ocean currents. Therefore, the dynamic strain monitoring of offshore wind turbine is useful for fatigue damage prediction [1, 2]. The strain sensors are difficult to install and prone to high failure rates especially located in the underwater section of the tower. Thus, predicting the full field strain in the underwater section based on limited measurement points at the top of the tower has practical significance.
Bang et al. presented a study on the measurement of strain and bending deflection in wind turbine towers using arrayed Fiber Bragg Grating sensors [3]. Brincker et al. proposed a local correspondence principle for mode shapes in structural dynamics, which contributes to the identification of mode shapes [4]. Erazo and Hernandez focused on model-based observers for state and stress estimation in structural and mechanical systems [5]. Hu et al. investigated output-only modal analysis of wind turbine towers based on vibration response during emergency stop situations [6]. Henkel et al. developed a strain estimation method for offshore wind turbines with jacket substructures, utilizing dual-band modal expansion [7]. This technique allows for accurate strain monitoring and fatigue assessment, contributing to the overall structural integrity of offshore wind farms.
Virtual sensing has emerged as a valuable technique for monitoring structural vibrations without the need for physical sensors. Kullaa presented a study on virtual sensing of structural vibrations using dynamic substructuring [8]. This approach utilizes numerical models and the concept of substructures to estimate vibration responses, offering cost-effective and efficient alternatives to traditional sensor-based measurements. Maes et al. focused on dynamic strain estimation for fatigue assessment of an offshore monopile wind turbine [9]. Their research incorporated filtering and modal expansion algorithms to estimate dynamic strains. Mendonca et al. presented a study on the prediction of dynamic responses in a rectangular beam using the modal expansion method [10]. Skafte et al. conducted an experimental study on strain prediction using modal decomposition and quasi-static Ritz vectors [11]. Tarpø et al. expanded the experimental mode shape obtained from operational modal analysis and virtual sensing for fatigue analysis using the modal expansion method. Furthermore, Tarpø et al. explored the full-field strain estimation of subsystems within time-varying and nonlinear systems using modal expansion [12, 13]. By incorporating modal expansion techniques, the authors achieved accurate strain estimation, enabling comprehensive health monitoring of complex systems.
The novelty of this study lies in the systematic application of modal superposition methods to predict strain in wind turbine towers, a theory validated by experimental data. This not only provides a new method for the design and maintenance of wind turbine towers but also serves as a reference for dynamic response analysis of similar structures. In the future, this method is expected to be applied to a wider range of structural health monitoring and fatigue life prediction, showing broad prospects for practical application. Subsequently, a finite element model of the wind turbine tower is established, and the modal parameters of displacement and strain modes are extracted. The initial displacements and strains of the tower at the cut-out wind speed are analyzed, and modal coordinates are calculated based on displacement and strain test points, respectively. The accuracy and error of strain prediction using different numbers of test points are compared. Additionally, the strain time history of the tower obtained through modal superposition during free vibration of the tower is analyzed.
2. Theory of predicting structural strain based on modal superposition method
The wind turbine tower can be studied using the damped cantilever beam model. The differential equation of the beam under free vibration is given by [14]:
where is the elastic modulus of the beam, is the moment of inertia of the cross-section, is the displacement along the direction at time , is the damping coefficient, is the density of the beam, is cross-sectional area of the beam.
In the linear range, using the modal superposition method, the displacement can be expressed as [15]:
where is the -th order displacement mode shape, is the corresponding modal coordinate.
Substituting Eq. (2) into Eq. (1) and utilizing the orthogonality of displacement mode shapes, we can derive the decoupled differential equation for each mode:
where is the damping ratio of the -th mode, is the undamped natural frequency of the -th mode:
where is the length of the beam.
The strain at any point of the beam is given by:
where is the height of the beam, substituting Eq. (2) into Eq. (7), we obtain:
Eq. (8) indicates that the strain at any point on the beam is a superposition of the strain projecting into each mode space. Here, is defined as the -th strain mode shape:
From Eq. (8) and Eq. (9), it can be inferred that by superimposing the products of each order strain mode shape and modal coordinate, the strain at any point of the structure can be obtained. When the displacement and displacement mode shapes are known, the modal coordinates can also be obtained from Eq. (2).
When the beam is in a state of free vibration, the time history of the -th mode modal coordinate is as follows:
where is the damped natural frequency of the -th mode:
3. Numerical model
3.1. Model of the 5 MW wind turbine
This research focuses on the NREL 5 MW offshore monopile wind turbine, the incoming wind direction for this turbine is upwind, and it is equipped with a three-blade rotor, as shown in Fig. 1 [16]. In this coordinate system, the axis represents the nominal downwind direction, the axis represents the nominal crosswind direction, and the axis represents the vertical direction from the tower base to the nacelle. The main properties of NREL 5 MW wind turbine are shown in Table 1.
When establishing the finite element model, the tower merged with the monopile was modeled with a linearly tapered profile, which the radius and thickness gradually decrease from the tower base to the top. For model simplification purposes, a mass block was created at the top of the tower to effectively represent the rotor and nacelle. The mass block was assigned a density of 2800 kg⋅m-3 and volume of 125 m3, the centroid of the mass block was offset by 0.2 m from the tower central axis to effectively replace the rotor and nacelle. In finite element analysis, the tower is divided using a hexahedral mesh with a grid size of 0.5 m. The total number of nodes is 204,143, and the total number of elements is 36,916.
Fig. 1Offshore wind turbine model
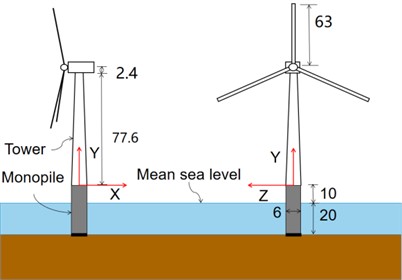
Table 1Properties of NREL 5 MW wind turbine
Properties | Value |
Cut-in, rated, cut-out wind speed | 3 m s-1, 11.4 m s-1, 25 m s-1 |
Rotor, hub diameter | 126 m, 3 m |
Hub height | 90 m |
Cut-in, rated rotor speed | 6.9 rpm, 12.1 rpm |
Top section diameter | 3.9 m |
Bottom section diameter | 6 m |
Monopile diameter | 6 m |
Tower wall thickness | 19-27 mm |
Density of tower | 7850 kg⋅m-3 |
Young’s modulus of tower | 210 GPa |
Poisson’s ratio of tower | 0.3 |
3.2. Displacement mode and strain mode analysis of the tower
In the modal analysis of wind turbine tower, Rayleigh damping is assumed, and the modal analysis results are shown in Table 2 and compared with other published modeling results [17, 18]. The modal participation factors of the first three modes of the tower have reached 91 %, hence the first three modes are considered for modal superposition. The first three displacement mode shapes of the tower are shown in Fig. 2. Because of the symmetrical structure of the tower, the vibration modes of the tower include the Fore-Aft (FA) direction and Side-Side (SS) direction. Since the Fore-Aft direction is the main vibration direction of the tower, this paper primarily investigates the vibration displacement and strain in the FA direction.
Table 2Modal parameters extracted from the FE model
Mode description | Natural frequency (Hz) | Referenced frequency (Hz) | Modal damping ratio (%) |
First bending mode | 0.2742 | 0.232 | 1.149 |
Second bending mode | 1.9250 | 2.021 | 0.824 |
Third bending mode | 4.1739 | 5.926 | 1.530 |
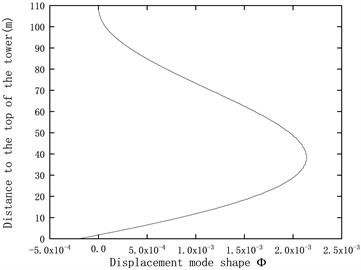
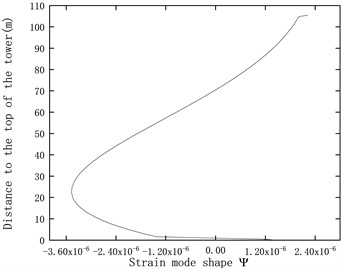
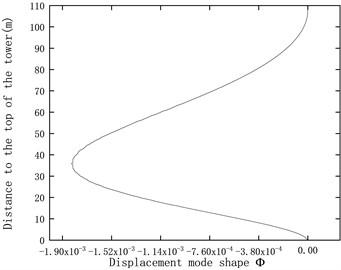
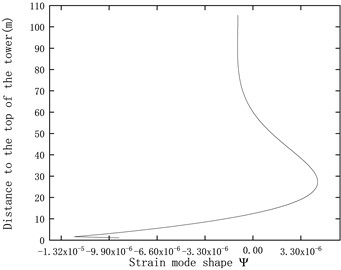
The modal analysis of the three-dimensional tower structure produces contour plots representing the modal vibration shapes as shown in Fig. 2. However, it is difficult to analyze the numerical values of displacement and strain modal variations. Therefore, a reference line is selected along the axis, from the top to the bottom of the tower surface, to analyze the variations of displacement and strain modes along this surface line. Fig. 3 shows the first three displacement modal shapes in the FA direction of the tower, along with the strain modal shapes obtained using Eq. (9). The top of the tower is connected to the nacelle, while the bottom is fixed to the seabed, resulting in stress concentration at the connection points. Therefore, the strain modal shapes at the top and bottom of the tower exhibit partial discontinuities, as shown in Fig. 3.
Fig. 2First three displacement mode shapes

a) 1st bending mode

b) 2nd bending mode

c) 3rd bending mode
4. Prediction of strain response using the modal superposition method
4.1. Methodology for predicting the strain response
Simplifying the tower as a -degree of freedom system, the strain response of the tower under load can be expressed as a linear combination of all strain modes as shown in Eq. (8). In matrix form, the strain can be represented as:
where is the strain vector of points, represents the strain mode matrix, and represents the modal coordinate vector.
Modal coordinates can be obtained from strain measurement points:
where is the number of strain measurement points.
Similarly, according to Eq. (2), modal coordinates can also be obtained from displacement measurement points:
When the number of measured points M is not equal to the number of modal coordinates , the pseudo-inverse matrix needs to be used, Eq. (13) and Eq. (14) can be respectively rewritten as:
By substituting Eq. (15) into Eq. (12), we obtain:
Similarly, by substituting Eq. (16) into Eq. (12), we obtain:
Fig. 3Displacement mode shapes and strain mode shapes
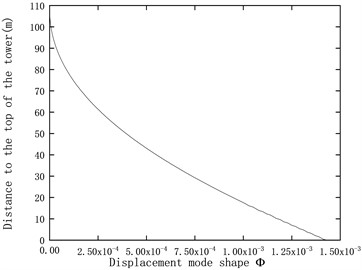
a) First displacement mode shape
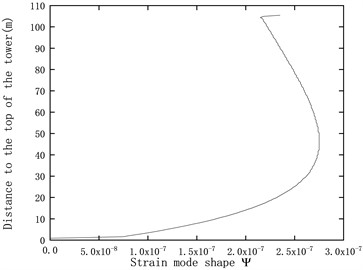
b) First strain mode shape
c) Second displacement mode shape
d) Second strain mode shape
e) Third displacement mode shape
f) Third strain mode shape
4.2. Prediction strain response of free vibration at cut-out wind speed
4.2.1. Displacement and strain of the tower at cut-out wind speed
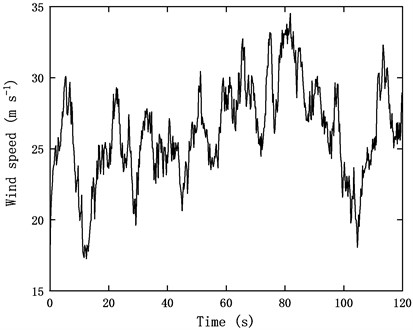
To investigate the displacement and strain of the tower at cut-out wind speed (25 m s-1), GH Bladed wind turbine simulation software was employed to simulate the actual blade load data of wind turbine. Fig. 4 shows the turbulent wind with an average velocity of 25 m s-1 at the wind turbine hub height using the von Karman spectrum in GH Bladed, with a simulation duration of 120 seconds.
Fig. 4Turbulent wind with an average velocity of 25 m s-1
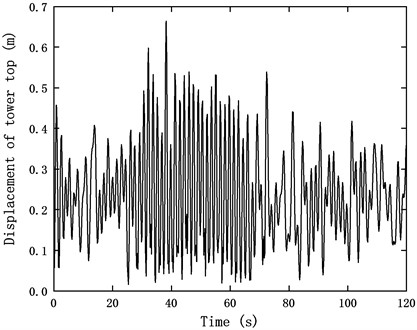
The wind load was imported into the ANSYS transient dynamics module to calculate the displacement and strain of the tower [19]. Fig. 5 demonstrates the maximum displacement of the tower top is 0.657 m at 38.2 s, during which the tower dominating vibration mode is the Fore-Aft (FA) bending.
Fig. 5Displacement of the tower top
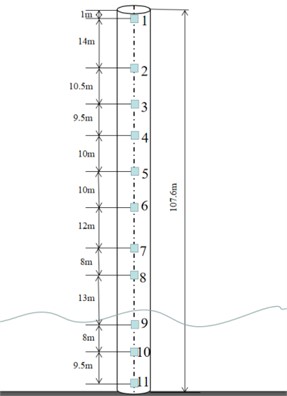
To validate the effectiveness and reliability of the modal superposition method in predicting strain of the tower, eleven test points were selected along the longitudinal direction of the tower from top to bottom. Among these points, the first eight test points are located above the sea surface, while the remaining three test points are situated below the sea surface, as illustrated in Fig. 6. In order to ensure the accuracy of the predicted results, the selected test points should encompass the locations of maximum and minimum amplitudes for each mode of vibration. The initial displacement and initial strain responses of the eleven test points when the tower top reaches its maximum displacement are presented in Table 3.
Table 3The initial displacement and strain responses of the eleven test points
Test point | 1 | 2 | 3 | 4 | 5 | 6 | 7 | 8 | 9 | 10 | 11 |
Initial displacement (m) | 0.64 | 0.48 | 0.37 | 0.28 | 0.21 | 0.14 | 8.24e-2 | 5.19e-2 | 1.85e-2 | 6.54e-3 | 4.49e-4 |
Initial strain () | 59.95 | 104.30 | 131.36 | 138.15 | 136.72 | 130.94 | 122.10 | 115.66 | 104.97 | 97.74 | 97.15 |
Fig. 6Eleven test points along the longitudinal direction of the tower
4.2.2. Prediction strain response of the tower using the modal superposition method
According to Eq. (13) or Eq. (14), it is evident that when we employ the first three modes of the tower to calculate the modal coordinates, a minimum of three test points is sufficient to obtain the modal coordinate values for these three modes. However, due to the small strain magnitudes involved (microstrains) and the difficulty in capturing maximum amplitudes of the mode shapes with only three test points, the resulting strains can be amplified, leading to errors induced by stress concentration and mode truncation. Consequently, significant errors can arise in the calculation of modal strain coordinates. Therefore, we further employed the first eight test points and utilized the least square regression to calculate the modal coordinates. The aim was to compare the results with those obtained using three test points, as presented in Table 4.
Table 4The modal coordinate values obtained using three test points compared with eight test points
Initial value of modal coordinate | Using 3 test points of displacement | Using 3 test points of strain | Using 8 test points of displacement | Using 8 test points of strain |
459.19 | 1049.25 | 459.19 | 451.53 | |
–3.03 | 32.089 | –4.79 | –9.36 | |
1.44 | –5.21 | –0.62 | –4.78 |
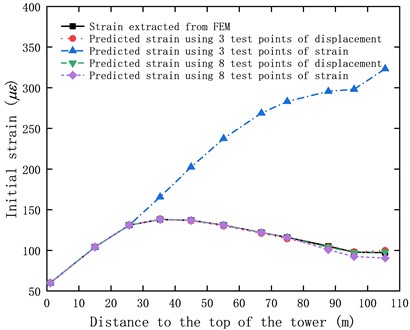
According to Eq. (17) or Eq. (18), the full-field strain can be obtained using the modal superposition method based on either displacement measurements or strain measurements at specific points, as depicted in Fig. 7. From Fig. 7, it is evident that when predicting the full-field initial strain using the modal superposition method, the maximum error in predicting the initial strain is 2.6 % when utilizing three test points of displacement, compared with strain extracted from FEM. However, when using three test points of strain, the maximum error in predicting the initial strain is 232 %. On the other hand, when employing eight test points of displacement, the maximum error in predicting the initial strain is 0.8 %. Similarly, when using eight test points of strain, the maximum error in predicting the initial strain is 7 %.
Using displacement modal coordinate superposition for predicting initial strain values yields higher accuracy compared to using strain modal coordinate superposition, and the error decreases as the number of selected test points increases. The reason is the test points of strain near the top of the tower experienced stress concentration, particularly when the number of test points is limited, resulting in significant prediction errors. On the other hand, the test points of displacement do not exhibit abrupt changes, leading to smaller prediction errors.
Fig. 7Initial strain along the longitudinal direction of the tower
According to Eq. (8) and Eq. (10), the time history of the first three modal coordinates at the 11th test point during the free vibration of the tower, as well as the strain time history obtained using the modal superposition method, are shown in Fig. 8. From Fig. 8, it is evident that during the free vibration of the tower, the decay rate is primarily determined by the first mode, while the modal coordinates of the second and third modes decay relatively faster over time.
Fig. 8Time history of the modal coordinates and predicted strain
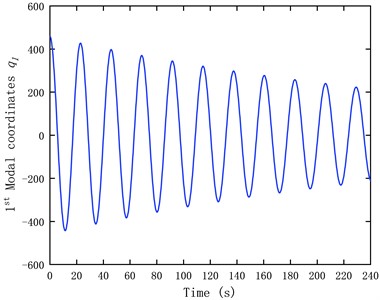
a) Time history of the first modal coordinate
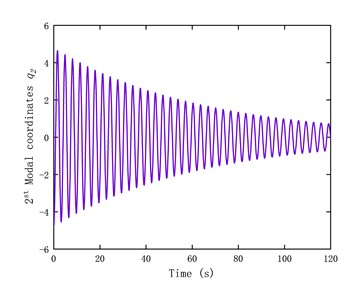
b) Time history of the second modal coordinate
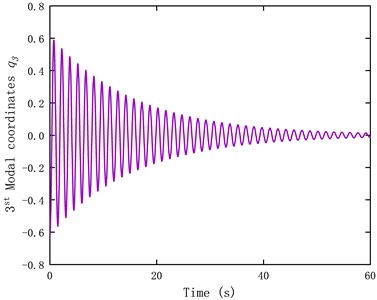
c) Time history of the third modal coordinate
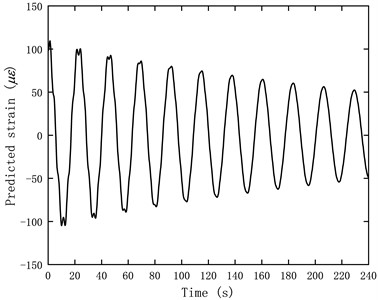
d) Predicted strain using the modal superposition method
5. Conclusions
This study theoretically analyzed the feasibility of using modal superposition method to predict strain of the wind turbine tower. Theoretically modal coordinate values can be calculated using either test points of displacement and displacement mode shapes, or test points of strain and strain mode shapes. The research findings revealed that using test points of displacement and corresponding mode shapes yielded higher accuracy in predicting strain, while using test points of strain and corresponding strain mode shapes resulted in larger prediction errors. The reason is the displacement mode shapes are continuous, while strain mode shapes undergo discontinuities at the top of the tower due to stress concentration, leading to amplified errors in strain calculations when test points contain discontinuity locations. Furthermore, considering that strain is a small quantity, using an appropriate number of test points at suitable locations and employing the least square regression for simulation can effectively reduce strain prediction errors. The strain time history of the tower under free vibration is obtained using modal superposition method, allowing for a better understanding of its strain behavior. These findings contribute to the development of accurate strain prediction techniques for wind turbine tower structure.
References
-
A. Iliopoulos, W. Weijtjens, D. Van Hemelrijck, and C. Devriendt, “Fatigue assessment of offshore wind turbines on monopile foundations using multi‐band modal expansion,” Wind Energy, Vol. 20, No. 8, pp. 1463–1479, Mar. 2017, https://doi.org/10.1002/we.2104
-
Q. A. Mai, W. Weijtjens, C. Devriendt, P. G. Morato, P. Rigo, and J. D. Sørensen, “Prediction of remaining fatigue life of welded joints in wind turbine support structures considering strain measurement and a joint distribution of oceanographic data,” Marine Structures, Vol. 66, No. 5, pp. 307–322, Jul. 2019, https://doi.org/10.1016/j.marstruc.2019.05.002
-
H.-J. Bang, H.-I. Kim, and K.-S. Lee, “Measurement of strain and bending deflection of a wind turbine tower using arrayed FBG sensors,” International Journal of Precision Engineering and Manufacturing, Vol. 13, No. 12, pp. 2121–2126, Nov. 2012, https://doi.org/10.1007/s12541-012-0281-2
-
R. Brincker, A. Skafte, M. López-Aenlle, A. Sestieri, W. D. ’Ambrogio, and A. Canteli, “A local correspondence principle for mode shapes in structural dynamics,” Mechanical Systems and Signal Processing, Vol. 45, No. 1, pp. 91–104, Mar. 2014, https://doi.org/10.1016/j.ymssp.2013.10.025
-
K. Erazo and E. M. Hernandez, “A model-based observer for state and stress estimation in structural and mechanical systems: Experimental validation,” Mechanical Systems and Signal Processing, Vol. 43, No. 1-2, pp. 141–152, Feb. 2014, https://doi.org/10.1016/j.ymssp.2013.10.011
-
A. Hu, J. Zhao, and L. Xiang, “Output-only modal analysis of wind turbine tower based on vibration response under emergency stop,” ISA Transactions, Vol. 80, pp. 411–426, Sep. 2018, https://doi.org/10.1016/j.isatra.2018.07.035
-
M. Henkel, J. Häfele, W. Weijtjens, C. Devriendt, C. G. Gebhardt, and R. Rolfes, “Strain estimation for offshore wind turbines with jacket substructures using dual-band modal expansion,” Marine Structures, Vol. 71, p. 102731, May 2020, https://doi.org/10.1016/j.marstruc.2020.102731
-
J. Kullaa, “Virtual sensing of structural vibrations using dynamic substructuring,” Mechanical Systems and Signal Processing, Vol. 79, pp. 203–224, Oct. 2016, https://doi.org/10.1016/j.ymssp.2016.02.045
-
K. Maes, A. Iliopoulos, W. Weijtjens, C. Devriendt, and G. Lombaert, “Dynamic strain estimation for fatigue assessment of an offshore monopile wind turbine using filtering and modal expansion algorithms,” Mechanical Systems and Signal Processing, Vol. 76-77, No. 1, pp. 592–611, Aug. 2016, https://doi.org/10.1016/j.ymssp.2016.01.004
-
C. O. Mendonça, R. H. Gutiérrez, and U. A. Monteiro, “Prediction of dynamic responses in a rectangular beam using the modal expansion method,” Marine Systems and Ocean Technology, Vol. 16, No. 1, pp. 29–42, Feb. 2021, https://doi.org/10.1007/s40868-020-00091-3
-
A. Skafte, J. Kristoffersen, J. Vestermark, U. T. Tygesen, and R. Brincker, “Experimental study of strain prediction on wave induced structures using modal decomposition and quasi static Ritz vectors,” Engineering Structures, Vol. 136, No. 1, pp. 261–276, Apr. 2017, https://doi.org/10.1016/j.engstruct.2017.01.014
-
M. Tarpø, B. Nabuco, C. Georgakis, and R. Brincker, “Expansion of experimental mode shape from operational modal analysis and virtual sensing for fatigue analysis using the modal expansion method,” International Journal of Fatigue, Vol. 130, p. 105280, Jan. 2020, https://doi.org/10.1016/j.ijfatigue.2019.105280
-
M. Tarpø, T. Friis, C. Georgakis, and R. Brincker, “Full-field strain estimation of subsystems within time-varying and nonlinear systems using modal expansion,” Mechanical Systems and Signal Processing, Vol. 153, p. 107505, May 2021, https://doi.org/10.1016/j.ymssp.2020.107505
-
M. Attar, “A transfer matrix method for free vibration analysis and crack identification of stepped beams with multiple edge cracks and different boundary conditions,” International Journal of Mechanical Sciences, Vol. 57, No. 1, pp. 19–33, Apr. 2012, https://doi.org/10.1016/j.ijmecsci.2012.01.010
-
M. Chierichetti, C. Grappasonni, G. Coppotelli, and C. Mccoll, “A modal approach for dynamic response monitoring from experimental data,” Mechanical Systems and Signal Processing, Vol. 48, No. 1-2, pp. 199–217, Oct. 2014, https://doi.org/10.1016/j.ymssp.2014.04.003
-
H. Zuo, K. Bi, and H. Hao, “Mitigation of tower and out-of-plane blade vibrations of offshore monopile wind turbines by using multiple tuned mass dampers,” Structure and Infrastructure Engineering, Vol. 15, No. 2, pp. 269–284, Jan. 2019, https://doi.org/10.1080/15732479.2018.1550096
-
R. L. Ma, Y. Q. Ma, H. Q. Liu, and J. L. Chen, “Ambient vibration test and numerical simulation for modes of wind turbine towers,” (in Chinese), Journal of Vibration and Shock, Vol. 30, No. 5, pp. 152–155, 2011, https://doi.org/10.13465/j.cnki.jvs.2011.05.054
-
H. Zuo, K. Bi, and H. Hao, “Using multiple tuned mass dampers to control offshore wind turbine vibrations under multiple hazards,” Engineering Structures, Vol. 141, No. 15, pp. 303–315, Jun. 2017, https://doi.org/10.1016/j.engstruct.2017.03.006
-
Z. H. Zhang, Y. Zhou, and G. P. Zhu, “Failure modes of large-scale wind power structure subjected to typhoon, Journal of Vibration and shock,” (in Chinese), Journal of Vibration and Shock, Vol. 33, No. 14, pp. 143–148, 2014, https://doi.org/10.13465/j.cnki.jvs.2014.14.025
About this article

The authors have not disclosed any funding.
The datasets generated during and/or analyzed during the current study are available from the corresponding author on reasonable request.
Zerong Zhang conceived the original ideas and revised the paper. Wei Zhang carried out the simulation analysis and wrote the original draft. Shiqiang Zhang carried out dynamic analysis.
The authors declare that they have no conflict of interest.
