Abstract
In order to improve the strength and stiffness characteristics of truck carriage, a structural optimization scheme based on modal analysis was proposed, which could enhance the comprehensive mechanical performance while reducing weight. Based on finite element simulation, the natural frequencies and modal shapes of the carriage were obtained. Under braking conditions, piezoelectric accelerometer was used to capture vibration data of the suspension system, which also verified the accuracy of natural frequency calculation. Through sensitivity analysis, four dimensions of the side reinforcement were selected as design variables. The approximate model of the optimization objective was constructed using an approximation method, and multi-objective genetic algorithm was used to solve the design variables. The results show that the optimized structure can decrease the mass by 2.3 %, decrease the maximum stress by 10.9 %, and increase the first-order natural frequency by 23.4 %.
Highlights
- A structural optimization scheme based on modal analysis was proposed, which could enhance the comprehensive mechanical performance while reducing weight.
- Based on finite element simulation, the natural frequencies and modal shapes of the carriage were obtained.
- Under braking conditions, piezoelectric accelerometer was used to capture vibration data of the suspension system, which also verified the accuracy of natural frequency calculation.
1. Introduction
Due to factors such as uneven road surfaces, unbalanced wheels, and engine power transmission, freight vehicles, especially long-distance truck, are prone to strong vibrations and impacts during operation [1, 2]. These load responses not only affect the safety of the cargo, but may also exacerbate fatigue damage to the vehicle's load-bearing components. Under complex and changing road conditions, the vibration response of the truck compartment is also an important indicator for evaluating the overall performance of the vehicle. Modal characteristics are one of the manifestations of structural vibration. Vibration parameters can be obtained through experiments, and the natural frequencies and modal shapes of structures can also be studied through finite element methods. [3, 4] With the rapid development of computer-aided analysis technology, digital design has provided new means for the research and development of vehicle vibration and damping [5, 6]. By using a reasonable simulation analysis scheme, modal analysis of the mechanical structure of the truck carriage compartment can be carried out to predict the vibration response effect under different conditions, and it serves as an important basis for improving the overall smoothness of the vehicle. Based on the modal characteristics of freight vehicles, an effective lightweight design scheme can be proposed, which significantly reduces weight without reducing stiffness and strength. Traditional freight cars use a large number of cast iron reinforcement ribs, which makes the quality of the car too high. Research on structural optimization can save material usage, improve material utilization, reduce carbon monoxide emissions, and enhance vehicle braking and operability.
2. Analysis of dynamic response
2.1. Establishment of dynamic model
The fundamental principle of finite element model simplification is to achieve a harmonious balance between the accuracy of the model and computational efficiency, while striving to closely replicate the characteristics of the actual structure. Based on SolidWorks software, simplify the carriage model of the truck appropriately. Delete parts that have no impact on the analysis of working conditions and are ignored in terms of quality, such as lifting rings, hole pins, bolts, mudguards, and other small parts. For non load bearing but heavy components, simplify them and analyze them separately as their own weight. The structures such as bolt holes, installation holes, and pins can easily cause poor quality of the divided grid. Therefore, before dividing the grid, the holes need to be removed and replaced with flat surfaces. Ensure that the model is complete and all required components have been correctly assembled. In order to better analyze the dynamic response results, the carriage of the truck is first subjected to modal analysis. As shown in Fig. 1, the model of the carriage was constructed. The common finite element models are mainly established by shell elements, beam elements, and mixed elements. The connection between the panels of the carriage is mainly welding, so the finite element model of the carriage is modeled using shell elements. The finite element model established by shell elements has higher quality and more accurate data, but for the calculation of more complex models of carriages, it requires longer time and higher computer configuration. Separate the grid division of each component of the carriage for later quality inspection and re division of the grid. Use a basic size of 10 mm to mesh the model, and then gradually refine it according to the structural characteristics. Welding requires measurement welding, otherwise it may increase the computational complexity of simulation and result in inaccurate data convergence during the simulation process. Therefore, in the solver, weld element detection is performed on each panel of the carriage. Perform finite element model inspection of the carriage through the Model Checker under the Tool panel, mainly checking whether the materials in the 2D mesh have been added, whether the loads and constraints have been added, whether the welding dimensions meet the standards, and whether the loading step sequence is correct. The quality index under the 2D panel can improve the quality of the finite element mesh by moving nodes, reconstructing the mesh, and redefining the mesh quality.
Fig. 1The 3D model of the carriage

a) Initial model
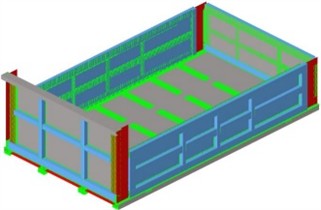
b) The simplified model
2.2. Modal analysis
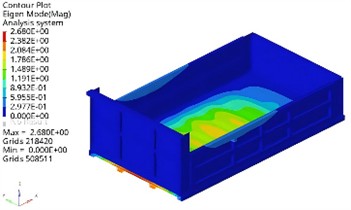
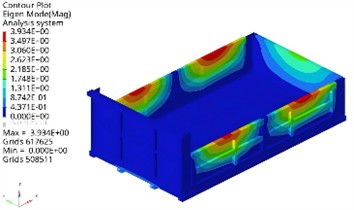
In Hyperwoks, the carriage is subjected to free mode analysis. Free mode refers to the absence of forces and constraints, only defining material properties, modal parameters, etc. Extract the first four modes of the carriage and obtain the analysis results of the modal shapes as shown in Fig. 2.
The first-order vibration is mainly concentrated on the left and right plates, resulting in bending vibration. The second order vibration mainly occurs at the front and rear ends of the base plate, resulting in front and rear vibrations. The third order vibration mainly occurs on the bottom plate, which vibrates up and down. The fourth order vibration of the carriage mainly occurs on both sides of the top. The road excitation frequency refers to the vibration frequency caused by uneven road surfaces during vehicle operation. This frequency range is mainly determined by the vehicle speed and the wavelength of the road texture. For example, for the common vehicle speed (about 80 km/h) and road texture wavelength, most of the vibration energy will be below 30 Hz. According to the modal analysis, the first-order natural frequency of the carriage is 22.39 Hz, within the effective excitation range of the road. Therefore, the structural vibration response caused by road random excitation is very important.
Fig. 2Results of the first four modal shapes
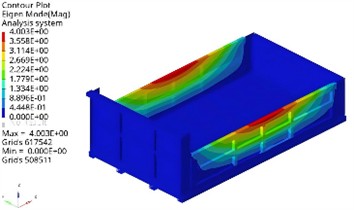
a) The first order (22.39 Hz)
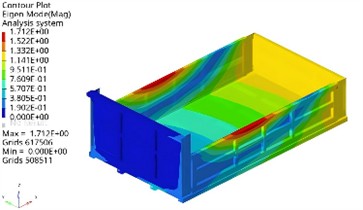
b) The second order (49.74 Hz)
c) The third order (75.51 Hz)
d) The fourth order (102.27 Hz)
2.3. Testing of vibration response
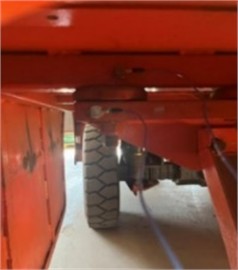
In order to obtain the influence of braking conditions on the vibration of the truck carriage, a piezoelectric accelerometer is used to capture the vibration data of the carriage suspension system. This sensor is widely used in industrial vibration testing due to its light weight, small size, wide frequency response range, and large dynamic range. This sensor can accurately obtain the vibration acceleration of the suspension system and calculate the vibration velocity and displacement through integration. The data acquisition point of the vibration sensor is installed on the left front suspension of the cabin, as shown in Fig. 3. This arrangement can comprehensively monitor the vibration of the suspension system at different positions, including the vibration transmitted from the vibration source to the cabin and the vibration response of the cabin itself. By comparing and analyzing the vibration data of the active and passive ends, we can gain a deeper understanding of the isolation effect, vibration transmission path, and potential resonance points of the suspension system, thereby providing support for the optimization design and troubleshooting of the suspension system.
Fig. 3Vibration testing plan

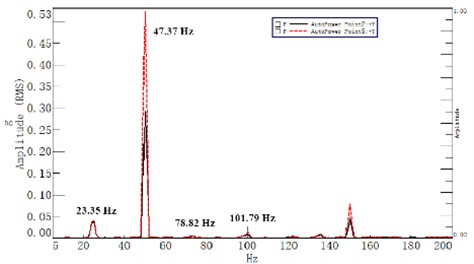
The test results are shown in Fig. 4. It can be seen that the maximum amplitude corresponds to the excitation frequency that matches the natural frequency, which also proves the accuracy and reliability of the simulation results. The maximum discrepancy between the computed and experimental values of the first four natural frequencies is less than 5 %. In addition, the study also found that as the acceleration gradually increases, the peak value affected by vibration shows a continuous upward trend. The reason for this phenomenon is that as the acceleration increases, the system's vibration response becomes more complex and sensitive. Due to the increase in acceleration, vibration energy gradually accumulates and triggers stronger vibration responses at various cross-sections, resulting in a gradual increase in the peak impact. At the same time, the increase in acceleration also makes the dynamic behavior of the system tend to be smoother to a certain extent, which is reflected in the numerical curve as a smoother feature. The manifestation of this trend illustrates the complexity of vibration and the changes in overall dynamic response under different acceleration conditions.
Fig. 4Frequency domain of vibration amplitude
3. Optimization and analysis of mechanical structure
3.1. Selection of design variables
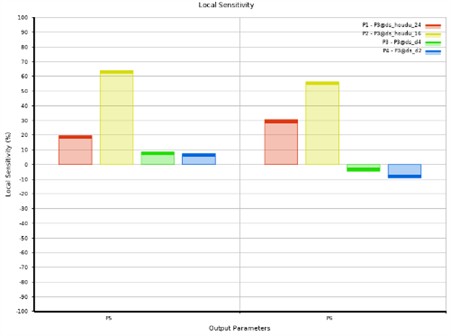
Due to the fact that only the thickness and material properties of the panels were defined during the construction of the finite element model of the truck carriage, and the width was not defined, no design variable selection was made for the width. The selection of design variables for the carriage depends on the existing design variables in the comprehensive model of the carriage, including the thickness of each panel, the thickness of the main longitudinal beam of the floor, the thickness of the floor longitudinal beam, and the thickness of the crossbeam. It is necessary to fix the properties of materials to prevent deviations in simulation data caused by changes in material properties. In the optimization process of the comprehensive model of the carriage, the design variables are variable, so the range of the design variables needs to be set according to the needs. Optimization design often involves a large number of design variables. If the optimization design of the carriage is based on simulation data, it will lead to problems such as excessive computation, slow convergence speed, and even incorrect result output. The definition of the design variable of side reinforcement ribs is shown in Fig. 5. Through the analysis of relative sensitivity as shown in Fig. 6, four design variables that have the most significant impact on the optimization objective can be identified. By using approximate modeling methods and fitting the relationship between design variables and output responses with a small amount of sample point information, complex simulation calculations can be replaced to shorten the design cycle and reduce the cost of optimization design.
Fig. 5Definition of the design variable
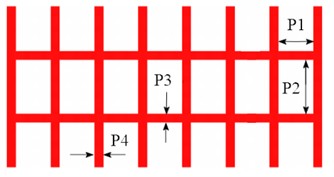
Fig. 6Sensitivity of the design variable
3.2. Validation of approximate model
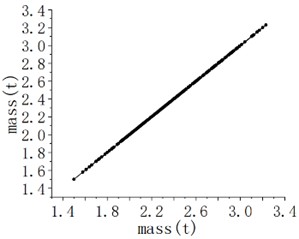
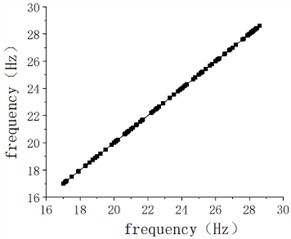
When constructing an approximate model, if only the approximate method is selected and the parameters, regression model type, weighting function, etc. of the approximate model fitting are ignored, it will to some extent reduce the accuracy of the constructed model. Therefore, it is necessary to improve the accuracy of the comprehensive model of the carriage by changing the fitting parameters, regression model types, weighting functions, etc. Based on the approximate model RBF method, changes are made to the approximate fitting parameters of the carriage to improve the accuracy of the approximate model. The scatter plot is used to reflect the actual and simulated situation of the finite element model, that is, the closer the majority of random sample points are to the function, the higher the fitting accuracy of the model. The scatter plot of quality and natural frequency is shown in Fig. 7, indicating that the applied approximate model has high accuracy. Traditional manufacturing often believes that the heavier the better, and the more reinforcing ribs the better. This concept leads to an increasing weight and also results in a single objective optimization when optimizing design, which is not conducive to the principle of optimal design. In addition, optimization design with a single objective often leads to issues with the lifespan of the carriage due to insufficient stiffness. Therefore, while ensuring rigidity and strength, the mass of the carriage should be minimized as much as possible.
Fig. 7Validation of fitting results under different design variables
a) Verification of mass
b) Verification of frequency
3.3. Analysis and discussion of optimization results
Multi objective genetic algorithm is applied in solving the optimization objectives of train carriages, which can perform parallel operations on a series of problems such as optimization objectives and constraints. The entire process requires many iterations until the optimal solution is converged. When applied to multi-objective optimization, multi-objective genetic algorithm differs from other optimization methods in that it searches for a collective solution from the objectives that need to be optimized, rather than a single solution. This feature allows the optimization objective to find the optimal solution during the overall iteration process, rather than obtaining a local optimal solution. In the calculation process of multi-objective genetic algorithm, random calculation is carried out through selection, crossover, and mutation, which can exclude a large number of individuals with significant differences from the optimal solution and has a large tolerance ability. Simultaneously obtaining a large number of individuals that are close to the optimal solution, covering the characteristics of global optimization, but the computational complexity is relatively high due to random calculations. Calculating based on approximate models can save a lot of computation time, so the disadvantage of large computational complexity in multi-objective genetic algorithms can be ignored. The main computational concept of multi-objective genetic algorithm is to transform multi-objective into single objective for calculation, and solve multi-objective genetic algorithm based on weights.
By optimizing calculations, the comparison results before and after lightweighting can be obtained as shown in Table 1, and the corresponding vibration modes and stress cloud maps can be obtained as shown in Fig. 8. It can be seen that after optimization, the mass decreased by 2.3 %, the maximum stress decreased by 10.9 %, and the first-order natural frequency increased by 23.4 %. On the premise of reducing weight, both strength and stiffness have been improved to some extent.
Table 1Comparison of optimization results
P1 / mm | P2 / mm | P3 / mm | P4 / mm | Mass / kg | Maximum stress / MPa | 1st nature frequency / Hz | |
Initial value | 552 | 626 | 54 | 62 | 2464 | 226.3 | 22.39 |
Optimal value | 501 | 639 | 41 | 57 | 2407 | 201.6 | 27.64 |
Fig. 8The verification of the optimized results
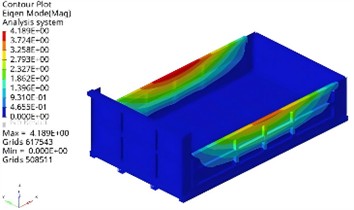
a) The first order modal shape
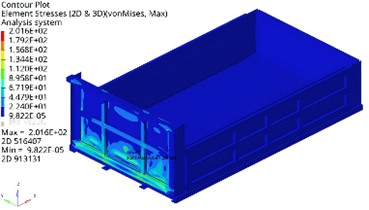
b) Stress distribution
4. Conclusions
1) Due to the high requirements for the dynamic performance of the truck carriage, the rational design of the structure cannot be separated from modal analysis. The structural vibration obtained from modal analysis can well reflect the dynamic performance. According to the requirements of the idle excitation frequency characteristics of the engine, the obtained first-order free frequency of the cabin is used as one of the constraints for optimizing the cabin. The results show that the optimized carriage not only reduces mass, but also significantly improves strength and stiffness.
2) In the optimization simulation of intensity, theoretically, the more working conditions are involved, the more accurate the data will be. However, the increase in the working conditions of the truck carriage brings about an increasingly complex comprehensive model, which will result in excessive cross calculation during optimization and overall difficulty in convergence, leading to the consumption of a large amount of computation time and high computational costs. Therefore, the optimization effect is mainly compared and analyzed using the braking condition as an example.
References
-
Q. Lin, C. Yang, Y. Bai, and J. Qin, “Structural strength analysis and optimization of commercial aircraft nose landing gear under towing taxi-out conditions using finite element simulation and modal testing,” Aerospace, Vol. 11, No. 5, p. 414, May 2024, https://doi.org/10.3390/aerospace11050414
-
Z. G. Wang, “Structural optimization and modal analysis of belt conveyor driving drum,” Journal of Engineering Mechanics and Machinery, Vol. 9, No. 1, pp. 74–88, Jan. 2024, https://doi.org/10.23977/jemm.2024.090113
-
M. Filippoupolitis and C. Hopkins, “Experimental validation of finite element models representing stacked concrete beams with unbonded surface contacts,” Engineering Structures, Vol. 227, No. 2, p. 111421, Jan. 2021, https://doi.org/10.1016/j.engstruct.2020.111421
-
A. Daşdemir, “A modal analysis of forced vibration of a piezoelectric plate with initial stress by the finite-element simulation,” Mechanics of Composite Materials, Vol. 58, No. 1, pp. 69–80, Mar. 2022, https://doi.org/10.1007/s11029-022-10012-7
-
R. Talebitooti, M. Zarastvand, and H. Darvishgohari, “Multi-objective optimization approach on diffuse sound transmission through poroelastic composite sandwich structure,” Journal of Sandwich Structures and Materials, Vol. 23, No. 4, pp. 1221–1252, Jun. 2019, https://doi.org/10.1177/1099636219854748
-
I. Aarab, K. E. Amari, A. Yaacoubi, A. Etahiri, and A. Baçaoui, “Optimization of the flotation of low-grade phosphate ore using doe: a comparative evaluation of fatty acid formulation to sodium oleate,” Mining, Metallurgy and Exploration, Vol. 40, No. 1, pp. 95–108, Dec. 2022, https://doi.org/10.1007/s42461-022-00706-w
About this article
The authors have not disclosed any funding.
The datasets generated during and/or analyzed during the current study are available from the corresponding author on reasonable request.
The authors declare that they have no conflict of interest.
