Abstract
The oil pipeline is a critical component that influences the vibration and noise levels of the hydraulic system. Inadequate design may result in resonance or leakage issues, rendering it susceptible to external vibration excitation. To enhance the reliability of the hydraulic pipeline, simulations and analyses were conducted on its modal, harmonic response, and fatigue characteristics. Based on the results of harmonic response analysis and strength analysis, an effective reinforcement scheme was proposed and validated. By inputting the acceleration load to the pipeline system for frequency response analysis, the influence of different excitation forces on the pipeline stress can be determined. The findings indicate that pipeline vibration primarily occurs in the outlet pipe of the transmission, with significant stress and vibration displacement observed at the thermostat valve support. Following structural improvements, there was a notable reduction in stress levels at the transmission outlet pipe, along with a shift in maximum stress position due to additional support. This enhancement has improved both structural stiffness of the outlet pipe and overall stability of the pipeline system.
Highlights
- To enhance the reliability of the hydraulic pipeline, simulations and analyses were conducted on its modal, harmonic response, and fatigue characteristics.
- Based on the results of harmonic response analysis and strength analysis, an effective reinforcement scheme was proposed and validated.
- By inputting the acceleration load to the pipeline system for frequency response analysis, the influence of different excitation forces on the pipeline stress can be determined.
1. Introduction
In hydraulic system, transmission fluid will flow through the oil cooling pipe to the oil cooler for heat dissipation, so the oil cooling pipe is a key component of the transmission cooling system. While transmitting power through the transmission, vibration excitation will also be transmitted, leading to long-term vibrations that cause fatigue and loosening of the oil cooling pipe under alternating loads, even causing leaks of transmission fluid within the pipe [1, 2]. The long-term vibration of the transmission oil cooling pipe induces stress concentration at critical points under alternating loads, leading to fatigue cracks or even rupture, ultimately resulting in transmission oil leakage [3]. Therefore, it is imperative to investigate the fundamental vibration characteristics of the hydraulic pipe system, especially the modal characteristics [4, 5]. Employing finite element method simulation to analyze structural vibration phenomena has become an indispensable approach in the process of structural design [6]. Consequently, conducting dynamic characteristic analysis of the oil cooling pipe system is essential for identifying potential failure locations and ensuring system reliability through subsequent structural enhancements. In order to reduce costs while ensuring product quality, product design and development personnel need to conduct systematic research on the vibration and stress of hydraulic tubing. However, repeated production testing of tubing samples not only consumes time and effort, but also increases research and development costs. Therefore, it is crucial to adopt CAE simulation to preliminarily analyze the tubing system in order to reduce waste of human and material resources. CAE simulation analysis can not only predict the possible design defects of the product in advance, reduce the cost of repeatedly adjusting and improving the specimen, but also enhance the reliability of the structure design, avoid the potential design loopholes, so as to improve the efficiency of product research and development.
2. Modal simulation and analysis
2.1. Model building and simplification
There will be some complex characteristics in the modeling of parts, these characteristics will make the simulation calculation convergence slower, longer running time, resulting in large error results. Therefore, before the finite element simulation based on ANSYS Workbench, it is usually necessary to simplify the complex feature structure in the original model according to the actual situation to avoid the phenomenon of too long calculation time. In the finite element mesh generation, the more complex the model is, the more difficult the mesh generation is. In order to segment high-quality meshes smoothly, it is necessary to remove small structural features, such as chamfering and small holes, which have little impact on the accuracy of analysis results, but greatly speed up the speed of mesh generation and improve the quality of mesh generation. The bolts and rubber rings at the inlet and outlet of the pipe can be simplified to cylindrical shapes while removing features such as unnecessary rounding and chamfering in the structure. The simplified overall 3D model is shown in Fig. 1.
The equivalent mass method is utilized for calculating the vibration characteristics of the pipeline. When considering the transmission oil inside the pipeline, this method simplifies it by disregarding the fluid-structure coupling characteristics between the oil and the outer aluminum tube. Instead, it treats the mass of the transmission oil as equivalent to that of both the inner wall of the aluminum tube and rubber tube. The simulation results obtained through this approach are more accurate due to these considerations. Additionally, an equivalent density is employed in place of the density of the aluminum pipe and hose itself to account for how medium influences added mass and stiffness in pipes.
Fig. 1Structure and modeling of hydraulic pipeline
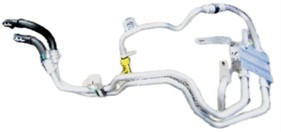
a) Physical structure
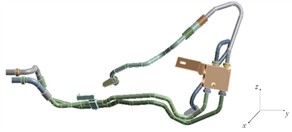
b) 3D model
2.2. Preprocessing of the model
Meshing is a very critical step in finite element analysis. Generally speaking, the smaller the element size is, the more accurate the simulation results will be. However, when the element size reaches a certain level, the accuracy of the computation does not continue to improve with the decrease of the element size, and the finer the mesh is, the slower the operation is. Meshing methods mainly include: automatic meshing, tetrahedral/triangle, hexahedral, sweeping, multi-region meshing, etc. Hexahedral partition has the advantages of high precision, small number of elements and small memory occupancy. It is usually used to partition the geometric model with regular shape. But for the geometry with complex model structure, it is often necessary to use the mesh partition method based on tetrahedron and hexahedron to accelerate the calculation speed. In the mesh division, it can be divided by gradually reducing the mesh size and increasing the number of grids. As shown in Fig. 2, the bolts, rubber rings, temperature control valves and pressure plates are divided by hexahedron and tetrahedron. The overall grid size is set to 2 mm, and the local division is 1 mm.
After mesh division, mesh Quality needs to be checked. Element Quality and Skewness metrics are selected as inspection methods, and the mesh quality is 0.831, which is greater than the minimum mesh quality of 0.7 required by finite element mesh division. The skew coefficient is 0.253, which is close to the standard value of 0. Therefore, this division method meets the accuracy calculation requirements. In the cooling system, one end of the oil cooling pipeline is connected with the gearbox and the other end is connected with the oil cooler. Therefore, according to the actual installation position of the automobile oil cooling pipeline, fixed constraints are imposed on the support and pressure plate of the pipeline system, and because the stiffness of the connecting parts at both ends of the aluminum pipe is very large, the full degree of freedom constraints are carried out on the two end faces of the pipeline, as shown in Fig. 3.
Fig. 2The result of finite element mesh division

Fig. 3Fixed constraint positions

2.3. Modal results
The modal analysis includes both free and constrained modes. Among them, the free mode is generally suitable for the case where the structure is complex and the boundary conditions cannot be clearly defined. In addition, the calculation results of the free mode are usually close to 0 Hz in the first sixth order frequency, which has no practical significance and can be ignored. Therefore, considering the actual situation, the constrained mode is used in this paper. The modal analysis results of the first six orders are shown in Fig. 4. It can be seen that the first three orders of mode shapes of the oil-cooled pipe system are mainly reflected by the swing of the rubber tube. This is because rubber is a flexible material with a small elastic modulus and its stiffness is much smaller than that of the aluminum tube connected to it. At the same time, the last three stages are mainly reflected in the vibration of the transmission oil pipe. The natural frequency of the pipeline system is within the range of the motor excitation frequency, which indicates that the vibration frequency and the motor working frequency may coincide during the working process of the hydraulic system, resulting in resonance phenomenon. Therefore, it is necessary to further conduct the harmonic response vibration fatigue analysis of the pipeline to determine the cause of the pipeline failure.
3. Harmonic response analysis
3.1. Setting of external incentives
During the operation of the hydraulic system, the excitation signal generated by the motor is mainly a sinusoidal signal. The external excitation signal received by the oil cooling pipe mainly comes from the motor, and the sinusoidal signal is transmitted to the oil cooling pipe through the gearbox. The frequency response analysis of the pipe system is carried out by inputting the acceleration load, so as to determine the influence of the excitation signal on the pipe stress. In the hydraulic pipe assembly, there is damping, so the simulation setting analysis also needs to be set up with damping to adjust the amplitude of the structure’s resonance when it occurs, making the frequency response curve smoother. If the damping coefficient is set to 0, the peak value of the frequency response curve will be infinitely large, which is obviously different from the actual situation. The damping ratio of the structure is usually set within the range of 0.01 to 0.1. It can be concluded from the analysis that the magnitude of the maximum stress and displacement will decrease as the damping increases. So the damping ratios of 0.01 is selected to analyze.
Fig. 4Results of the first six modal shapes
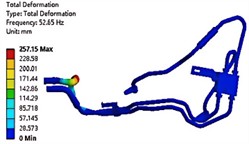
a) The first-order modal shape
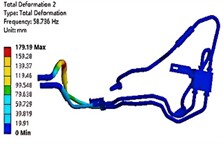
b) The second- order modal shape
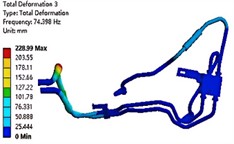
c) The third-order modal shape
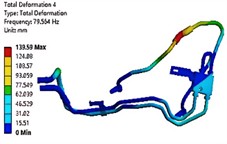
d) The fourth-order modal shape
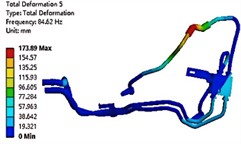
e) The fifth-order modal shape
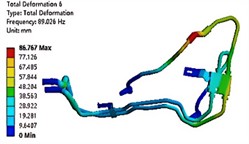
f) The sixth-order modal shape
3.2. Results of harmonic response analysis
The modal superposition method was used to conduct harmonic response analysis of the pipe system, with the results of modal analysis being input into the harmonic response analysis. A linear sweep method was used to apply sinusoidal loads along the , , and directions within the vibration frequency range of 20-1000 Hz. The modal analysis showed that the vibration mode of the oil outlet pipe of the transmission changed significantly, so the surface of the oil outlet pipe was chosen as the research object. Only linear behavior was effective in both modal analysis and harmonic response analysis, so the stress values obtained through harmonic response analysis were not equivalent to the actual stress in the structure. The harmonic response analysis results under the basic load of 1 g acceleration are shown in Fig. 5. Due to the fact that the harmonic response displacement in the and directions is extremely small, the harmonic response displacement in the direction was taken as the analysis target. It can be seen that the stress value and displacement value of the oil cooling pipe at the oil outlet of the transmission are maximum at the frequency of 85.333 Hz, with the maximum stress value of 20.173 MPa and the maximum displacement value of 0.211 mm.
Fig. 5The harmonic response analysis results under 1 g acceleration
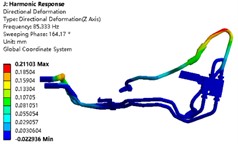
a) Displacement contour map
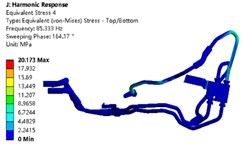
b) Stress contour map
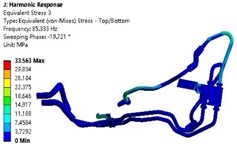
The harmonic response analysis results under the limit design load of 4 g acceleration are shown in Fig. 6. It can be seen that the aluminum pipe and rubber pipe at the oil outlet of the transmission are the main locations of stress and displacement in the oil cooling pipe system. The stress value on the surface of the aluminum pipe is 33.563 MPa, which is lower than the yield limit value of 65 MPa of the aluminum pipe material, indicating that the pipe system is less likely to fail under static load. However, the pipes may fail due to fatigue under long-term repeated vibration and impact, so fatigue life analysis is needed.
Fig. 6The harmonic response analysis results under 4 g acceleration
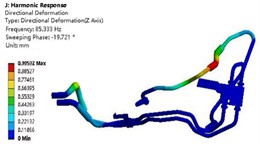
a) Displacement contour map
b) Stress contour map
3.3. Fatigue analysis
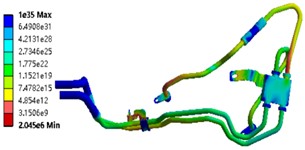
The failure of the hydraulic pipeline under cyclic loading is attributed to high-cycle fatigue. To conduct a fatigue failure analysis, it is essential to obtain the S-N curve for the material. The S-N curve represents the relationship between alternating stress and number of cycles under specific cyclic conditions, commonly known as a stress-life curve and often displayed in logarithmic form. When the external stress does not reach the maximum stress that the component can bear, the structure will fail due to fatigue. This failure is caused by the repeated action of alternating external stress. After performing harmonic response analysis on the pipe system, a maximum acceleration load of 4 g was applied, and the fatigue life S-N curve of aluminum pipe was used in combination with the Fatigue tool to calculate the cloud diagram of the number of fatigue life cycles corresponding to continuous vibration in the z direction for 10 million times, as shown in Fig. 7. After continuous vibration for 14 hours, the lowest service life of the connection between the aluminum pipe and the temperature control valve in the pipe system was 2.21e6. The design life of the pipe system is 1e7, so the ratio of design life to service life, i.e. the damage value, is greater than 1. According to the linear cumulative damage theory, when the degree of damage accumulates to 1, the pipe will fail and break.
Fig. 7Results of fatigue life analysis
3.4. Strengthening of structures
According to the modal harmonic response analysis results, the stress and vibration displacement of the thermostat valve support and the oil outlet pipe are relatively large. Therefore, it is proposed to add a fixed support between the thermostat valve and the outlet pipe of the transmission oil cooling pipe. The oil cooling pipe route in the vehicle is improved and the outlet pipe route is changed as shown in Fig. 8.
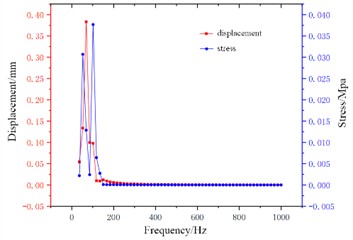
Before and after the improvement, the length of the rubber hose remains unchanged, and the aluminum tube is shortened from the original 313 mm to 154 mm. The total length of the oil outlet pipe is greatly reduced. The frequency response results of the oil outlet pipe path in the direction are shown in Fig. 9. It can be seen that the displacement curve attains its maximum value at a frequency of 69 Hz, while the stress curve attains its maximum value at a frequency of 103 Hz. This solution significantly reduces the stress values in the oil outlet pipe and changes the location of the maximum stress, as a result of adding support to the oil outlet pipe, which improves the structural stiffness of the oil outlet pipe and the overall stability of the oil pipe system.
Fig. 8Structural reinforcement plan
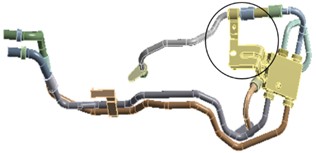
Fig. 9Harmonic response results of reinforced structure
4. Conclusions
1) Performing modal simulation analysis on the pipe system yielded the first six natural frequencies and corresponding mode distribution of the original model. The results show that the vibrations of the last three pipes are mainly manifested in the outlet pipe of the transmission, and the last four natural frequencies are all within the engine excitation frequency range of 60-100 Hz, further indicating that the oil cooling pipe system may resonate under excitation.
2) The harmonic response and fatigue characteristics of the pipe were analyzed, and the resonant frequency at which the pipe had the maximum amplitude and the stress distribution and maximum stress level at that frequency were obtained. The frequency response analysis showed that the maximum stress in the model was 33 MPa, which met the strength requirement and would not cause static load failure. The reinforced pipe had a maximum stress amplitude corresponding to a frequency of 103 Hz, which avoided the excitation frequency and met the operational requirements.
References
-
W. Hu, B. Zhou, and X. Zheng, “Fatigue evaluation of CFST arch bridge based on vehicle-bridge coupling vibration analysis,” Buildings, Vol. 14, No. 6, p. 1787, Jun. 2024, https://doi.org/10.3390/buildings14061787
-
X. Wu et al., “A critical review of wheel/rail high frequency vibration-induced vibration fatigue of railway bogie in China,” Railway Sciences, Vol. 3, No. 2, pp. 177–215, Apr. 2024, https://doi.org/10.1108/rs-12-2023-0048
-
V. Goel and N. Kumar, “Vibration response analysis of healthy and cracked gears through different signal processing techniques,” Vibroengineering Procedia, Vol. 39, No. 3, pp. 43–47, Dec. 2021, https://doi.org/10.21595/vp.2021.22311
-
V. Nicoletti, R. Martini, L. Amico, S. Carbonari, and F. Gara, “Operational modal analysis for supporting the retrofit design of bridges,” ce/papers, Vol. 6, No. 5, pp. 1182–1188, Sep. 2023, https://doi.org/10.1002/cepa.2125
-
M. Sohrabifard, M. Nategh, and M. Ghazavi, “Evaluation, calibration, and modal analysis for determination of contact stiffness between workpiece and components of milling fixture,” Proceedings of the Institution of Mechanical Engineers, Part B: Journal of Engineering Manufacture, Vol. 237, No. 12, pp. 1819–1835, Nov. 2022, https://doi.org/10.1177/09544054221138165
-
S. de Carolis, A. Messina, and L. Soria, “Modal analysis through response-based FRFs: Additional modes for local diagnoses,” Journal of Sound and Vibration, Vol. 549, No. 1, p. 117574, Apr. 2023, https://doi.org/10.1016/j.jsv.2023.117574
About this article
The authors have not disclosed any funding.
The datasets generated during and/or analyzed during the current study are available from the corresponding author on reasonable request.
The authors declare that they have no conflict of interest.
