Abstract
In order to improve the aerodynamic characteristics of the drone wings, CFD method was used to simulate and calculate the lift coefficient, drag coefficient, and lift-drag ratio under different relative inflow velocities, as well as the velocity and pressure fields under different attack angles. Modal calculations were conducted on the wing to obtain the first four modal shapes, providing a basis for analyzing flutter characteristics. An iterative calculation method of incompressible potential flow-boundary layer based on surface element method was combined with the software XFOIL to optimize the airfoil at low wind speeds. The results indicate that the airfoil is susceptible to stall at high angles of attack, with the pressure of the separation flow being nearly equivalent to that at the separation point. Subsequent to separation, there is an increase in differential pressure resistance, resulting in a marked rise in the drag coefficient. At the optimized angle of attack, the lift-drag ratio of the optimized wing increases by 12.58 %, while there is a decrease of 0.084 % in lift coefficient and an increase of 11.21 % in drag coefficient.
Highlights
- CFD method was used to simulate and calculate the lift coefficient, drag coefficient, and lift-drag ratio under different relative inflow velocities, as well as the velocity and pressure fields under different attack angles.
- Modal calculations were conducted on the wing to obtain the first four modal shapes, providing a basis for analyzing flutter characteristics.
- An iterative calculation method of incompressible potential flow-boundary layer based on surface element method was combined with the software XFOIL to optimize the airfoil at low wind speeds.
1. Introduction
Drones have many advantages over manned aircraft, including a simpler system, lighter weight, lower cost, and no threat to the safety of pilots during flight [1]. With the continuous development of drone technology, its application range in both military and civilian fields is becoming wider and wider. In the military field, drones are widely used for tasks such as reconnaissance, surveillance, and strikes [2, 3]. In the civilian field, they are used for geographic mapping, aerial photography, and environmental protection. The diversification of market demand has driven continuous innovation in the aerodynamic shapes of drones. From the initial fixed-wing and rotor layout to the current composite wing, the aerodynamic shapes of drones have undergone significant changes. Aerodynamic elastic statics and aerodynamic elastic dynamics are the two disciplines studied most in aircraft design. Aerodynamic elastic statics mainly studies the twist distribution of the wing in static conditions, the influence of control surfaces, the redistribution of aerodynamic loads on the wing, and problems related to wing shape and structural design [4]. In aerodynamic elastic dynamics, on the other hand, the main focus is on issues such as wing flutter, control surface whistling, aircraft vibration response, and response to gusty winds [5, 6]. Currently, there are two main aerodynamic layouts for composite wing drones, one is tiltable, and the other is equipped with a rotor on a crossbar. When the wing is divided into an inner wing and an outer wing, the inner wing section is usually a rectangular wing, while the outer wing section is a trapezoidal wing. The inner wing section is connected to the fuselage and has a simple rectangular wing shape, which is easy to manufacture. The outer wing section is a trapezoidal wing mainly because its airflow distribution along the span is close to an elliptical wing, and no sweep angle is needed to reduce drag. Its own induced drag is also close to the minimum value. The spar has a significant impact on the aerodynamic characteristics of the wing, so the aerodynamic elasticity analysis of the composite wing is crucial. This paper conducts aerodynamic elasticity analysis and optimization of the wing based on the CFD method, providing a reasonable reference for improving the quality and stiffness of the drone wing in the subsequent process.
2. Simulation and analysis of aerodynamic characteristics of wings
2.1. The establishment of CFD model
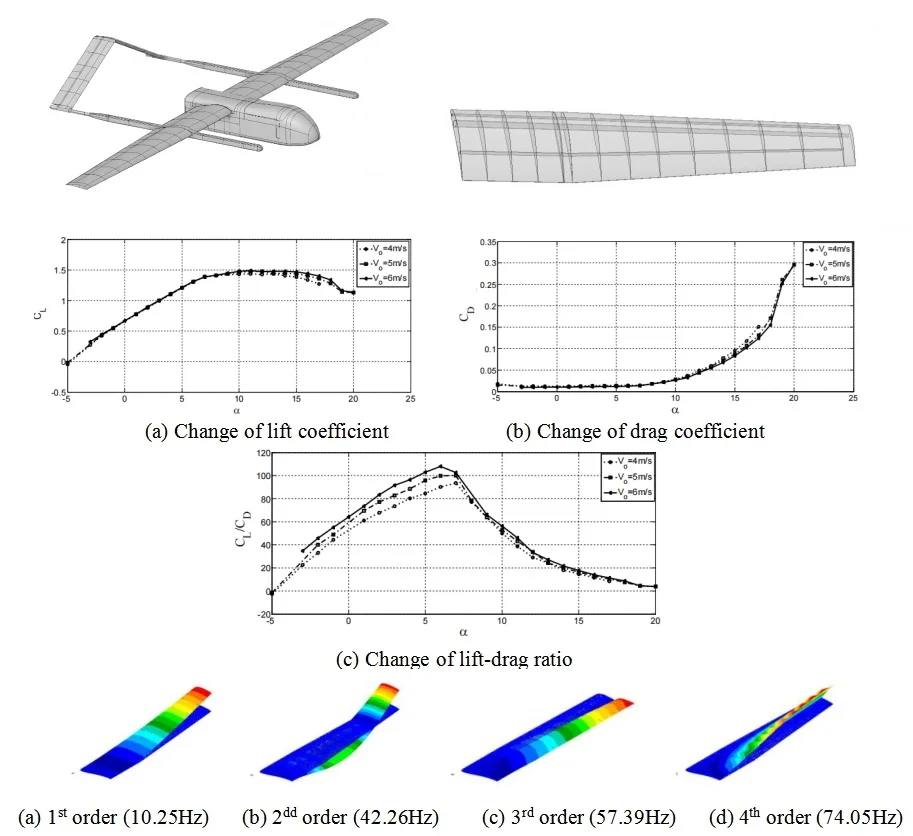
Aerodynamic elasticity of the wing in a steady state is studied, including its deformation under aerodynamic loads and the stable characteristics of the resulting static deformation. The drone has a symmetrical structure, as shown in Fig. 1. It has a two-segment, high aspect ratio wing, with the inner segment being a rectangular wing and the outer segment being a trapezoidal wing. The tail wing has a inverted V-shape and is combined with a boom at the end. The wing being studied is in a cruising state, and a simplified wing model is used, without considering the effect of ailerons separately but treating the main wing and ailerons as a single wing surface for analysis. At the same time, displacement is not considered, and the fuselage width is converted into the length of the inner wing segment. Based on the span of the inner and outer wing segments, the number of spars on the wing was determined, with the inner wing segment spars being uniformly distributed and the outer wing segment spars being spaced further apart from the root to the tip, as shown in Fig. 2.
Fig. 1The overall model of a drone
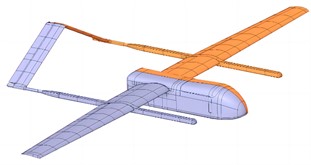
Fig. 2The wing model
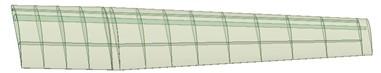
Fig. 3The result of mesh division
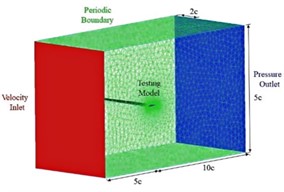
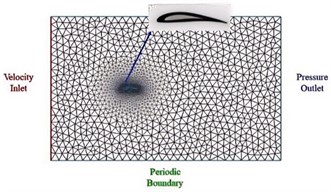
When conducting finite element analysis, the quality of the mesh has a particularly significant impact on the calculation results. The smaller the mesh volume, the closer it is to the actual situation of the discrete object, but the smaller the volume brings an increase in the number, and the increase in the number of mesh elements will lead to an increase in the calculation volume, affecting the calculation efficiency. In this paper, the mesh division of the wing's outflow field is carried out using the Pointwise software, and the surface of the wing is divided into structured meshes, while the outer 10 layers are also divided into structured meshes. The rest are divided into unstructured meshes. A total of 4 sets of meshes with different numbers of nodes are generated by changing the number of nodes at the leading and trailing edges to verify mesh independence. The size of the flow field is the distance from the leading edge to the velocity inlet is 5 times the chord length, the distance from the pressure outlet is 10 times the chord length, the upper and lower are 2.5 times the chord length, and the spanwise direction is 2 times the chord length. Through the verification of finite element meshes, it can be seen that the difference in lift and drag coefficients is minimized when the number of elements is between 2 million and 3 million. This indicates that the mesh has achieved mesh independence at this interval, and the mesh results are shown in Fig. 3.
2.2. Effect of relative inflow velocity
The aerodynamic characteristics under the condition of relative inflow velocity of 4 m/s, 5 m/s and 6 m/s are researched in the paper. By changing the flow velocity, the Reynolds number can be changed, and the variation curves of the CL (lift coefficient), CD (drag coefficient), and C/CLD (lift-drag ratio) with the α (angle of attack) under three different conditions can be obtained, as shown in Fig. 4. It can be seen that the surface of the wing experiences changes in lift and drag under the action of aerodynamic forces. The lift coefficient of the wing increases continuously with the increase of the angle of attack, and then decreases after reaching a certain value. The drag coefficient of the wing increases continuously with the increase of the angle of attack. The lift-drag ratio increases first and then continuously decreases with the increase of the angle of attack. The drag coefficient is maximum at low wind speeds mainly because at low Reynolds numbers, the viscous effect in the boundary layer increases, causing an increase in frictional drag on the airfoil surface and making it easier for the boundary layer to separate from the airfoil. As the relative flow speed increases, the lift-to-drag ratio of the airfoil becomes larger, meaning that the aerodynamic performance of the airfoil improves. As the angle of attack increases, the drag coefficient rises, first rising slowly, and then rising sharply when the angle of attack reaches a certain degree. The increase in drag is mainly due to pressure difference drag. Along the lower surface of the airfoil, the flow of air from the stagnation point accelerates first and then decelerates. As the angle of attack increases, the stagnation point moves backward, and the acceleration and deceleration in the front half of the airfoil become slower.
Fig. 4Aerodynamic characteristics with different relative inflow velocity
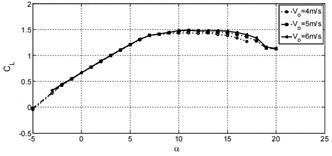
a) Change of lift coefficient
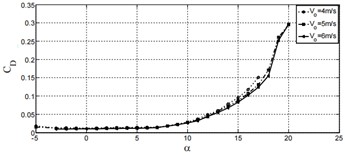
b) Change of drag coefficient
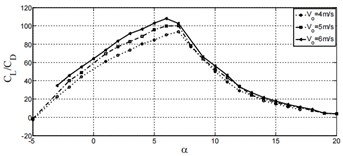
c) Change of lift-drag ratio
2.3. Effect of angle of attack
At a flow velocity of 6 m/s, the flow velocity was simulated and analyzed for attack angles of 5° and 15°, as shown in Fig. 5 and Fig. 6. It can be seen that the attack angle has a significant impact on the velocity and pressure fields. After the maximum speed point, the airflow begins to slow down, so the surface pressure continues to increase. At small attack angles, the flow does not separate, and the airfoil’s entire upper surface is covered by a decelerating surface boundary layer. At higher attack angles, the airflow on the upper surface of the airfoil begins to separate clearly. After separation, the flow leaves the surface and does not continue to decelerate, so the pressure does not continue to rise. After separation, the pressure coefficient is basically equal to the pressure coefficient at the separation point. The earlier the separation, the lower the pressure in the separation region, and the greater the forward pressure pushing force on the airfoil will be reduced, making the rearward pressure pushing force greater than the forward pressure pushing force, thus producing a significant pressure difference resistance. The proportion of pressure difference resistance in the total resistance increases as the attack angle increases. Separation may occur under an adverse pressure gradient, because the flow under an adverse pressure gradient must advance against the increase in pressure, and it uses deceleration to exchange for the increase in pressure. However, within the boundary layer on the edge, the fluid loses part of its momentum due to viscous resistance, and the loss of momentum is most severe near the airfoil surface.
Fig. 5Velocity field cloud and pressure flow diagram with attack angles of 5°
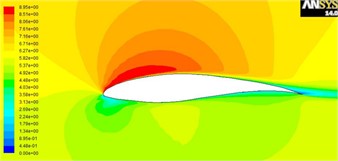
a) Velocity field
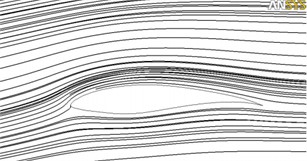
b) Pressure field
Fig. 6Velocity field cloud and pressure flow diagram with attack angles of 15°
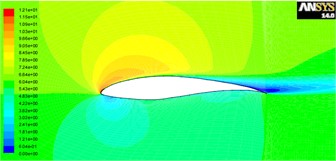
a) Velocity field
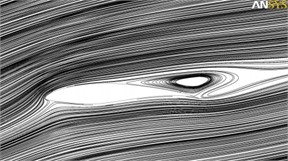
b) Pressure field
2.4. Modal analysis of wing structure
The wing modal analysis was performed using the default method of Nastran’s Lanczos algorithm, which is an algorithm that transforms a symmetric matrix into a symmetric triangular matrix through an orthogonal similarity transformation. This method is similar to the subspace method for large structural symmetric mass and stiffness matrices and has fast convergence. The form of flutter occurrence in the wing is mainly concentrated on low-order bending-twisting coupled modalities, so the modal analysis of the wing was performed with modalities that included bending-twisting modalities. Based on the results of modal analysis, the first four modalities were selected, as shown in Fig. 7.
Fig. 7Results of the first four modal analysis
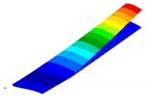
a) 1st order (10.25 Hz)
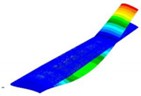
b) 2dd order (42.26 Hz)
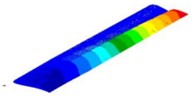
c) 3rd order (57.39 Hz)
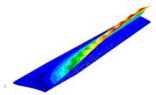
d) 4th order (74.05 Hz)
According to modal analysis, the first four modal frequencies are small, the equivalent mass is large, and the participation coefficient is high. The flutter of the wing mainly occurs in the low-order modal, so the low-order modal is the worthiest of attention. The first modal frequency is the smallest, and from the first modal cloud map, the bending of the wing is mainly along the wingspan, and the displacement deformation of the wing has only one peak, which appears at the wing tip. The second modal of the wing is a two-curve along the span, and the deformation of the wing appears in two peaks, at the middle of the span and the wing tip, and the maximum displacement deformation of the wing appears at the wing tip. The displacement deformation of the wing increases as the modal number increases. The third modal is chordwise bending, and the displacement of the wing is mainly in the horizontal direction, and the maximum displacement occurs at the wing tip. The bending-twist coupled modal is mainly the third and fourth modal.
3. Optimization of wing structure
3.1. Numerical optimization method
With the rapid development of computer technology and computational fluid dynamics (CFD), numerical simulation calculation of aerodynamic characteristics of airfoils has become an important link in the process of airfoil aerodynamic design for wind turbine blades. Currently, the methods for aerodynamic design of airfoils can be divided into two categories: one is the direct numerical optimization method, also known as the forward design method; the other is the inverse design method. Direct optimization combines CFD numerical calculation and optimization algorithm to continuously modify the geometric shape of the airfoil until the optimization goal is achieved. The design of wind turbine airfoils involves multidisciplinary, multi-objective, and multi-condition problems. The inverse design method is to first give the target pressure distribution on the airfoil surface, and then solve the aerodynamic profile of the designed airfoil according to the target pressure distribution.
3.2. Optimization basis and calculation
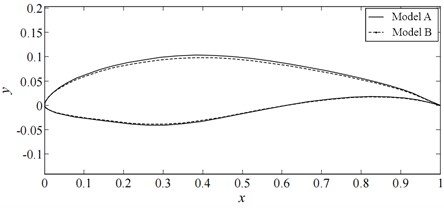
The design requirements for wind turbine blades are very strict, especially for the airfoil at the tip of the blade. Typically, this part of the blade occupies a position ranging from 70 % to 100 % of the blade length and provides more than 60 % of the wind energy capture efficiency. Additionally, as the blade length increases, the tip speed also increases, so the importance of noise control requirements also becomes more important. For the airfoil at the root of the blade, more emphasis is placed on meeting the needs for structural strength and stiffness, while ensuring structural stability under the premise of maximizing lift-to-drag ratio and reducing roughness sensitivity. To ensure a smooth and smooth overall shape, the various airfoils must have good geometric compatibility. By using the coefficient of the basic function in the improved Hicks-Henne type function as the design variable and selecting 10 disturbance points on both surfaces for a total of 20 design variables, an interface between MATLAB and XFOIL was created in MATLAB and the XFOIL program was called to perform aerodynamic performance calculations. Through calculations, the shapes of the initial model (model A) and the optimized model (model B) can be compared as shown in Fig. 8.
Fig. 8Comparison of wing shape before and after optimization
Using XFOIL software, the aerodynamic performance of the reference wing and optimized wing were calculated separately, as shown in Fig. 9. Through the calculation, the lift coefficient, drag coefficient, lift-to-drag ratio, and pressure coefficient curves of the wing can be obtained. By comparing, it can be seen that the optimized wing has an improved lift-to-drag ratio by 12.58 % at the optimized attack angle, while the lift coefficient decreased by 0.084 % and the drag coefficient increased by 11.21 %.
Through the optimization of the wing shape, the improved parameters mainly include the lift-to-drag ratio, the lift coefficient, and the drag coefficient. The lift-to-drag ratio is the ratio of the lift to the drag of an aircraft at the same angle of attack during flight. The larger its value, the better the aerodynamic performance of the aircraft. The lift coefficient is the ratio of the lift generated by the aircraft under specific conditions to the product of the incoming flow velocity and the reference area, while the drag coefficient is the ratio of the drag suffered by the aircraft to the product of the incoming flow velocity and the reference area. When the increase in the lift coefficient is faster than that of the drag coefficient, the lift-to-drag ratio will increase, indicating an improvement in the aerodynamic performance of the aircraft.
Fig. 9Comparison of aerodynamic characteristics
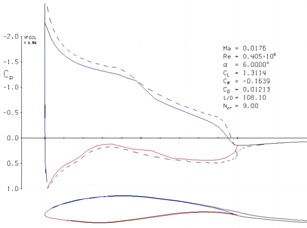
a) Model A
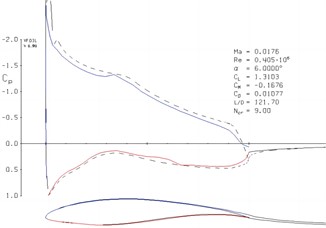
b) Model B
4. Conclusions
1) As the relative flow velocity decreases, the viscous effect of the boundary layer increases, causing an increase in the frictional resistance on the airfoil surface and thus increasing the wing drag coefficient and reducing the lift-to-drag ratio. At a large attack angle, the airfoil stalls, and a separation flow forms at the trailing edge. After separation, the pressure is basically equal to the pressure at the separation point.
2) To reduce the amount of computation and keep the airfoil with its shape characteristics, the range of values for the design variables needs to be limited. Additionally, the geometric parameters of the wing have a significant impact on aerodynamic performance, such as the maximum relative thickness and its corresponding position on the airfoil chord line, which has a great impact on the aerodynamic performance of the airfoil. The maximum relative thickness when it is large or small will also affect the maximum lift coefficient of the airfoil. The maximum camber and its corresponding position on the airfoil chord line will also have a significant impact on the aerodynamic performance of the airfoil.
References
-
M. A. Sumbatyan and I. K. Samsonov, “Analytical method in the linear three-dimensional aerodynamics of a thin rectangular wing,” Fluid Dynamics, Vol. 58, No. 9, pp. 1697–1707, Mar. 2024, https://doi.org/10.1134/s0015462823603029
-
K. Abu Salem, G. Palaia, M. Carini, M. Méheut, M. Maganzi, and C. Falcone, “A CFD-based collaborative approach for box-wing aircraft aerodynamic assessment: the PARSIFAL study case,” Aerotecnica Missili and Spazio, Vol. 102, No. 4, pp. 385–407, Sep. 2023, https://doi.org/10.1007/s42496-023-00172-7
-
C. Bai and C. Zhou, “Ground effects on the aerodynamics of a wing with slot type distributed propulsion system for VTOL applications,” International Journal of Turbo and Jet-Engines, Vol. 40, No. s1, pp. s583–s595, Jan. 2024, https://doi.org/10.1515/tjj-2022-0065
-
R. Talebitooti, M. Zarastvand, and H. Darvishgohari, “Multi-objective optimization approach on diffuse sound transmission through poroelastic composite sandwich structure,” Journal of Sandwich Structures and Materials, Vol. 23, No. 4, pp. 1221–1252, Jun. 2019, https://doi.org/10.1177/1099636219854748
-
J. Mieloszyk, A. Tarnowski, and T. Goetzendorf-Grabowski, “Designing aerodynamic devices for UAV – lessons learned,” Aircraft Engineering and Aerospace Technology, Vol. 96, No. 1, pp. 73–83, Feb. 2024, https://doi.org/10.1108/aeat-02-2023-0060
-
H. Zhang, Y. Yang, and R. Cai, “Dynamics simulation of folding wing UAVs launched from a high-altitude balloon platform,” Proceedings of the Institution of Mechanical Engineers, Part G: Journal of Aerospace Engineering, Vol. 237, No. 13, pp. 3072–3091, Jun. 2023, https://doi.org/10.1177/09544100231181218
About this article

The authors have not disclosed any funding.
The datasets generated during and/or analyzed during the current study are available from the corresponding author on reasonable request.
The authors declare that they have no conflict of interest.
