Abstract
In order to ensure the stability of light fixed-wing aircraft during flight missions, considering the effects of relative airflow velocity and angle of attack, the distribution characteristics of velocity and pressure fields under different conditions, as well as the law of change of dynamic parameters, were derived by using aerodynamic methods. In the free modal condition, the modal truncation method was used to simulate and analyze the low-order modal shapes. Based on the modal analysis results, the sweep frequency range was set to 3-50 Hz, with a step size of 1.6 Hz, for a total of 30 substeps. A harmonic load of 1500 N was applied to the fuselage, and the displacement-frequency response curves and stress-frequency response curves of the fuselage structure and wing structure were extracted after the calculation. The results shows that the maximum lift-drag ratio occurs when the angle of attack is 6°, and the peak displacement deformation of the aircraft occurred around 24 Hz.
Highlights
- n the free modal condition, the modal truncation method was used to simulate and analyze the low-order modal shapes.
- Based on the modal analysis results, the sweep frequency range was set to 3-50 Hz, with a step size of 1.6 Hz, for a total of 30 substeps.
- A harmonic load of 1500 N was applied to the fuselage, and the displacement-frequency response curves and stress-frequency response curves of the fuselage structure and wing structure were extracted after the calculation.
1. Introduction
In recent years, the aviation field of small aircraft and drones has entered a sustained growth phase, with increasing demand. Most small aircraft are fixed-wing models, characterized by fast cruising speed and high maneuverability, but they also have problems such as high price, high fuel consumption, and low survival rate in flight accidents. The two main goals of the world aviation market’s competitiveness are economic and environmental sustainability, aiming to minimize the aircraft's lifecycle costs and improve its environmental friendliness and comfort [1]. In light of the current trends in the aviation industry, light fixed-wing aircraft must have high strength and lightweight features in order to capture the market. By using high-strength composite materials and designing the structure and materials in a rational way, the weight of the aircraft can be greatly reduced, maintenance costs can be lowered, fuel economy can be improved, and the benefits of weight reduction can be achieved. Computational fluid dynamics (CFD) is a branch of mechanics that studies the essence and mechanisms of fluid motion through numerical simulation and visualization post-processing methods based on computational mathematics, modern fluid mechanics, and computer science [2, 3]. The application of CFD methods in practical engineering not only shortens the R&D cycle, greatly reduces the burden of wind tunnel tests, but also ensures aircraft performance and improves structural safety, achieving the goal of reducing economic costs. Meanwhile, the study of inherent characteristics and vibration characteristics of aircraft in the field of aerospace is of great significance for subsequent problems caused by vibration, such as structural damage [4, 5]. At present, the study of aircraft vibration characteristics is an important reference for aircraft structural vibration reduction design and fatigue research. Based on the fact that fixed-wing aircraft is in an unconstrained state in flight, this paper proposes a free modal analysis to study the characteristics of natural frequencies and modal shapes [6]. On the basis of modal analysis, a specific sweep frequency range is selected, and harmonic loads are applied to the structure at different locations either statically or under pressure, to study the dynamic response.
2. Analysis of aerodynamic response characteristics
2.1. The establishment of CFD model
The finite element modeling of the entire aircraft includes the fuselage, wing, and tail sections, which are modeled based on the structural features of a light fixed-wing aircraft, as shown in Fig. 1. Considering that the aerodynamic characteristics are mainly influenced by the components in contact with the fluid, the landing gear, nose ventilation port, and duct fan are not included in the calculation range when building the structural model. Due to the complexity of the aircraft structure model, ICEM was used for non-structured mesh generation to reduce the mesh division and calculation time. To ensure good mesh quality and no impact on calculation accuracy, a model check was conducted after importing the model to ensure no gaps or sharp bodies or surfaces. The external flow field boundary conditions are divided into inlet, outlet, and wall surfaces. The far-field front and side are set as velocity inlet boundaries, where the angle of attack is determined by changing the inflow direction. The far-field rear is set as a pressure outlet, and the aircraft surface is set as a wall boundary. The entire calculation domain is a rectangular box, with the far-field dimensions set as 15 times the average aerodynamic chord length in front, above, and below the aircraft center of gravity, and 20 times the average aerodynamic chord length at the rear. The flow field region is shown in Fig. 2.
Fig. 1The overall model of a drone
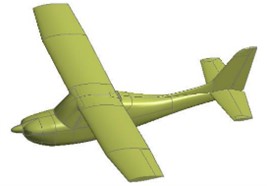
Fig. 2The wing model

The accuracy of the mesh generation directly affects the calculation efficiency and result accuracy, therefore, when conducting surface mesh division for the aircraft body, due to the fact that the boundary far-field size is much larger than the geometric size of the aircraft, using global dimensions would result in an excessively large number of cells for the aircraft, and therefore, local refinement is needed. Mesh convergence analysis is used to verify the accuracy of the calculation results, and in this paper, a non-structured tetrahedral mesh is used as the main mesh, therefore, mesh convergence analysis was conducted for different mesh scales, and the aircraft model was calculated using four different mesh numbers. It aims to discover the characteristics and laws of fluid motion and use them to achieve accurate analysis. In the field of aircraft structure design, CFD methods have been successfully applied in the initial design stage, and numerical calculations have become the main computational analysis method for typical aircraft structures, with wind tunnel tests serving only as a verification method.
2.2. Aerodynamic calculation and analysis
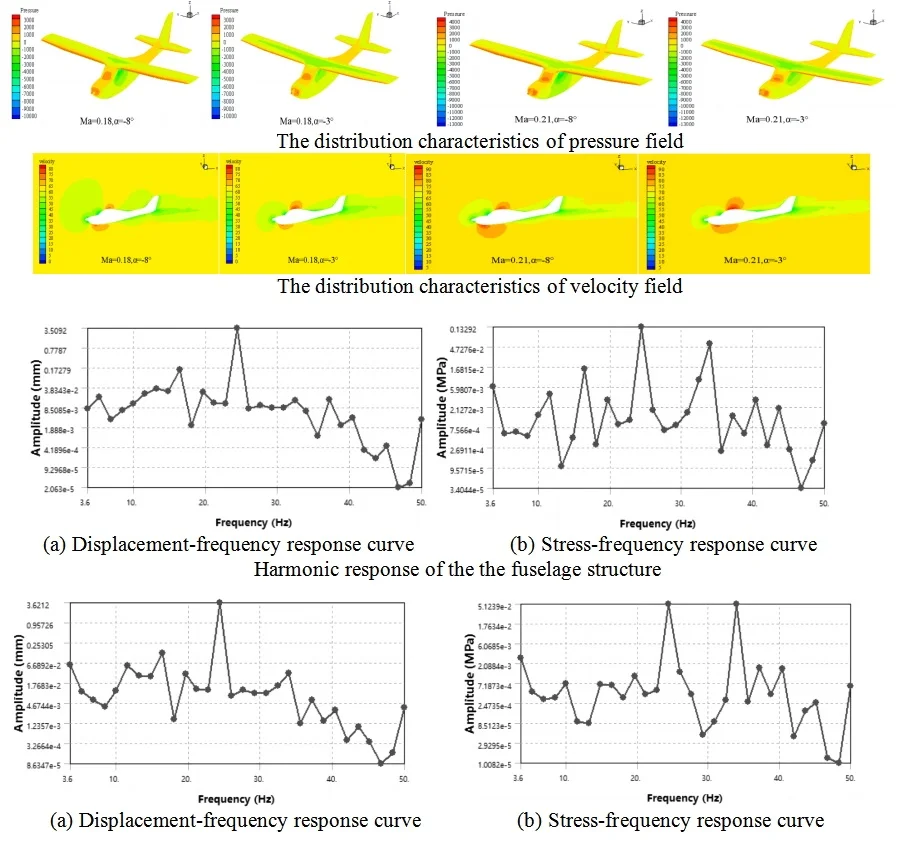
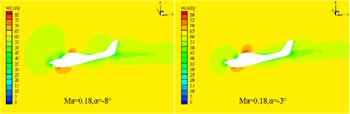
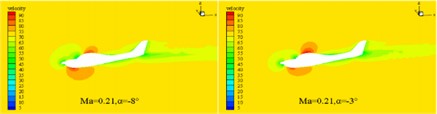
Because the cruising maximum Mach number of this type of aircraft is approximately 0.23, its flow can be approximated as an incompressible flow. In order to improve the convergence speed and efficiency of the calculation, the turbulence model is selected as the Spalart-Allmaras turbulence model, and the SIMPLE incompressible flow algorithm based on pressure is selected. The viscous flux is computed using the center format, the inviscid flux is computed using the second-order upwind scheme, and the gradient is built using the least-squares method based on the mesh center. The relevant aerodynamic characteristics of the aircraft are computed at a certain flight altitude, where the air density is 1.18 kg/m3 and the viscosity coefficient is 1.7894e-5 kg/(m/s), and the incoming flow speed is selected as 220 km/h and 260 km/h, respectively, corresponding to flight Mach numbers of 0.18 and 0.21. The characteristic length is taken as the average aerodynamic chord length of the aircraft. After the aerodynamic calculation, the pressure distribution of the fixed-wing aircraft is analyzed at different Mach numbers with different angle of attack selected at –8° and –3°. In the finite element analysis based on FLUENT, the pressure and velocity distribution cloud map can be obtained as shown in Fig. 3 and Fig. 4. It can be seen that at the same cruise Mach number, the peak pressure load distribution is found at the nose, leading edge of the wing, and the leading edge of the tailplane. As the angle of attack increases, the pressure difference between the leading edge and the trailing edge of the wing increases, while the pressure difference between the upper and lower surfaces of the wing decreases. The pressure distribution on the fuselage and wing changes gradually, with the order of magnitude within the normal range. At the same angle of attack, as the Mach number increases, the order of magnitude of the pressure difference also increases, and the overall pressure layout is relatively reasonable. As the Mach number and angle of attack increase, the magnitude of the velocity also increases. The velocity distribution is larger and more noticeably different at the leading edge and the top surface of the cockpit, while it is relatively smooth and without separation at other locations. Overall, the velocity distribution is relatively reasonable.
Fig. 3The distribution characteristics of pressure field
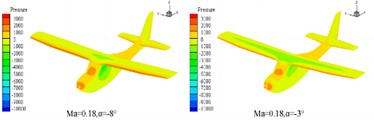
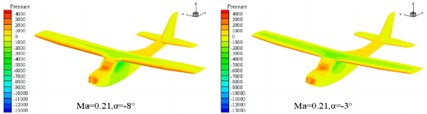
Fig. 4The distribution characteristics of velocity field
Through continuous iterative calculations, the variation curves of the CL (lift coefficient), CD (drag coefficient), and K (lift-drag ratio) with the (angle of attack) under three different Mach numbers conditions can be obtained, as shown in Fig. 5. When the angle of attack is positive, the lift coefficient of this type of aircraft increases with the increase in Mach number.
Fig. 5Aerodynamic characteristics at different Mach numbers
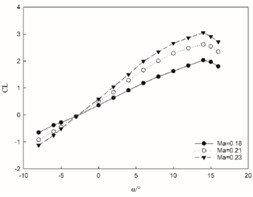
a) Change of lift coefficient
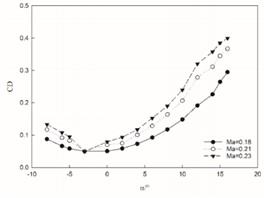
b) Change of drag coefficient
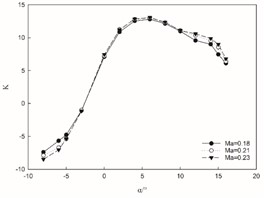
c) Change of lift-drag ratio
Conversely, when the angle of attack is negative, the lift coefficient decreases with an increasing Mach number. Regardless of whether the angle of attack is positive or negative, there is no discernible change in the overall trend, indicating that while Mach number affects changes in lift coefficient values during subsonic flight, it does not alter the underlying pattern. At a constant Mach number, the lift coefficient demonstrates a nearly linear increase with rising angles of attack. The peak lift coefficient occurs at an angle of 14° after which its growth rate diminishes significantly. Subsequently, at 15° angle of attack, there is a decrease in lift coefficient suggesting an estimated critical stall angle for this aircraft to be approximately 14°. The drag coefficient for this aircraft rises as Mach number increases and exhibits no significant deviation from its changing trend; thus, indicating that Mach number has minimal impact on its variation during subsonic speeds. At a constant Mach number, the drag coefficient changes in a parabolic form with changes in the angle of attack. There is a critical point at an angle of –3°. As the angle increases, the drag coefficient decreases on one side and increases on the other side. Notably at 14° angle of attack, severe separation occurs on the airfoil's upper surface leading to sharp decline in lift and continuous rise in drag. With increasing Mach numbers, changes in aircraft's lift-to-drag ratio show marginal increments within small ranges without any distinct trends observed. At constant Mach numbers however, there exists an initial rise followed by subsequent decline in lift-to-drag ratio as angles increase; reaching maximum value at 6° before decreasing continuously thereafter.
3. Analysis of vibration characteristics
3.1. Modal analysis
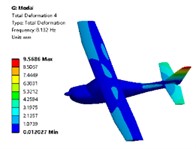
Modal analysis is a type of analysis used in the field of engineering vibration to study the inherent properties of mechanical structures. Each modal corresponds to a natural frequency and mode shape. By studying the changes in natural frequencies and mode shapes, it is possible to predict the vibration response of the structure within a certain frequency range. Modal analysis can be applied in practical engineering for equipment fault diagnosis and dynamic design. As an important method for studying the inherent properties of structures, modal analysis provides important reference information for subsequent vibration analysis. The computational model is a fixed-wing aircraft model, combined with modal analysis theory and the fact that fixed-wing aircraft are in a state of unrestrained flight during flight. In this paper, the modal analysis module of Workbench is used to perform a free modal analysis of the fixed-wing aircraft. Since the first six frequencies of the free modal analysis results are close to zero, they belong to rigid body modes, so the 7th mode of the aircraft is taken as the 1st actual mode. In practical engineering, high-order modes have a small impact on low-frequency responses, and low-order modes are usually studied. The modal truncation method is used. The first four modal shapes are shown in Fig. 6.
Fig. 6Simulation results of the first four modal shapes
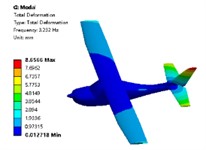
a) The first order
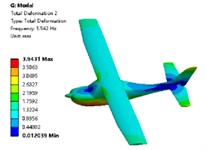
b) The second order
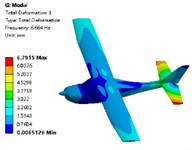
c) The third order
d) The fourth order
It can known that the first mode natural frequency is 3.232 Hz, and the deformation mainly occurs in the tail section, with the most obvious deformation in the vertical tail. The deformation of the vertical tail gradually decreases from the tip to the root, followed by the deformation of the horizontal tail. The second mode natural frequency is 5.542 Hz, and the main deformation occurs in the fuselage, wings, and tail, with the most obvious deformation in the fuselage. The deformation gradually decreases from the bottom of the fuselage to the middle, and then gradually increases from the middle to the top. The deformation of the wings and tail gradually decreases from the tip to the root. The third mode natural frequency corresponds to 6.664 Hz, and the main deformation occurs in the tail section, with the most obvious deformation in the horizontal tail tip. The deformation of the horizontal tail gradually decreases from the tip to the root, while the deformation of the vertical tail gradually decreases from the root to the tip. The deformation of the fuselage and wings is relatively smooth. The fourth mode natural frequency is 8.132 Hz, and the maximum deformation occurs in the vertical tail.
3.2. Harmonic response analysis
In engineering, the vibration response at the structural frequency is often greater than that at other frequencies, and the requirements for vibration testing are also to be conducted at the resonance frequency. Harmonic response refers to any sustained periodic load that will produce a sustained periodic response in the structural system. Harmonic response analysis is used to determine the steady-state response of linear structures under harmonic loading, and harmonic response analysis is performed to obtain the relationship between the displacement, stress, and strain responses and the frequency under sinusoidal loading. By studying the relationship between the response and frequency within a certain frequency range, the peak response can be obtained, and then measures can be proposed to avoid and reduce vibration. Harmonic response analysis does not consider the transient vibration caused by the initial state of the excitation and calculates the vibration situation of the structure in the steady state. Harmonic response analysis can predict the continuous dynamic characteristics of the structure and avoid the adverse effects of resonance and fatigue caused by forced vibration. This analysis ensures that the structure avoids resonance within a given frequency range and under sinusoidal loading.
The modal analysis of the entire aircraft was carried out, with the sweep frequency range selected as 3-50 Hz, with a step size of 1.6 Hz, for a total of 30 sub steps. A harmonic load of 1500 N was applied perpendicular to the fuselage. The aircraft was divided into two parts: the fuselage and wings, and the analysis was carried out separately for each part. The displacement-frequency response curve and stress-frequency response curve of the fuselage structure of the aircraft were extracted after the calculation, as shown in Fig. 7. Based on the curve variation trend depicted in Fig. 7, it is evident that the fuselage displacement exhibits a prominent peak near 24 Hz in the displacement frequency response curve, indicating that maximum deformation of the fuselage occurs at this frequency. Similarly, in the stress-frequency response curve, the fuselage stress also peaks near 24 Hz, signifying that maximum stress of the fuselage appears at this frequency.
Fig. 7Harmonic response of the fuselage structure
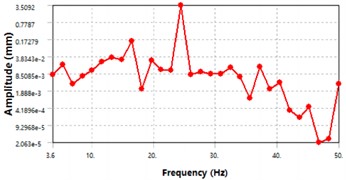
a) Displacement-frequency response curve
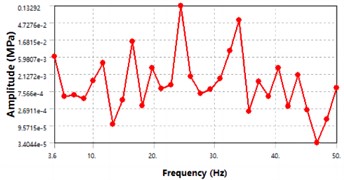
b) Stress-frequency response curve
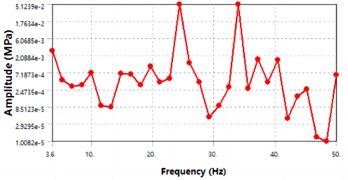
The displacement-frequency response curve and stress-frequency response curve of the wing are shown in Fig. 8. From the curve trend in Fig. 8, it can be seen that the displacement of the wing in the displacement-frequency response curve peaks at around 24 Hz, indicating that the wing undergoes the greatest deformation at this frequency. In the stress-frequency response curve, the stress of the fuselage peaks at around 24 Hz and 34 Hz, indicating that the wing experiences the greatest stress at these frequencies.
The ordinate in Fig. 7 and Fig. 8 refers to the peak response at different excitation frequencies. Due to the influence of the mode shape, there are significant differences in the harmonic response results under different excitation frequencies, which is also the reason for many peaks in harmonic response results. When the external excitation of the aircraft structure approaches a certain natural frequency, relatively high dynamic stresses may be produced, causing undesirable damage and deformation. In aircraft structural design, not only the static strength and stiffness of the structure must be considered, but also whether the vibration of the structure will cause structural failure. The vibration characteristics of aircraft structures often have a very important impact on the performance of the entire aircraft.
Fig. 8Harmonic response of the wing
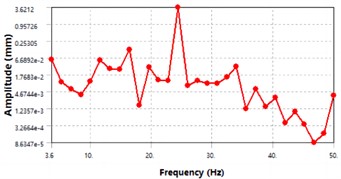
a) Displacement-frequency response curve
b) Stress-frequency response curve
4. Conclusions
1) In CFD model, fixed-wing aircraft models have many complex surface forms, so a non-structured mesh is chosen for the discretization of the solution domain. Through the analysis of the flow field, it can be seen that in the range of positive angle of attack, the increase in Mach number will cause both the lift coefficient and drag coefficient to increase, while in the range of negative angle of attack, the lift coefficient will decrease as the angle of attack increases, and the drag coefficient will increase accordingly. The maximum lift-drag ratio occurs when the Angle of attack is 6°, and the lift-drag ratio is as high as 13.06.
2) A free modal analysis was conducted on a fixed-wing aircraft, and the natural frequencies and modes were analyzed. Based on the modal analysis, a harmonic response analysis was conducted, where a harmonic load was applied along the vertical axis of the aircraft in the form of a concentrated force and pressure load. The displacement and stress curves of the fuselage and wings were calculated and analyzed as a function of frequency response, and the results showed that the peak displacement deformation of the aircraft occurred around 24 Hz.
References
-
Q. Yang, C. Song, and S. Liu, “Computerized analysis of traveling wave vibration characteristics of aviation thin-walled spiral bevel gears,” The Journal of Strain Analysis for Engineering Design, Vol. 58, No. 5, pp. 367–375, Nov. 2022, https://doi.org/10.1177/03093247221133602
-
K. Abu Salem, G. Palaia, M. Carini, M. Méheut, M. Maganzi, and C. Falcone, “A CFD-based collaborative approach for box-wing aircraft aerodynamic assessment: the PARSIFAL study case,” Aerotecnica Missili and Spazio, Vol. 102, No. 4, pp. 385–407, Sep. 2023, https://doi.org/10.1007/s42496-023-00172-7
-
C. Bai and C. Zhou, “Ground effects on the aerodynamics of a wing with slot type distributed propulsion system for VTOL applications,” International Journal of Turbo and Jet-Engines, Vol. 40, No. s1, pp. s583–s595, Jan. 2024, https://doi.org/10.1515/tjj-2022-0065
-
Y. Zhang, D. Xu, and X. Zheng, “The design of phugoid mode stabilization in angle of attack protection control law,” in Journal of Physics: Conference Series, Vol. 2658, No. 1, p. 012018, Dec. 2023, https://doi.org/10.1088/1742-6596/2658/1/012018
-
J. Mieloszyk, A. Tarnowski, and T. Goetzendorf-Grabowski, “Designing aerodynamic devices for UAV – lessons learned,” Aircraft Engineering and Aerospace Technology, Vol. 96, No. 1, pp. 73–83, Feb. 2024, https://doi.org/10.1108/aeat-02-2023-0060
-
M. Sari, H. L. Guntur, and M. B. S. Pratama, “Normal modes study on half wing structure of N219 aircraft using computational method,” Advances in Science and Technology, Vol. 125, pp. 81–86, Mar. 2023, https://doi.org/10.4028/p-pnp9pp
About this article

The authors have not disclosed any funding.
The datasets generated during and/or analyzed during the current study are available from the corresponding author on reasonable request.
The authors declare that they have no conflict of interest.
