Abstract
At present, the use of a tuned mass damper (TMD) to control structural dynamic response under wind or earthquake excitations has become a common method for many high-rise structures. In previous studies, the amplitude of structural dynamic response which is usually viewed as a stochastic process is rarely used as a parameter to evaluate the vibration mitigation performance of a TMD system. In this paper, the motion equations of the structures controlled by a TMD system under wind excitation are established first. Then, the vibration mitigation performance of the TMD system under wind load is analyzed from the point of view of the reduction of the amplitude of response stochastic processes, during the analysis the influence of mass ratio is also taken into account. Finally, the vibration reduction coefficients are obtained as a function of frequency ratio and damping ratio, and the optimal frequency ratio and damping ratio of TMD system can be determined for which the minimum vibration reduction coefficient is achieved. The analysis results show that compared with the uncontrolled structure, the optimization method based on vibration reduction coefficient greatly reduces the amplitude of structure response under wind load and has certain adaptability and reliability.
Highlights
- The motion equations of high-rise structures under controllable and uncontrollable conditions are established, and the damping coefficient of high-rise structures under wind loads is derived based on the power method.
- The optimal damping ratio, frequency ratio and vibration reduction coefficient under different mass ratios are obtained by numerical calculation.
- The dynamic response of the high-rise structure under wind load is calculated, and the feasibility of the method is verified by comparing the dynamic response difference between the uncontrolled structure and the controlled structure.
1. Introduction
High buildings will have large displacement under wind loads. The use of tuned mass dampers can reduce the structural dynamic response caused by wind loads to a certain extent, but there are some limitations. In 2021, Liu [1] predicted the TMD parameters under different wind conditions based on neural network and genetic algorithm. In the same year, Zhang et al. [2] proposed to optimize structure – TMD system parameters by using the average value obtained from the stochastic analysis method of energy consumption power flow. Although there have been some research on structural vibration control, the amplitude of stochastic process has not been tried as the optimization target of control research. Therefore, in order to fill the gap of this method and solve the problem of random vibration of high-rise buildings under wind load, this paper, aiming at a 33-story high-rise residential building structure with a total height of 99.85 meters as an example, establishes the motion equation of high-rise structures under controlled and uncontrolled conditions, and deduces the vibration reduction coefficient of the high-rise structures under wind load based on the power method. Based on this optimization objective, the optimal TMD parameters are obtained. Through numerical calculation, the optimal damping ratio, frequency ratio and vibration reduction coefficient under different mass ratio are obtained. Finally, the dynamic response of high-rise structures under wind load is calculated, and the feasibility of this method is verified by comparing the difference of dynamic response between uncontrolled structures and controlled structures [3].
2. TMD vibration reduction control under wind load
2.1. Vibration of multi-degree-of-freedom system under wind excitation
The motion equation of the multi-degree-of-freedom (MDOF) system under wind excitation is given by:
where[M], [C] and [K] are the mass, damping and stiffness matrix of the structure respectively;{¨x(t)}, {˙x(t)} and {x(t)} are acceleration, velocity and displacement vectors respectively; {P(t)} is the wind force vector; w0 is the basic wind pressure; μsi is the body shape coefficient at the ith particle; α is the ground roughness index; μR is the ground roughness correction coefficient. The surface roughness of class A to D is 1.284, 1.000, 0.544 and 0.262 according to related design codes of China, and Ai is the windward surface area.
2.2. Vibration of MDOF system with TMD under wind excitation
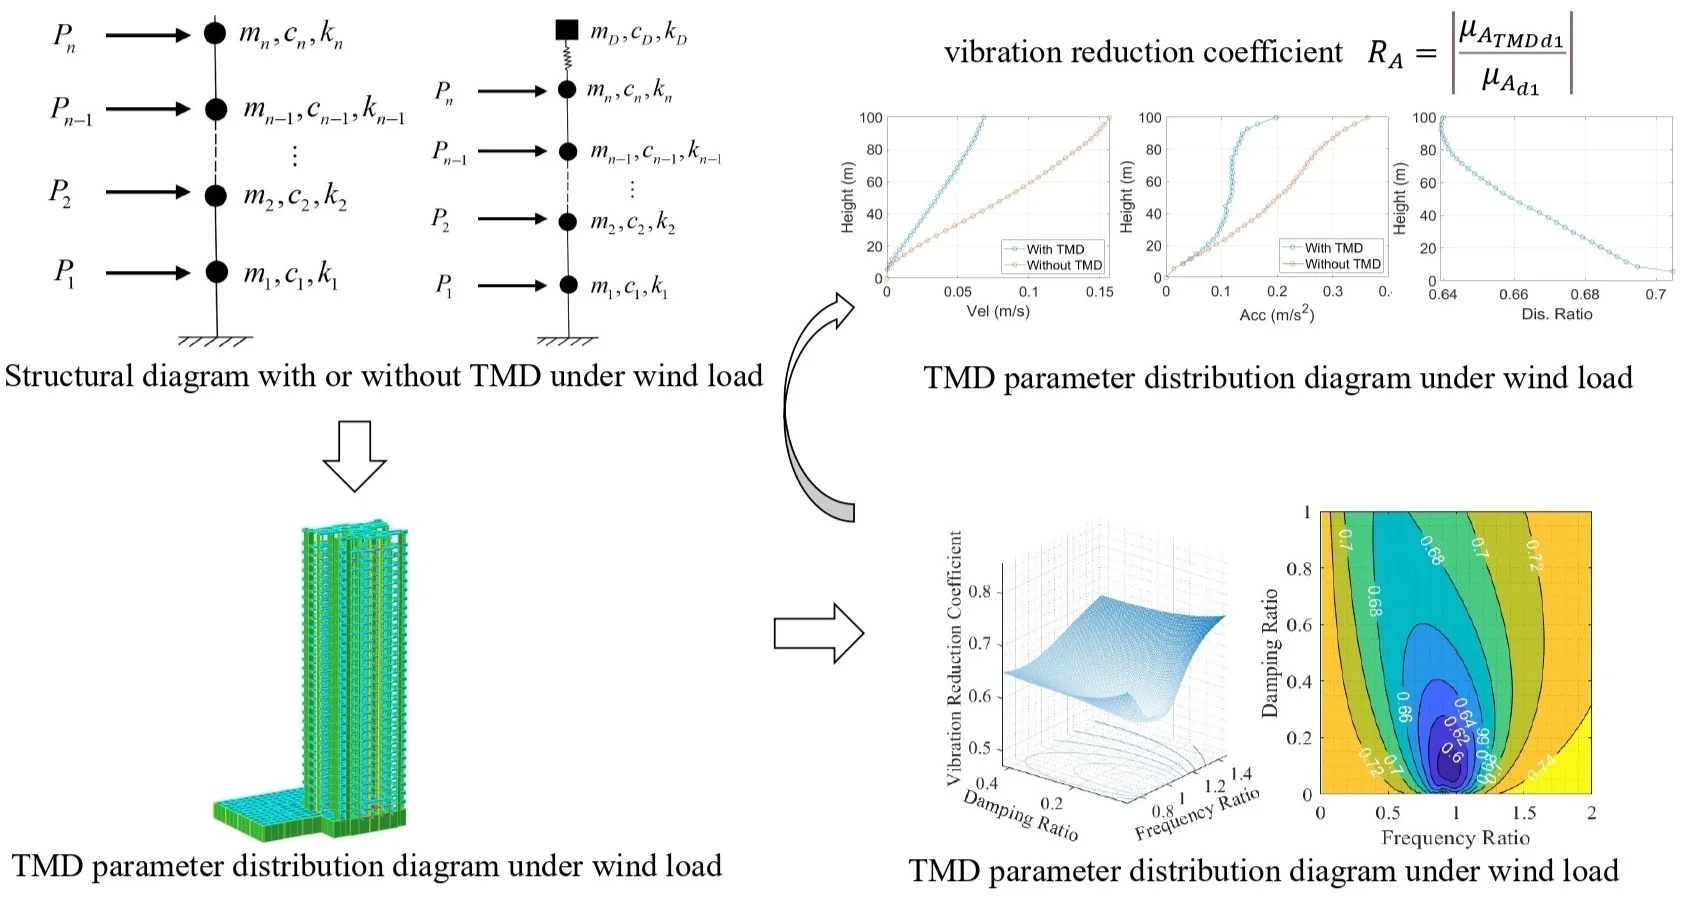
In this paper, TMD is used to reduce the vibration response of high-rise structures and installed on the top of high-rise buildings. The building structure is simplified into n lumped masses, and its motion form under wind load is shown in Fig. 1.
Fig. 1Schematic diagram of structure with TMD under wind load
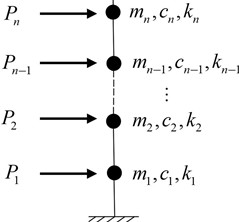
a) Simplified structural model without TMD
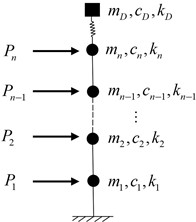
b) Simplified structural model with TMD
In order to facilitate subsequent analysis, considering that the structure is in linear elastic state, under the action of wind load P(t), the motion equation of the high-rise structure with TMD can be expressed as:
where M, C and K are the mass matrix, damping matrix and stiffness matrix of the high-rise structure respectively. x=[x1,x2,…,xn]T, ˙x=[˙x1,˙x2,…,˙xn]T, ¨x=[¨x1,¨x2,…,¨xn]T are respectively the displacement, velocity and acceleration of each lumped mass relative to the ground; xD, ˙xD and ¨xD are the displacement, velocity and acceleration of TMD relative to the top of the high-rise structure, respectively; P(t)=[P1(t),P2(t),…,Pn(t)]T is the excitation under wind load; I=[0,0,1]T is the position column vector of TMD.
In order to facilitate the modal decomposition of Eqs. (1) and (2), take x=ΦTq, ˙x=ΦT˙q, ¨x=ΦT¨q, where Φ is the mode vector and q is the generalized coordinate. Since the TMD system mainly controls the first mode of the structure, the first mode of the mode considered for Eq. (1) is as follows:
where r=ΦT1I/M*1 and multiply both ends of the above equation right by Φ1 at the same time, and divide by the generalized mass of the first mode M*1=ΦT1MΦ1:
In Eq. (6), ξ1=ΦT1CΦ1/2M*1ω1 is the damping ratio of the first mode of the high-rise structure, and ω1=√ΦT1KΦ1/M*1 is the frequency of the first mode. P*1(t) is the generalized wind load of the first order mode, and P*1(t)=ΦT1Pi(t), where Φ1i is the mode shape component of the first order mode corresponding to the ith lumped mass, and Pi(t) is the wind load corresponding to the ith lumped mass.
Similarly, the first mode vector is introduced to the right end of Eq. (4) ¨x=ΦT1¨q1 to obtain:
Assume that β=ΦT1I, and divide both ends of the Eq. (7) by md:
Then Fourier transform is performed on both ends of Eq. (6), and respectively F(q1)=Fq1(ω), F(˙q1)=(iω)Fq1(ω) and F(¨q1)=(iω)2Fq1(ω). Here FP*1(ω) is the Fourier transform of the generalized force, the following equation is obtained:
The Fourier transform is also performed on both ends of Eq. (8), and the transformation relations F(xD)=FxD(ω), F(˙xD)=(iω)FxD(ω) and F(¨xD)=(iω)2FxD(ω) are adopted. Then resulting equation is given by:
Fq1(ω) and FxD(ω) can be solved by the combination of Eq. (9) and (10), where Fq1(ω) is the Fourier spectrum of the vibration of the main structure of the high-rise structure, and FxD(ω) is the Fourier spectrum of the vibration of the TMD substructure.
Therefore, when considering the first mode of vibration of the TMD system under wind load, the power spectrum of the structure is as follows, where C1=ΦT1CΦ1:
Similarly, under wind load P(t), the motion equation of structure without TMD can be expressed as:
Assume that x=ΦTq, and similarly decompose Eq. (12) to obtain:
Then Fourier transformation is performed, and relationsF(qn)=Hqn(ω), F(˙qn)=(iω)Hqn(ω), F(¨qn)=(iω)2Hqn(ω) and F(P*n(t))=FP*n(ω) are adopted to obtain:
Therefore, the power spectrum of the structure without TMD is expressed as:
2.3. The amplitude of a random process with given power spectrum and the vibration-reduction coefficient
For a random process s(t) with given power spectrum Gs(w), its amplitude (maximum absolute value) A satisfies the probability distribution density function as given in Eq. (16), and the amplitude A can be calculated using Eq. (17) [4]:
where a=s/√λ0, ν=√λ2/λ0/π, qe=q1+b, q=√1-(λ21/λ0λ2), b=0.2, fA(s) is the probability density function of A, dFA(s)/ds=fA(s).
For the random process corresponding to the power spectrum given by Eq. (11) and (15), we use the above equations to calculate the corresponding maximum absolute value μATMDd1 and μAd1 respectively, according to which the vibration reduction coefficient RA can be calculated [5]:
RA (vibration reduction coefficient) is a function of mass ratio, frequency ratio and damping ratio. When its minimum value is achieved, it corresponds to the optimal frequency ratio and damping ratio of TMD.
3. Optimization of the TMD parameters of a high-rise building
A 33-story high-rise building in Fig. 2 is taken as an example to verify the parameter optimization method. As shown in Fig. 2, the 33-storey residential building structure is all on the ground. The height of the bottom layer is 5.6 m, the standard layer is 3 m, and the total height is 99.85 m. The concrete strength of beams and columns in each layer of the structure adopts C40, the floor adopts C30, and the floor thickness is 120 mm.
3.1. Determination of TMD optimization parameters
For the case that the mass ratio is 0.05, the vibration reduction coefficient as a function of damping ration and frequency ratio is shown in Fig. 3(a), it can be seen that it presents a downward concave shape, which indicates the optimal solution for TMD parameters. Moreover, when the damping is relatively small and the frequency ratio is close to 1, it can be found that the vibration reduction coefficient will be greater than 1, which indicates that simply increasing the damping ratio cannot achieve better vibration reduction effect. It might actually cause larger vibration. As can be seen from the isoline of vibration reduction coefficient in Fig. 3(b), the same law exists. The closer the parameter is to the optimal one, the more obvious the vibration reduction effect will be. When the optimal parameters of TMD are obtained, the optimal damping ratio and the optimal frequency ratio are 0.100 and 0.96, respectively, and the corresponding vibration reduction coefficient is 0.6846.
Fig. 2High-rise building structure
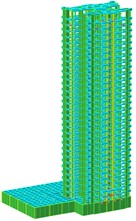
Fig. 3TMD parameter distribution diagram under wind load
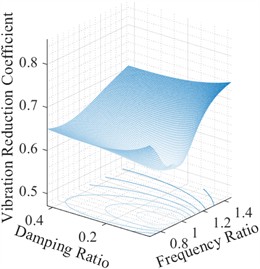
a) Three-dimensional diagram of vibration reduction coefficient
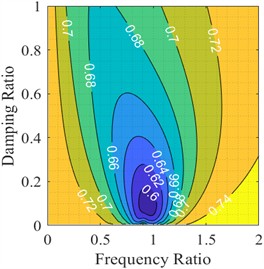
b) Isogram of vibration reduction coefficient
According to Table 1, when the mass ratio of TMD is changed, it can be seen from the four different mass ratios of 0.01, 0.03, 0.05 and 0.07 that the optimal damping ratio basically increases with the increase of the mass ratio, reaching the maximum value of 0.10 when the mass ratio is 0.05, and the optimal frequency ratio also reaches the maximum value of 0.96 when the mass ratio is 0.05. The results obtained were compared with those obtained by the classical optimization formulas such as J. P. Den Hartog and H. C. Tsai et al. [6]. Compared with the vibration reduction coefficient 0.7260 obtained by the classical optimization method, the vibration reduction coefficient obtained by the optimization method was lower, 0.6846, indicating better vibration reduction effect.
Table 1Comparison of optimization results of different mass ratios
Mass ratio | Optimal frequency ratio | Optimal damping ratio | Vibration reduction coefficient | Vibration reduction coefficient by Den Hartog and Tsai’s power method |
0.01 | 0.99 | 0.05 | 0.6604 | 0.6085 |
0.03 | 0.93 | 0.08 | 0.6198 | 0.8135 |
0.05 | 0.96 | 0.10 | 0.6846 | 0.7260 |
0.07 | 0.93 | 0.07 | 0.6183 | 0.6639 |
3.2. Analysis of the effect of the power method of TMD
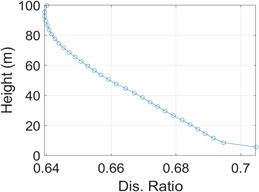
In order to further understand the optimal parameters and vibration reduction performance of TMD, the optimal damping coefficient is obtained when the mass ratio is 0.05. Taking the controlled structure as an example, according to the conditions given in Eq. (2), 20 sets of wind load time-history data are generated, and the corresponding dynamic response of the structure is calculated by time-history analysis method. In Fig. 4, the average value of maximum displacement and maximum acceleration velocity of each layer of the structure under 20 groups of wind load input and the ratio of maximum displacement response of each layer before and after setting TMD are listed.
It can be seen from Fig. 4(a) that the maximum displacement along the height direction of the high-rise structure increases with the increase of height. The maximum displacement of the top of the structure without TMD and with TMD is 0.118 m and 0.075 m, respectively. When the optimal TMD parameters are adopted, the maximum displacement at the top of the high-rise structure decreases by 36.44 %. As can be seen from Fig. 4(b), the maximum acceleration is 0.20 m/s2, and the maximum acceleration of non-TMD structure is 0.36 m/s2, which decreases by 44.4 %. Fig. 4(c) shows that the damping effect of the top layer after TMD installation is 0.64 when TMD is not installed.
Fig. 4TMD parameter distribution diagram under wind load
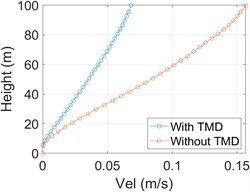
a) The maximum displacement along the height of the structure
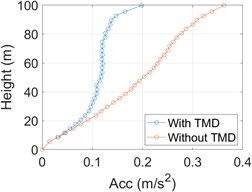
b) Maximum acceleration along the height of the structure
c) Column displacement ratio before and after TMD installation
4. Conclusions
1) The equations of motion of controlled and uncontrolled high-rise structures are established, and the equations of vibration reduction coefficient under random excitation are obtained, as well as the optimal damping ratio, frequency ratio and corresponding vibration reduction coefficient under different mass ratios.
2) When the TMD mass ratio is 0.05, the optimization effect of column displacement under wind load is the best. TMD has the best constraint effect on the top displacement of the structure, and the constraint effect of non-TMD structure is 0.64.
3) The simplified model is used for research, but the limitation is that the structural complexity and local effects are ignored, so the results are not as fine as the precise model. However, the simplified model is more effective in determining the optimization of structural schemes, with low cost and high efficiency.
4) In this paper, wind loads are applied to the structure in a random process. Stochastic finite element is also an analysis method considering randomness, but it is more suitable for reliability analysis and less used in structural design, so deterministic structure is used in this paper.
References
-
Z. Liu, Y. Wang, X. Hua, H. Zhu, and Z. Zhu, “Optimization of wind turbine TMD under real wind distribution countering wake effects using GPU acceleration and machine learning technologies,” Journal of Wind Engineering and Industrial Aerodynamics, Vol. 208, No. 167-6105, p. 104436, Jan. 2021, https://doi.org/10.1016/j.jweia.2020.104436
-
S. R. Zhang et al., “Structural TMD damping control analysis based on power method,” (in Chinese), Journal of Disaster Prevention and Mitigation Engineering, Vol. 41, No. 3, pp. 573–585, 2021.
-
X. X. Li et al., “Parameter optimization and vibration reduction performance analysis of TMD system based on power method,” (in Chinese), Journal of Vibration and Shock, Vol. 33, No. 17, pp. 7–17, 2014.
-
A. D. Kiureghian, “On response of structures to stationary excitation,” University of California, USA, 1979.
-
A. D. Kiureghian, “Structural response to stationary excitation,” Journal of the Engineering Mechanics Division, Vol. 106, No. 6, pp. 1195–1213, 1980.
-
H. J. P. den, Mechanical Vibrations. New York, USA: McGraw Hill, 1956.
About this article
The authors have not disclosed any funding.
The datasets generated during and/or analyzed during the current study are available from the corresponding author on reasonable request.
The authors declare that they have no conflict of interest.

