Abstract
Accurate and efficient damage detection in long-term health monitoring for structures still encounters many difficulties due to the effect of environment. Furthermore, recorded big data requires efficient damage detection algorithm. In this study, an efficient and effective damage detection algorithm is proposed using transmissibility along with Mahalanobis distance and Hotelling T-square. A numerically simulated beam and an experimentally tested laboratory structure are used to validate the proposed algorithm. Results demonstrate good performance of the proposed technique in damage detection.
1. Introduction
Structural health monitoring (SHM) has been a research focus in the past years, and transmissibility has attracted a lot of attention due to its characteristic in avoiding the requirement of measuring excitation. Transmissibility has been applied to damage detection, localization, quantification and response/excitation reconstruction [1-5].
Even numerous research outputs have been developed, early damage alarming and detection still encounters difficulty in long-term SHM for real engineering applications. This is because minor damage does not cause large changes in structural dynamic responses. For long-term SHM, previous researches concentrated on the outlier detection by using several models such as statistical models, discriminant analysis and so on [6-8], while few works paid attention to the efficiency, especially in transmissibility based SHM.
In this study, an easy but efficient, widely applicable transmissibility based damage detection methodology is proposed. Prior to damage detection procedure, transmissibility estimation approaches are reviewed and discussed in order to pave the way for the damage detection algorithm. Next, a dual-step damage detection procedure based on using Mahalanobis distance and Hotelling T square is developed. For verification purpose, numerical analysis and experimental validation are employed. The main contribution of this study is to introduce a less time-consuming damage detection methodology by illustrating the differences between Mahalanobis distance and T-square from an efficiency perspective.
2. Theoretical background
2.1. Transmissibility estimation
For a harmonic applied force at a given coordinate of a linear elastic system, the transmissibility between one point i and j is defined as:
where Xi and Xj are the complex amplitudes of the responses, xi(t) and xj(t), respectively, and ω is the natural frequency.
Transmissibility can be estimated by choosing another reference node, for instance P, i.e. transmissibility can be derived as:
where T(i,j)(ω) is also called the power spectral density transmissibility (PSDT) [9]. In this study, the transmissibility is estimated using Eq. (2). The choice of P in Eq. (2) may influence the results, and this has been addressed in reference [3]. One possible selection of P is discussed in details in reference [2].
2.2. Relation between Mahalanobis distance and Hotelling T-square
Mahalanobis distance, as a measure of distance between a point and a distribution, was introduced by Mahalanobis [10] in 1930. Mahalanobis distance takes the correlations of the data sets into consideration, and gives a better classification than Euclid distance.
Mahalanobis distance (MD): For two independent data sets U, V, it is defined as:
Mahalanobis squared distance (MSD) is written as:
where ∑-1 means the inverse covariance of the baseline, herein it is ˉV, which denotes the sample mean matrix, i.e. the centroid of data set V, and U denotes the testing vector, ‘()T’ indicates that the vector should be transposed. In this study, U and V mean transmissibility estimated under damaged condition and intact condition.
In order to overcome the deficiency of high computational cost, one may use Hotelling T-square, which can be considered as partially averaged MSD. This can significantly reduce the computation. Hotelling T-square was first proposed by Harold Hotelling (1931) [11].
Hotelling T square: For the two data sets described above, the Hotelling T-square is defined as:
where ˉU means the averaged data sets. Herein, note that the testing matrix is averaged for each segment. This will extremely reduce the computational time.
3. Damage detection methodology
3.1. Damage sensitive feature
Modal Assurance Criterion (MAC) is used to estimate the change of structural dynamic properties by measuring the transmissibility based MSD and Hotelling T-square. The indicators are demonstrated as MSD assurance criterion (MSDC) and Hotelling T-square assurance criterion (TSAC):
where MSDd and HTdrepresent MSD and Hotelling T-square for damaged structure, respectively; while MSDu and HTu denote the MSD and Hotelling T-square for intact structure, respectively. [ωL,ωH] means the frequency band chosen for analysis. The choice of the frequency band in Eqs. (6) and (7) depends on the engineer’s experience. It is worth mentioning that the noise contaminated part should be avoided in this choice. This has also been addressed in references [2, 3].
3.2. Damage detection procedure
The damage detection procedure will be divided into two stages, namely stage 1 (fast detection) and stage 2 (exact detection). Details description of both stages is given as follows:
Stage 1: Fast detection. In this stage, all the scenarios are averaged in three scenarios and the averaged scenarios are analyzed using Hotelling T Square. Herein, note that the intact pattern is only set in the beginning as baseline, and without any change or modification if the loading and boundary conditions are the same for all scenarios. Note that in this stage, as all the scenarios are averaged, the computational time will be much less than in case if all original data was analyzed. Furthermore, when the minor damage is detected, the damaged scenarios are not all originally measured scenarios. One needs to identify the exact scenario in the original measurements.
Stage 2: Exact detection. In this stage, the key idea is to identify which damage scenario is the exact one. Note that in this stage, the damage detection procedure is almost the same as Stage 1, with only one difference is that herein MSD replaces the T-square, while the baseline is the same as before.
In summary, this damage detection procedure intends to reduce the computational time, while it also keeps the exact damage detection capability. Note that to decide on the averaging length is a key issue depending on the engineering’s experience, and it may greatly affect the results. In order to show the rapidness of the proposed damage detection procedure, MSD based detection for all damage scenarios is used for comparison.
4. Numerical analysis
4.1. Model description
A two-sided simply supported beam is simulated and analyzed as shown in Fig. 1(a). The beam is discretized with 20 elements and 21 nodes, which are labeled as 1, 2,…, 21, from left to right. Fig. 1(b) shows a possible occasion of single-damage scenario. A double-damage scenario means two elements are damaged. A unit force is applied at node 9 with spectrum along frequency domain [0, 1000] (Hz). The material properties of the beam are as follows: density = 2700 Kg/m3, dimensions = 1000×50×6 mm, Poisson’s ratio = 0.3, damping ratio = 0.002 and elastic modulus = 70 GPa. Damage is modeled by stiffness loss, i.e. only stiffness reduction based damages are considered [12].
In order to show the performance of the rapid dual-step damage detection procedure, 300 scenarios (#1 to #300) are generated by Latin Hypercube sampling (LHS). Scenarios #1 to #50 under intact state are introduced using random maximum 2 % Gaussian white noise, while scenario #51 to #100 are introduced using random maximum 5 % Gaussian white noise, which are used to model operational conditions. And #101 to #200, #201 to #300 are single- and double-damage scenarios, respectively. Note that noise is not considered for these damaged scenarios.
Fig. 1A schematic diagram of the simply supported beam

a) Intact state

b) Single-damage scenario
4.2. Results and discussions
In order to validate and illustrate the applicability of the proposed approach, the aforementioned damage detection procedure is conducted and the obtained results are shown in the next subsections.
4.2.1. Damage detection by MSD
As for comparison, MSD based damage detection is firstly derived. Fig. 2 shows the MSDC calculated for the 300 scenarios. Herein, note that in Figs. 2 to 4, ‘Zone I’ means MSDC for intact scenario with 2 % Gaussian white noise; and ‘Zone II’ means MSDC for intact scenario with 5 % Gaussian white noise; ‘Zone III’ means MSDC for single-damage scenarios, and ‘Zone IV’ means MSDC for double-damage scenarios.
Fig. 2MSDC for all the damage scenarios and noisy cases
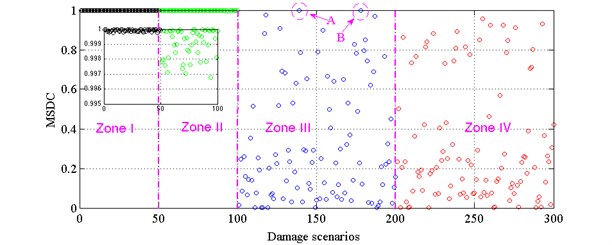
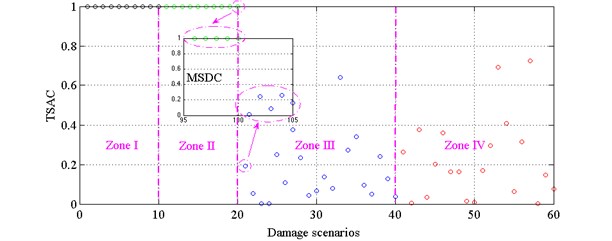
Fig. 3TSAC for all folded scenarios and MSDC for unfolded scenarios
From Fig. 2, one can find the following: (i) It is easy to identify the damages in most single and double-damage scenarios. However, for single-damage scenarios, two damage scenarios (denoted by ‘A’ and ‘B’) failed to be detected; (ii) For damage scenarios ‘A’ (#139) and ‘B’ (#178), the damage severities are 1.09 % in element 19 and 0.4 % in element 12, respectively. For less damage severities, it is challenging for MSDC to detect the damage; (iii) As the MSDC is based on MAC, if a monotonically changing range of MSD is chosen, MSDC might be used for quantify the damage in a relative manner. It should be noted that the severity of damage is defined by a stiffness reduction, i.e. 1 % damage = 1 % stiffness loss.
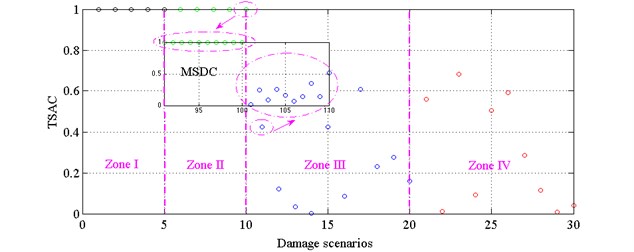
Fig. 4TSAC for all folded scenarios and MSDC for unfolded scenarios
4.2.2. Comparison between rapid damage detection procedure and MSD based detection.
Figs. 3 and 4 demonstrate the dual damage detection procedure taking the average of each five and each ten damage scenarios, respectively. From Fig. 3, it is concluded that: (i) TSAC can detect all damage scenarios, and it also gives a clear separation between noise-contaminated responses and damage induced responses; (ii) In MSDC part, by unfolding the two averaged damage scenarios, then one can find the exact early damage scenario (#101); (iii) Dual step damage detection procedure in Fig. 3 performs better than the MSDC based damage detection procedure in Fig. 2, as rapid dual step damage detection procedure performs successfully in all the damage scenarios in an efficient manner.
From Fig. 4, it is observed that: (i) When ten damage scenarios are averaged, the total number of damage scenarios decreases from the original number of 300 to 30. This suggests that the consumed calculation time will be much less than before; (ii) Even though the scenarios are averaged, by using the rapid damage detection procedure, all the damage scenarios are successfully detected. By unfolding the averaged scenario around damage occurrence scenario (#10 and #11 in Fig. 4), one can find that the damage scenario in the original scenarios (#101 in the MSDC small figure window) is clearly identified.
4.2.3. Computational time of MSD based and rapid damage detection procedure
Table 3 shows a computational time comparison between three different damage detection procedures shown in Figs. 2 to 4. Note that the computational time herein only contains the damage detection procedure from the response and the dynamic simulation time is not included. From Table 1, it is obvious that: (i) Rapid damage detection procedure consumes much less computational time than MSD based damage detection procedure; (ii) The more scenarios averaged in the analysis, the less computational time consumed. Herein, one issue should be taken into account is that to choose the number of scenarios for averaging depends on the amount of data and the engineer’s experiences.
Table 1Computational time comparison for each procedure
Damage detection procedure | Results | Average length | Computational time |
MSD based detection procedure | Fig. 2 | 1 scenario | 116.2605 s |
Rapid detection procedure | Fig. 3 | 5 scenarios | 69.2843 s |
Fig. 4 | 10 scenarios | 36.7778 s |
5. Experimental verification
5.1. Structure description
In order to validate the proposed rapid damage detection procedure using real experimental data, a four-story and two-bay by two-bay steel frame scale model structure shown in Fig. 5 (American Society of Civil Engineers (ASCE) benchmark problem) [13] is used. Details about the experimental set-up can be found in [14-16]. Different damage levels are modeled using adding additional mass, changing braces or loosening bolts at the beam-column connections. Three different types of excitation are modeled [17]. The various damage levels are indicated in Table 2 [16]. One of the reasons why we considered this example for validation of our damage detection technique, is that this benchmark has been widely used in the literature and previous researches have proved its well performance. In this study, the experimental data obtained using a hammer in Phase II is used.
Fig. 5Model of the benchmark structure [16]
![Model of the benchmark structure [16]](https://static-01.extrica.com/articles/19718/19718-img6.jpg)
Table 2Test scenarios description [16]
Damage scenario | Case description |
#1 | All braces* |
#2 | Missing all east side braces |
#3 | Case #2 + remove one brace on floor 1 |
#4 | Case #3 + remove one brace on floor 3 |
#5 | Case #4 + loosen one connection |
#6 | Remove all braces, tighten loosen connection |
#7 | Case #6 + loosen one connection |
#8 | Case #7 + loosen second connection |
#9 | Reattach beam & repeat Case #6 |
* Case A is the only test in which the mass is symmetrically distributed. All other cases have additional mass on the 1st and 2nd floors | |
5.2. Results and discussion
Figs. 6 and 7 show MSDC and TSAC calculated for all the scenarios considered in Table 2, respectively. From the Fig. 6, one can find that: (i) All damage scenarios can be detected via MSDC. However, it is challenging to determine the damage quantitatively from the MSDC as various damage patterns are presented. (ii) Comparing damage scenario ‘#6’ and ‘#9’, theoretically speaking, they should be the same, however, some differences occur. This might be caused by the operational variability or systematic error. (iii) If all the damages caused by braces modification, i.e. damage scenario ‘#2’, ‘#3’, ‘#4’, ‘#5’, ‘#6’ and ‘#9’, it will be difficult to draw out a general conclusion to quantify damage. Hence, further investigation should be conducted to give a better understanding. (iv) In Fig. 7, each three damage scenarios are averaged, so that the nine damage scenarios are combined as three new damage scenarios. From Fig. 7, it is clear that damage is successfully detected as damage occurs in the first damage scenario (#1), while TSAC decreased in the second damage scenario (#2). Then, by unfolding the damage scenario, one can find that damage occurs in the second scenario (#2 in MSDC in Fig. 7).
Table 3 shows the computational time of MSD based damage detection procedure and rapid damage detection procedure. It can be observed that rapid damage detection procedure consumes less time than MSD based damage detection procedure. However, due to the small number of damage scenarios, the rapid damage detection procedure did not save much time than MSD based damage detection procedure.
Fig. 6MSDC for all damage scenarios
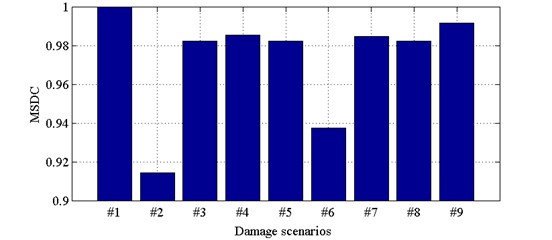
Fig. 7TSAC for all damage scenarios
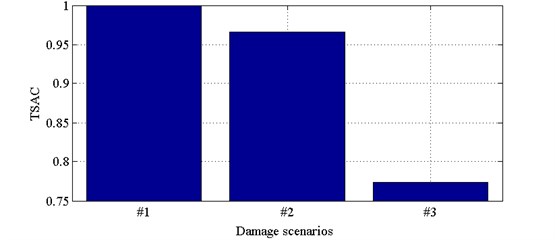
Table 3Computational time comparison
Damage detection procedure | Results | Average length | Computational time |
MSD based detection procedure | Fig. 6 | 1 scenario | 90.9597 s |
Rapid detection procedure | Fig. 7 | 3 scenarios | 86.9573 s |
6. Conclusions
This study developed an output based dual-step damage detection procedure using transmissibility incorporated with Mahalanobis distance and Hotelling T square for detecting structural damages in a fast manner at an early stage. Hotelling T square is an estimation for one time segment and therefore the detecting probability is reduced. However, at a second stage, Mahalanobis distance based damage detection procedure guarantees the detection of damage. For comparison reason, MSD was set for comparison with the rapid damage detection procedure. Simply supported beam was analyzed numerically for checking the feasibility of the proposed damage detection methodology. Furthermore, a benchmark of an experimental laboratory-scale structure was used to verify the proposed approach. Both results demonstrated the well performance of the damage detection procedure and showed its promising future for large data analysis, which might be used in real-time SHM. The key improvement for this study is to address an efficient and effective damage detection algorithm for potential long-term SHM.
References
-
Chen Q., Chan Y. W., Worden K., Tomlinson G. R. Structural fault detection using neural networks trained on transmissibility functions. Proceedings of the International Conference on Vibration Engineering, Beijing, China, 1994, p. 456-646.
-
Zhou Y. L. Structural Health Monitoring by Using Transmissibility. Ph.D. Thesis, 2015.
-
Zhou Y. L., Figueiredo E., Maia N. M., Perera R. Damage detection and quantification using transmissibility coherence analysis. Shock and Vibration, Vol. 2015, 2015, p. 290714.
-
Maia N. M. M., Almeida R. A. B., Urgueira A. P. V., Sampaio R. P. C. Damage detection and quantification using transmissibility. Mechanical Systems and Signal Processing, Vol. 25, Issue 7, 2011, p. 2475-2483.
-
Lage Y. E., Maia N. M. M., Neves M. M. Force magnitude reconstruction using the force transmissibility concept. Shock and Vibration, Vol. 2014, 2014, p. 905912.
-
Figueiredo E., Radu L., Worden K., Farrar C. R. A Bayesian approach based on a Markov-chain Monte Carlo method for damage detection under unknown sources of variability. Engineering Structures, Vol. 80, 2014, p. 1-10.
-
Figueiredo E., Park G., Farrar C. R., Worden K., Figueiras J. Machine learning algorithms for damage detection under operational and environmental variability. Structural Health Monitoring, Vol. 10, Issue 6, 2011, p. 559-572.
-
Figueiredo E., Park G., Figueiras J., Farrar C., Worden K. Structural Health Monitoring Algorithm Comparisons Using Standard Data Sets. Los Alamos National Laboratory (LANL), Los Alamos, NM (United States), 2009.
-
Yang W. J., Ren W. X. Operational modal parameter identification from power spectrum density transmissibility. Computer-Aided Civil and Infrastructure Engineering, Vol. 27, Issue 3, 2012, p. 202-217.
-
Mahalanobis P. C. On tests and measures of group divergence. Journal of the Asiatic Society of Bengal, Vol. 1930, 26, p. 541-588.
-
Hotelling H. The generalization of Student’s ratio. Annals of Mathematical Statistics, Vol. 1931, Issue 2, 3, p. 360-378.
-
Zhou Y. L., Wahab M. A., Perera R., Maia N., Sampaio R., Figueiredo E. Single side damage simulations and detection in beam-like structures. Journal of Physics: Conference Series, Vol. 628, Issue 1, 2015, p. 012036.
-
IASC-ASCE SHM Task Group. /http://bc029049.cityu.edu.hk/asce.shm/wp_home.asps, 2010.
-
Johnson E. A., Lam H. F., Katafygiotis L. S., Beck J. L. A benchmark problem for structural health monitoring and damage detection. Proceedings of the 14th Engineering Mechanics Conference ASCE, Austin, Tex, USA, 2000.
-
Johnson E. A., Lam H. F., Katafygiotis L. S., Beck J. L. Phase I IASC-ASCE structural health monitoring benchmark problem using simulated data. Journal of Engineering Mechanics, Vol. 130, Issue 1, 2004, p. 3-15.
-
Dyke S. J., Bernal D., Beck J. L., Ventura C. An experimental benchmark problem in structural health monitoring. Proceedings of the 3rd International Workshop on Structural Health Monitoring, Stanford, Calif, USA, 2001.
-
ASCE Benchmark Group. http://wusceel.cive.wustl.edu/asce.shm/benchmarks.htm.
About this article
The first author thanks CWO (Commissie Wetenschappelijk Onderzoek), Faculty of Engineering and Architecture, Ghent University for providing financial support for a research stay at Soete Laboratory.

