Abstract
In this paper, we present a new application based on Genetic Algorithm (GA) to detect damage in 3D frame structures. Finite Element Method (FEM) is used to build models for intact and damaged structures. The identification of damage is formulated as an optimization problem using GA and the changes in natural frequencies. A 3D frame structure with two floor is used, as a numerical example, for damage identification. The proposed method is then applied to identify some removed elements. The results obtained using FEM is validated using experimental benchmark test of a 3D frame structure with eight floors. The results show that the proposed technique gives good damage identification compared with literature [1]. Furthermore, there is no error recorded in the prediction of location, however a small error is recorded in detecting damage severity. It is concluded that GA is an efficient tool to quantify single and multiple damages with high precision in 3D frame structures.
1. Introduction
In the last years, Genetic Algorithm (GA) has been recognized as a promising intelligent artificial technique for difficult optimization problems. GA is considered to be more efficient than classical methods because it is based on precise results. Sazonov et al. [2] used strain energy mode shapes to determine the changes in structural integrity from changes in the vibrational response of a structure using (GA) to produce a sufficiently optimized amplitude characteristics. The detection of structural damage is an inverse problem in structural engineering. In this problem, it is very important to determine the existence, location and extent of the damage. This problem is formulated as an optimization problem, which is then solved using GA [3].
To identify damage using GA, three objective functions were used [2, 4], i.e. a) the changes in natural frequencies, b) Modal Assurance Criterion (MAC) and c) MAC in the frequency domain. In these references, GA based on the strain energy mode shapes was used and a finite element model was constructed to generate training data. The results obtained from GA were efficient and confirmed with the theoretical predictions. Radzieński et al. [5] used only the changes of natural frequencies without mode shapes as the measurements of frequencies were much less time consuming in comparison with the measurements of mode shapes. The benchmark problem on structural health monitoring strategy was applied to vibration data generated with an analytical model of a benchmark structure [6, 7]. The subject of the experimental benchmark problem was the 4-story, 2-bay by 2-bay steel-frame scale-model structure by Dyke et al. [8]
It has been shown that the proposed technique was suitable for damage localization in beam-like structures. The investigations of damage detection and localization based on modal parameters and the combination of natural frequency and mode shape were widely utilized [9-19]. The structural damage detection and localization was defined as a permanent change in the mechanical state of a structural material or component that could potentially affect their performance [20]. Rizos et al. [21] presented a method based on amplitudes of two points of a cantilever beam vibrating at one of its natural modes to identify crack location and depth. Damage detection and localization in thin plates based on vibration analysis using BAT algorithm was presented by Khatir et al. [22]. A comparison between a frequency based and a mode shape based method for damage identification in beam like structures has been published by Kim et al. [23]. A new frequency domain technique was introduced for modal identification of output-only systems, in the case where the modal parameters must be estimated without knowing the input excitation of the system. This technique was applied to two-storey building model [24]. The FE model of a multi-story frame with rotational stiffness at joints under earthquake excitation for structural health monitoring was investigated by Lei et al. [25].
The classical optimization methods are fast, but they suffer from big limitations related to the continuity of the objective function, e.g. the Hessian of the objective function, which might not be positive-defined in all points during optimization, and the substantial possibility of getting a local optimum, which strongly depends on starting point [26]. Genetic Algorithm (GA) [27] and the Particle Swarm Optimization (PSO) [28] are well-known as optimization techniques that are free from the above mentioned restrictions. The new conception of natural frequency vector (NFV) and natural frequency vector assurance criterion (NFVAC), a new damage detection method using the natural frequencies as damage was introduced by Yang [1].
In this study, a GA approach is used for damage detection and localization in 3D complex frame structures by minimizing the objective function, which is based on the changes in natural frequencies. The damage detection algorithm is investigated in case of removed frame elements. The approach is validated using experimental benchmark test from literature.
2. Optimization problem
Genetic algorithm is developed by Holland [29]. In this optimization method, information about a problem, such as variable parameters, is coded into a genetic string known as an individual (chromosome). In this study, the numbers of chromosome presented in two elements are: a) the presence of removed elements and b) the locations of removed elements. Each of these individuals has an associated fitness value, which is usually determined by the objective function to be minimized. Genetic algorithm is used as inverse problem and can be coupled with FEM of 3D structure. It has been shown that to be able to solve the optimization problem through mutation, crossover and selection operation should be applied to individuals in the population (see Fig. 1). In this study, we address the problem for damage detection by removing beam elements from 3D frame structures. As mentioned above, in GA approach, each of the 100 individuals contains two chromosomes representing damage parameters. The maximum number of iteration was set equal to 100. After several applications, a crossover coefficient of 0.8 and mutation of 0.1 were used in the GA parameters.
3. Numerical example
A simulated 3D frame structure, as shown in Fig. 2, is used to verify the proposed technique. The frame model is divided into ten beam elements with 6 DOFs for each node, as explained in section 3.1. The properties of the beam element are listed in Table 1.
Fig. 1Flowchart for damage detection in 3D Structures
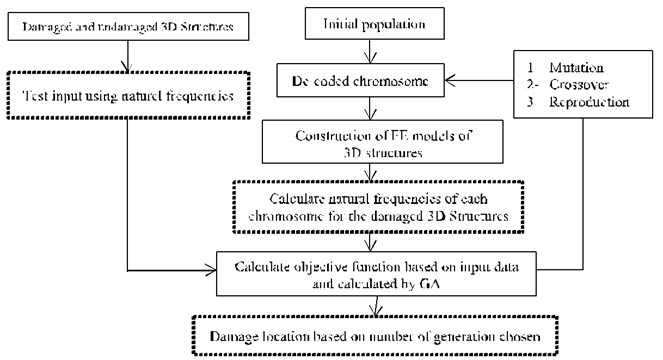
Fig. 2The finite element model of the 3D frame structure used in the numerical example
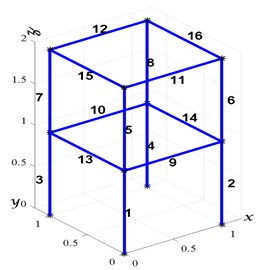
Table 1Geometric and mechanical properties
Cross- section area [m2] | Young’s modulus [N/m2] | Density [kg/m3] | Moment of inertia [m4] |
0.5×10⁻³ | 2.1×10¹¹ | 7800 | 0.417×10⁻⁸ |
3.1. Finite element analysis of 3D frame elements
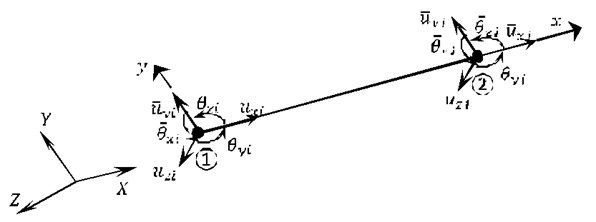
In the 3D frame element, we consider in each node, 6 degrees of freedom (6 DOFs), as shown in Fig. 3, namely three displacements and three rotations with respect to the three global Cartesian axes; , , .
Fig. 33D frame element with 6 DOFs per node
In the local coordinate system, the stiffness matrix, 12×12, of the 3-D frame element is given by:
where and , is the cross-sectional area, the torsional constant, , and are the second moments of inertia with respect to the local axes and , respectively, and is Poisson’s ratio.
The mass matrix is evaluated according to the consistent formulation and is given in an explicit form with respect to the element coordinate system as:
where is the mass density, and is the radius of gyration. After transformation to the global axes, the stiffness and mass matrices in global coordinates are obtained as:
where the transformation matrix is defined as:
where angles , , and , are measured from global axes , , and , with respect to the local axis x, respectively.
The dynamic behaviour of a linear mechanical structure is governed by the following equation:
Ignoring damping and external force terms, Eq. (4) can be written as:
where and are real symmetric matrices, which are discretized as follows:
Let:
where vector is , the frequency , and the phase can be determined.
Differentiating Eq. (7) twice with respect to time, gives:
Substituting Eqs. (7) and (8) into Eq. (5), gives:
For a nonzero or a nontrivial solution of :
Which will be a polynomial equation of degree in . Eq. (9) can also be written as:
Or:
Eq. (12) clearly indicates that and are an eigenvalue and eigenvector of the matrix , respectively. In addition, Eq. (11) suggests that and are generalized eigenvalues and eigenvectors of the stiffness matrix with respect to the mass matrix .
3.2. Objective function
In this paper, we use the natural frequencies as diagnostic parameters in the structural assessment procedures. One great advantage of using only eigenvalues in the damage assessment of structures is that they are cheaply acquired and the approach can provide an inexpensive structural assessment technique. The objective function to be minimized is defined as follows [30]:
where: is the mode number ( 1, 2, 3, …, ), is the measured natural frequencies and is the calculated natural frequencies. The are the natural frequencies, which are applied to our damage detection system as inputs. An objective value of zero indicates an exact match between the values of measured and calculated frequencies.
3.3. Damage scenarios
In order to validate the proposed damage assessment technique, four damage scenarios are considered, in which single damage, as well as, multiple damage cases are studied as shown in Table 2 (see the 3D frame structure in Fig. 2). In Table 2, element numbers, where the stiffness is reduced, are listed along with and the percentage of reduction (between parenthetic). The naturel frequencies of each damage scenario are presented in the Table 3.
Table 2The 3D frame structure damage scenarios
Damage scenario | Damaged element (% reduction in bending stiffness) | ||||
D1 | 4 (30 %) | – | – | – | – |
D2 | 9 (20 %) | 10 (35 %) | – | – | – |
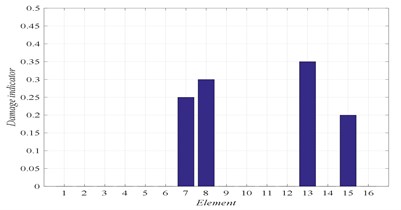
D3 | 7 (25 %) | 8 (30 %) | 13 (35 %) | 15 (20 %) | – |
D4 | 3 (25 %) | 5 (30 %) | 7 (30 %) | 13 (25 %) | 15 (35 %) |
Table 3Naturel frequencies of undamaged and damaged 3D frame structure
Mode | Undamaged [Hz] | Damage scenario | |||||||
D1 | D2 | D3 | D4 | ||||||
[Hz] | % | [Hz] | % | [Hz] | % | [Hz] | % | ||
1 | 107.723 | 105.364 | 2.2 | 103.629 | 3.8 | 107.563 | 0.1 | 105.624 | 1.9 |
2 | 142.545 | 136.840 | 4.0 | 142.545 | 0.0 | 140.895 | 1.2 | 136.232 | 4.4 |
3 | 159.732 | 155.896 | 2.4 | 159.177 | .03 | 158.688 | 0.7 | 155.898 | 2.4 |
4 | 435.371 | 433.476 | 0.4 | 416.140 | 4.4 | 426.295 | 2.1 | 422.780 | 2.9 |
5 | 484.670 | 475.107 | 2.0 | 471.982 | 2.6 | 481.979 | 0.6 | 474.043 | 2.2 |
6 | 586.661 | 583.594 | 0.5 | 586.654 | 0.0 | 548.766 | 6.5 | 527.674 | 11.1 |
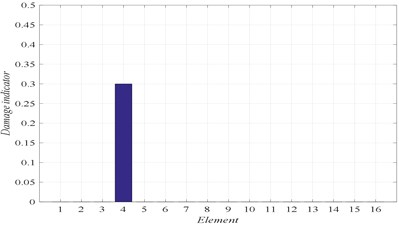
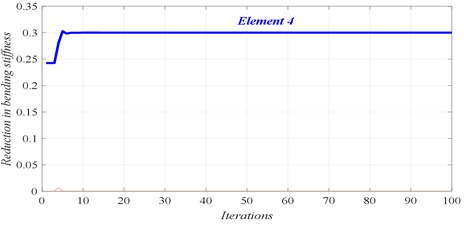
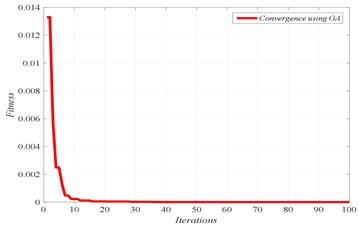
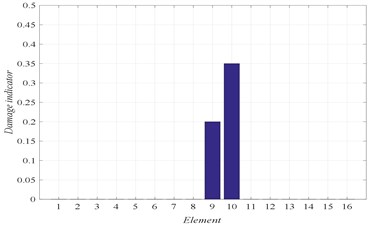
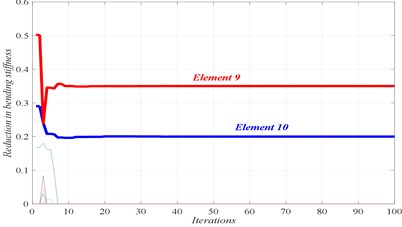
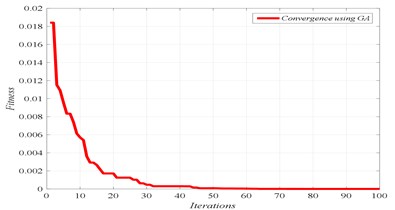
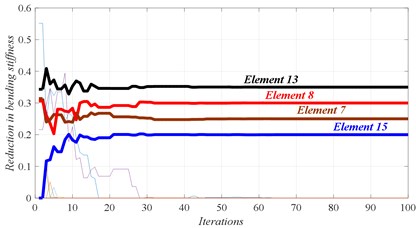
The first six natural frequencies, listed in Table 3, are utilized in this case for all damage scenarios to calculate the fitness, and consequently the damage locations and their severities. The identified results are shown in Figs. 4 to 7, for the different damage scenarios.
Fig. 4Damage scenario D1
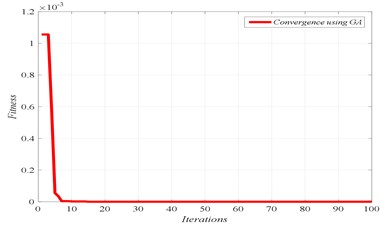
a) Convergence of fitness
b) Damage identification of location and severity
c) Convergence of damaged element
In Figs. 4 to 7, three graphs are plotted: a) Convergence of fitness, b) Damage identification of locations and severities and c) Convergence of damaged elements. For the single damage scenario, D1, it can be seen in Fig. 4 that the algorithm is converged after few iterations and the damage location and severity are correctly identified. Similarly, for multiple damage scenarios, scenarios D2 to D4, all damage locations and severities are correctly found. However, as the number of damage elements increases, the number of iterations increases and the convergence becomes slower. For damage scenario D4, more than 70 iterations are required in order to reach convergence, as it can be seen in Fig. 7.
Fig. 5Damage scenario D2
a) Convergence of fitness
b) Damage identification of locations and severities
c) Convergence of damaged elements
Fig. 6Damage scenario D3
a) Convergence of fitness
b) Damage identification of locations and severities
c) Convergence of damaged elements
Fig. 7Damage scenario D4
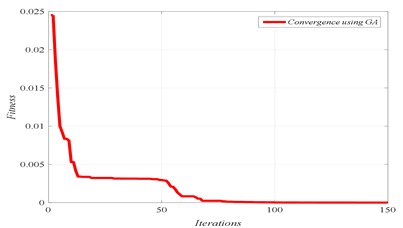
a) Convergence of fitness
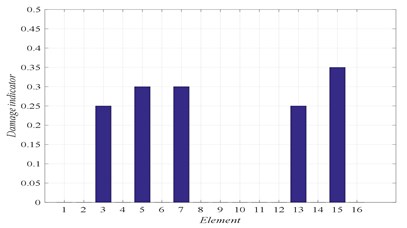
b) Damage identification of locations and severities
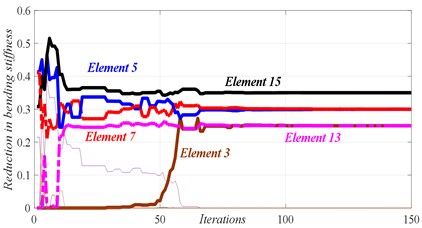
c) Convergence of damaged elements
3.4. Effect of noise
In order to investigate the effect of noise on our damage detection technique, White Gaussian noise was added into damage scenario D2 and D4 in the first six modes with 5 % and 10 %. The th noisy response (noise), is simulated by [15]:
where is the noise level and is a random number in the interval [−1, 1]. From the results shown in Fig. 8, we can observe that, when the noise is included in the problem of fault detection, our approach based on GA can detect damage with high accuracy. However, the severity of damage is affected by the level of noise.
Fig. 8Damage location for scenarios D2 and D4 with noise level 5 % and 10 %
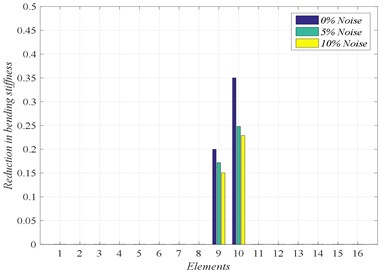
a) Damage scenario D2
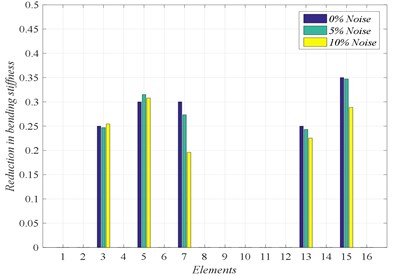
b) Damage scenario D4
4. Experimental validation
In order to validate the proposed technique, experimental benchmark test of an eight-story shear frame is used from literature [1]. The eight-story frame and the experimental set-up are shown in Fig. 9. In this experimental setup, the frame was excited using a MB Modal 50A electromagnetic exciter driven by a sweeping sine signal generated by a GW GFG-8019G signal generator and amplified by a MB SS250VCF amplifier. The vibration responses were measured using PCB 3330B accelerometers and sampled using a DIFA/S CADAS acquisition system. The first six frequencies were identified in this case. Two local damages were assumed to be located at the 54th and 63rd elements. The damage was introduced by removing elements. The finite element model of the eight-story shear frame is shown in Fig. 10. The calculated natural frequencies are compared with the ones obtained from the experimental model [1] in Table 4. The dimension of each beam is 139 mm × 27 mm × 1 mm. The damage is introduced by removing one beam element. The frequencies of undamaged 3D frame model are presented in the Table 4. The loss of rigidity was obtained by multiplying the rigidity matrix by rigidity coefficients [0-1] in Section 3. However, in this section, the damage is simulated by removing elements, therefore the rigidity coefficient is equal to 0.
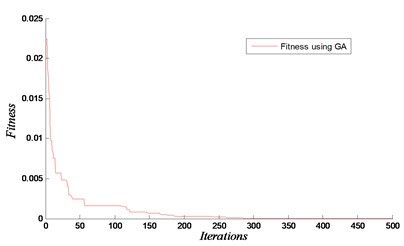
The results are shown in Figs. 11-13 for the considered damage cases. Damages have been identified accurately in both locations. In this analysis, the maximum number of iteration is set equal to 500 with 1000 population. The proposed technique based on GA and FEM is efficient to determine the removed element. The results show that our approach using the natural frequencies of damaged 3D frame structure can detect damage with high accuracy.
Fig. 9The experimental eight-story frame [1]
![The experimental eight-story frame [1]](https://static-01.extrica.com/articles/18571/18571-img18.jpg)
Table 4The frequencies of damaged and undamaged 3D frame model
Mode | 1st | 2nd | 3rd | 4th | 5th | 6th |
FEM | 2.577 | 7.635 | 12.418 | 16.732 | 20.425 | 23.371 |
Measured | 2.364 | 7.457 | 11.953 | 16.203 | 20.078 | 23.123 |
Fig. 10The FE model of the 8-story shear frame
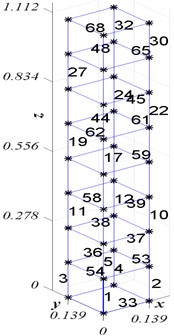
Fig. 11Convergence and loss of rigidity for the case of removing element 54
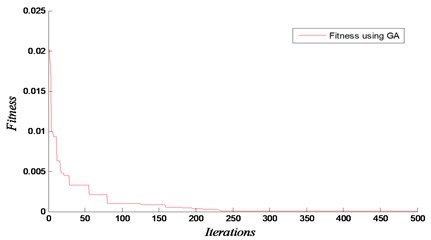
a)
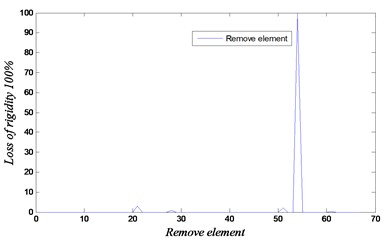
b)
Fig. 12Convergence and loss of rigidity for the case of removing element 63
a)
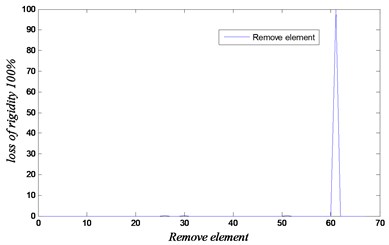
b)
Fig. 13Convergence and loss of rigidity for the case of removing elements 54 and 64
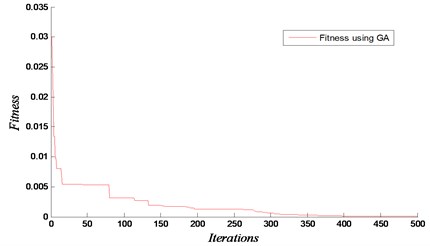
a)
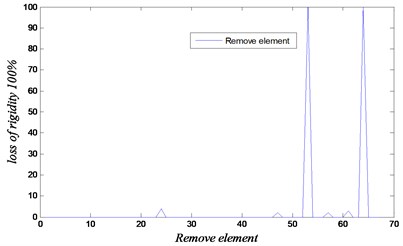
b)
5. Conclusions
In this article, a method for inverse problem is proposed in order to quantify damage in 3D complex frame structure. The proposed technique based on GA coupled with FEM and the objective function is defined as the difference between calculated by GA and measured natural frequencies. The results show clearly that the proposed methodology can be used to quantify damage in case of single, as well as, multiple damage scenarios. From the numerical example, in which noise was considered, the comparison between the estimated and real damage illustrated the efficiency of the algorithm in damage detection. In the last section, we validated our technique using experimental benchmark test from literature, in which damage was introduced by removing elements. Good results were obtained.
References
-
Yang Z., Wang L. Structural damage detection by changes in natural frequencies. Journal of Intelligent Material Systems and Structures, Vol. 21, Issue 3, 2010, p. 309-319.
-
Sazonov E., Klinkhachorn P., Halabe U. Genetic algorithms-based parameter optimization of a non-destructive damage detection method. Proceedings of the 34th Southeastern Symposium on System Theory, 2002.
-
Chou J.-H., Ghaboussi J. Genetic algorithm in structural damage detection. Computers and Structures, Vol. 79, Issue 14, 2001, p. 1335-1353.
-
Khatir S., et al. Genetic algorithm based objective functions comparative study for damage detection and localization in beam structures. Journal of Physics: Conference Series, 2015.
-
Radzieński M., Krawczuk M., Palacz M. Improvement of damage detection methods based on experimental modal parameters. Mechanical Systems and Signal Processing, Vol. 25, Issue 6, 2011, p. 2169-2190.
-
Johnson E., et al. A benchmark problem for structural health monitoring and damage detection. Proceedings of International Symposium on Engineering Mechanics, 2001.
-
Johnson E. A., et al. Phase I IASC-ASCE structural health monitoring benchmark problem using simulated data. Journal of Engineering Mechanics, Vol. 130, Issue 1, 2004, p. 3-15.
-
Dyke S., et al. An experimental benchmark problem in structural health monitoring. Proceedings of the 3rd International Workshop on Structural Health Monitoring, 2001.
-
Alvandi A., Cremona C. Assessment of vibration-based damage identification techniques. Journal of Sound and Vibration, Vol. 292, Issue 1, 2006, p. 179-202.
-
Choi S., et al. Improved fault quantification for a plate structure. Journal of Sound and Vibration, Vol. 297, Issue 3, 2006, p. 865-879.
-
Zhou Y.-L., et al. Structural damage detection using transmissibility together with hierarchical clustering analysis and similarity measure. Structural Health Monitoring, 2016, https://doi.org/10.1177/1475921716680849.
-
Zhou Y.-L., Maia N., Abdel Wahab M. Damage detection using transmissibility compressed by principal component analysis enhanced with distance measure. Journal of Vibration and Control, 2016, https:// doi.org/10.1177/1077546316674544.
-
Zhou Y.-L., Abdel Wahab M. Rapid early damage detection using transmissibility with distance measure analysis under unknown excitation in long-term health monitoring. Journal of Vibroengineering, Vol. 18, Issue 7, 2016, p. 4491-4499.
-
Gillich G.-R., et al. Free vibration of a perfectly clamped-free beam with stepwise eccentric distributed masses. Shock and Vibration, 2016, https://doi.org/10.1155/2016/2086274.
-
Khatir S., et al. Damage detection and localization in composite beam structures based on vibration analysis. Mechanika, Vol. 21, Issue 6, 2015, p. 472-479.
-
Zhou Y.-L., Wahab M. A. Cosine based extended transmissibility damage indicators for structural damage detection. Engineering Structures, Vol. 2017, Issue 141, 2017, p. 175-183.
-
Gillich G. R., et al. Localization of transversal cracks in sandwich beams and evaluation of their severity. Shock and Vibration, 2014, https://doi.org/10.1155/2014/607125.
-
Abdel Wahab M., Roeck De G., Peeters B. Parameterization of damage in reinforced concrete structures using model updating. Journal of Sound and Vibration, Vol. 228, Issue 4, 1999, p. 717-730.
-
Abdel Wahab M., Roeck De G. Damage detection in bridges using modal curvatures: application to a real damage scenario. Journal of Sound and Vibration, Vol. 226, Issue 2, 1999, p. 217-235.
-
Sampaio R., Maia N., Silva J. Damage detection using the frequency-response-function curvature method. Journal of Sound and Vibration, Vol. 226, Issue 5, 1999, p. 1029-1042.
-
Rizos P., Aspragathos N., Dimarogonas A. Identification of crack location and magnitude in a cantilever beam from the vibration modes. Journal of Sound and Vibration, Vol. 138, Issue 3, 1990, p. 381-388.
-
Khatir A., et al. Damage detection and localization on thin plates using vibration analysis. International Congress on Sound and Vibration (ICSV23), 2016.
-
Kim J.-T., et al. Damage identification in beam-type structures: frequency-based method vs mode-shape-based method. Engineering Structures, Vol. 25, Issue 1, 2003, p. 57-67.
-
Brincker R., Zhang L., Andersen P. Modal identification of output-only systems using frequency domain decomposition. Smart Materials and Structures, Vol. 10, 2001, p. 3-441.
-
Lei Y., et al. Damage identification of frame structures with joint damage under earthquake excitation. Advances in Structural Engineering, Vol. 17, Issue 8, 2014, p. 1075-1087.
-
Venter G. Review of Optimization Techniques. Encyclopedia of Aerospace Engineering, 2010.
-
Gen M., Cheng R. Genetic Algorithms and Engineering Optimization. John Wiley and Sons, 2000.
-
Kennedy J. Particle Swarm Optimization, in Encyclopedia of Machine Learning. Springer, 2011, p. 760-766.
-
Holland J. H. Adaptation in Natural and Artificial Systems. an Introductory Analysis with Application to Biology, Control, and Artificial Intelligence. University of Michigan Press, Ann Arbor, MI,1975.
-
Vakil Baghmisheh M.-T., et al. Crack detection in beam-like structures using genetic algorithms. Applied Soft Computing, Vol. 8, Issue 2, 2008, p. 1150-1160.
Cited by
About this article
S. Tiachacht has carried out the research work related to the finite element analysis of the 3D frame structures and has written a part of the manuscript. A. Bouazzouni has supervised the first author for the research on finite element analysis. S. Khatir has carried out the genetic algorithm optimization, and has written a part of the manuscript. A. Behtani has contributed in the implementation of the genetic algorithm method. Y-L. Zhou has contributed in the experimental validation part of this research. M. Abdel Wahab has supervised the overall work, contributed in the research concept and revised the manuscript.
