Abstract
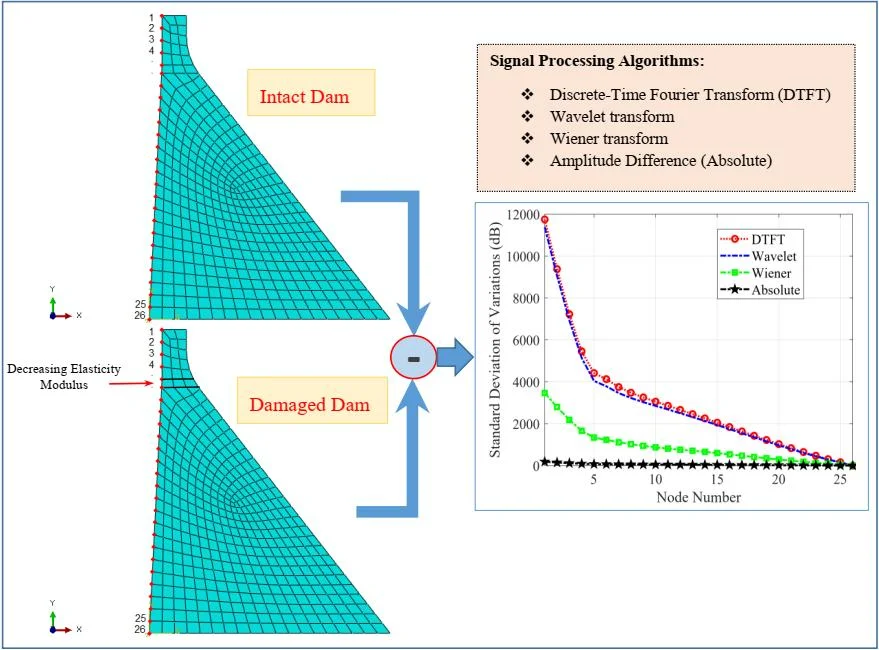
In structural engineering, damage detection in concrete gravity dams (CGDS) is a practical problem. Dam destruction can have severe financial consequences and may even lead to fatalities. Therefore, structural health monitoring in advance is crucial. In this regard, a well-known CGD, namely the Pine Flat Dam, has been chosen for the Finite Element Modeling. In this paper, damage is induced in the dam neck through elasticity modulus reduction by 40 % and 80 %. In addition, after applying Northridge earthquake, the acceleration in structure nodes for intact and damaged cases are recorded in vector formats. Using various methods, such as Discrete-time Fourier Transform (DTFT), Wavelet transform and Wiener transform, the differences between these two signals are investigated. The standard deviation (S.D.) of variations is chosen as the performance metric and is applied to the signal amplitude between intact and damage observations/signals. The reason why several signal processing algorithms are used is finding an approach which shows more clearly the differences caused by the destruction. This is evaluated via S.D. values for different algorithms. The results confirm the superiority of DTFT over other given algorithms. DTFT has a negligible outperformance (approximately zero dB) with respect to the Wavelet transform in both the crest and the lower nodes of the dam. This rate for DTFT and Wavelet is 10dB higher than that of Wiener and 35 dB in comparison with the simple amplitude difference. Moreover, the detection thresholds for the given methods are compared, and it is verified that the DTFT and Wavelet indicate the best performance.
Highlights
- Discrete-time Fourier Transform (DTFT) had the most appropriate function for damage detection
- Wavelet transform showed a close efficiency of DTFT
- The efficacy of DTFT and Wavelet was 10 db better than that of Wiener transform
- Measurements in the time domain had the efficacy around 35 db less than DTFT and Wavelet
1. Introduction
Damage in concrete gravity dams is costly. This shortcoming is often due to ignoring the codes and regulations in the phase of designing and construction principles at the time of execution, the age of the dam or incorrect maintenance of the structure. In this study, it is attempted to detect damage in CGDs with recourse to the differences between the characteristics of the intact and damaged dams via signal processing algorithms. In case minor faults are not detected in time, they can turn into major ones. Direct observation cannot always be used for damage detection in structures; therefore, other technics, such as signal processing, should be used. Signal processing algorithms are not often used in the analysis of concrete gravity dams.
To detect damage in structures, if the visible, direct observation can be helpful. However, there are often limitations which make us test these structures. These tests are divided into two categories: destructive and non-destructive. The second category is more acceptable due to the lack of damage [1]. For example, by inserting some sensors on a bridge (without causing damage to the structure) and recording the structural response using signal processing techniques (such as the Wavelet Method) under an ambient vibration, the presence or absence of damage in these structures can be realized [2].
So far, numerous researches using non-destructive techniques, such as signal processing methods, have been studied, but the investigated structures mainly consist of simple structural elements, such as frames, beams, and trusses which have much easier governing equations compared to the dams. The cause of less attention in this issue can be related to complexity in modeling and analysis and considering the interaction among different bodies as well as the high degree of freedom of the dams in comparison with other structures [3].
Cleary et al. have presented a non-mesh method for modeling of damage in gravity dams under earthquake loading. The proposed method, called Smoothed Particle Hydrodynamics (SPH), was implemented on the Koyna Dam under severe harmonic ground excitation. The results involve the formation and distribution of cracks which show a good agreement with the Finite Element Method and experimental results. Moreover, they found that the amplitude and frequency of excitation hugely affect the pattern of failure [4]. Alembagheri and Ghaemian studied the damage assessment of a concrete arch dam (the Morrow Point Dam) through nonlinear Incremental Dynamic Analysis (IDA), which includes the dam-foundation interaction. The conducted study introduces two damage indices based on Maximum Crest Displacement (DIU) and Damage Energy Dissipation (DIE). They showed that the proposed damage indices could adequately assess the damage of the dam [5].
Among all engineering structures, dams are essential and strategic resources for any government. These constructions, like all other engineering structures, have always had the possibility of failure during their lifetime and this will intensify with increasing the operational life and environmental effects, such as earthquakes. For example, minute faults inside the structure (like small cracks), if not diagnosed on time, might affect the whole body of the system and it would lead to collapsing the structure, which might create a significant loss of property and human beings [6].
A fundamental problem in Structural Health Monitoring (SHM) involves performing damage detection and isolation from a set of measured data. Typically, the number of sensors used to collect the required data is limited due to available funds, equipment, and accessibility [7].
To detect the structural damage, initial investigations in damage detection used the changes in natural frequencies as one of the fundamental properties of a dynamic system. Farrar et al. implemented the shifts in natural frequencies to identify the damage in an I-40 bridge and noted that shifts in the natural frequencies were not adequate for detecting the damage of small faults. Alternatively, as this research assumed, mode shapes (or their derivatives) could reveal the damage of a structural system [8].
Lin investigated ambient modal identification based on non-stationary correlation technique in 2016. Overall, in this paper, it was recommended that if the ambient excitation is represented by a product model with a slow time-varying function, without any additional treatment of transforming the original non-stationary responses, these responses of the system could be approximately treated as a stationary random process. Then the non-stationary crosscorrelation functions of the structural response which are evaluated at arbitrary, fixed time instants of structural responses are of the same mathematical form as those of the free vibration of a structure. From these non-stationary cross-correlation functions, modal parameters of the original system can thus be identified [9].
In an article, Xuan Kong, Chun-Sheng Cai, and Jiexuan Hu investigated different levels for identification of vibration-based damage, which consisted of anticipation of the remaining useful lifetime of structures and decision-making for appropriate actions. They offered a framework that contained several major parts, including the detection of damage occurrence via response-based methods, building reasonable structural models, selecting damage parameters and constructing objective functions with sensitivity analysis, adopting optimization techniques to solve the problem, predicting the remaining useful lifetime of structures, and making decisions for the next actions. For every part, the applied methods were reviewed, and the advantages and disadvantages were briefed for further recommendations [10].
In another paper by Giacomo Bernagozzi, Luca Landi, and Pier Paolo Diotallevi, some methods for vibration-based damage detection of civil structures were used and compared, commencing with ambient vibration data. The results of the analyses were based on a dynamic identification of the modal parameters, which was carried out in output-only conditions. The reviewed damage-sensitive features were the modal parameters, the modal flexibility matrix, and the damage-induced deflection. Due to unitary inspection loads of the identified structure, possible variations in these parameters could be adopted in order to detect, localize and quantify the damage. Furthermore, the efficacy of the various detected damage features was assessed, and the accuracy related to the identified modifications was defined through a comparison with those variations first assumed in the structural model [11].
F. Musafere, A. Sadhu, and K. Liu proposed a method with recourse to the framework of blind source separation (BSS) to detect damage time and severity. Other time-frequency decompositions, such as Hilbert transform and time-varying auto-regressive modeling were investigated to enhance source separation capability of the BSS method [12].
By a general review of the context above, it can be seen that detecting structural damage is mainly investigated on simple structural systems, like multi-story building frames, trusses, etc. In other words, due to their high degrees of freedom and complex geometry, concrete gravity dams are rarely studied in the literature. Hence, the current study aims to employ signal processing algorithms for identification of damages within this infrastructure. It seems that there are no similar studies in the field of reduction of the modulus elasticity in some elements and damage detection with signal processing algorithms such as DTFT, Wavelet, and Weiner.
The primary objective of this paper is detecting damage in concrete gravity dams using signal processing algorithms. To do so, the acceleration amounts of different nodes along the dam height have been measured for both the intact and damaged dams, and the related vectors have been recorded as intact and damaged observations respectively. The principal objective of this article is to find a way to detect any damages in the dam efficiently. To evaluate the method used qualitatively, damage detection as an efficiency indicator have been taken into account. It is worth mentioning that in many methods used in detection and estimation theories, standard deviation parameter is used as a credited evaluation indicator [13].
As a simple approach, one may calculate the differences in observation domain for intact and damaged dams for each node and case of significant differences, find the dam damaged, but as this paper shows this approach has two conspicuous drawbacks. If we take the lower nodes observations into account, we will see that in case of severe damage in the dam structure, there will be little difference between the intact and damaged dams, hardly indicating any damage. This is, of course, due to the structural stability in the lower parts. On the other hand, if the extent of damage is negligible, this detection in the structure of the dams, using this simple approach, will give poor results.
Using more frequently used algorithms in signal processing areas, such as DTFT, Wavelet, and Wiener this paper shows that the presence of damage can be detected much more accurately. In other words, the given algorithm has a higher potential for detecting the difference in the given signals. The simulation results prove the same claim. They also indicate that using the DTFT approach which studies the input signal in the frequency domain, the difference in the detection for both intact and damaged dams are much more apparent than the other approaches.
Moreover, the performance of the given approach regarding the sensitivity of the dams in case of minor damages has been evaluated. To do so, in all the four algorithms, the detection threshold in the dam structure has been calculated and compared. By detection threshold, the authors have the minimum damage in the structure in mind which is detected by each algorithm. As the simulation results indicate, the DTFT approach has the best performance.
2. Proposed finite element model
In this section, a well-known concrete gravity dam, i.e., the Pine Flat, shown in Fig. 1, is selected for the Finite Element modeling of structures in ABAQUS. For simulating the mechanical behavior of the dam, a two-dimensional Finite Element model was developed in ABAQUS software. The program was chosen due to its wide material and geometrical modeling capabilities.
Fig. 1A view of the CGD selected for modeling: the pine flat dam
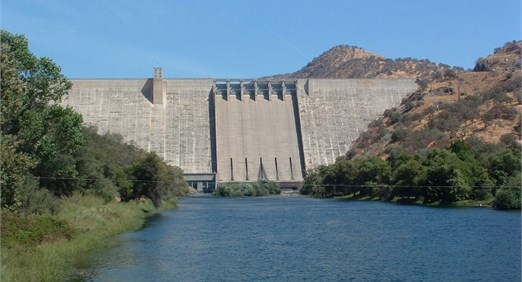
The Pine Flat is a concrete gravity dam on the Kings River in the United States. The height of the dam is about 130 m. The dam’s primary purpose is flood control, with irrigation, power generation, and recreation secondary in importance [14].
By neglecting the material nonlinearity effects and assuming the linear behavior, the mechanical properties of the mass concrete, which are supposed to be the same in both static and dynamic cases, are given in Table 1.
Table 1Material properties of the pine flat dam [15]
Quantity | Unit | Pine flat |
Density | kg/m3 | 2483 |
Modulus of elasticity | GPa | 33.558 |
Poisson’s ratio | – | 0.255 |
Moreover, the following assumptions have been made in the modeling of dam-reservoir interaction:
• A rectangular shape is considered for the reservoir, with a length three times as the height of the dam (as recommended in [16]);
• The free-board in the lake is neglected in order to model the interaction between the dam and the reservoir easily; i.e., the water level is equal to the height of the dam;
• Dam-water interaction is modeled as a type tie, where the nodes are constrained together on the interface of the two media [16];
• The transmitting boundary condition is assigned to the reservoir’s truncated far-end so that the pressure waves are not reflected in the reservoir [14];
• Zero hydrodynamic pressure is assigned to the reservoir’s free surface, and there is no absorbing boundary condition at the reservoir’s bottom [17];
• The Bulk modulus of water; Kw= 2.2 GPa;
• The density of water; ρw= 1000 kg/m3
In the modeling of the dam-foundation interaction, it is assumed that:
• There is a rigid foundation;
• There is no sliding along with the dam-foundation interface;
• The uplift pressure is not modeled in this study.
3. Damage scenario
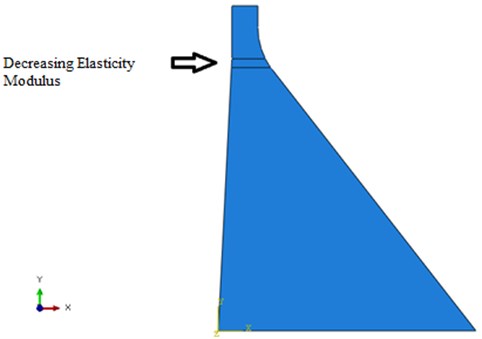
Most of the damage sustained earthquakes often occur at the neck of the dam. In the elements of the dam neck, as shown in the Fig. 2, damage occurs in the form of elasticity modulus reduction by 40 % and 80 %. The elasticity modulus is a quantity that measures the resistance of materials to being deformed. To be more precise, 0 % of destruction is categorized as intact, and any percentage of destruction is regarded as damaged.
Fig. 2Destruction of elements in the dam neck
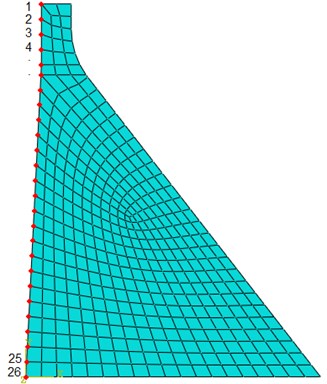
The Northridge earthquake record (Fig. 3) is applied to the heel of the dam, and the acceleration of the intact and damaged structure is extracted in 26 nodes (Fig. 4) in the upstream of the dam. It should be noted that acceleration is an essential dynamic parameter. Due to the abundance of data in this regard, some of the results have been selected and presented in the tables below.
Fig. 3The acceleration record for the Northridge earthquake
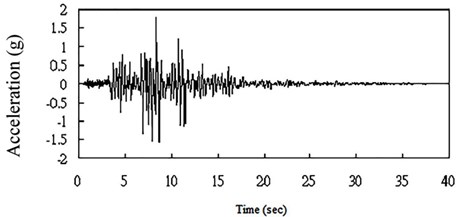
Fig. 4The numbering of the nodes in the upstream of the dam
4. Methodology
In this paper, signal processing algorithms have been implemented in MATLAB simulation environment. Furthermore, the required data related to 40 % and 80 % of destruction cases have been generated via ABAQUS.
4.1. Investigating the behavior of structure destruction in the time domain
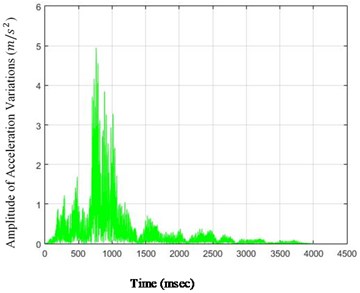
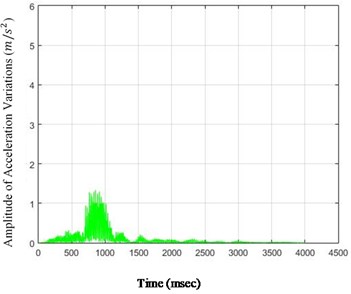
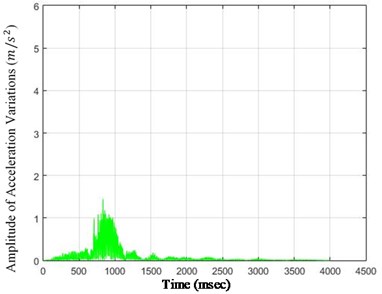
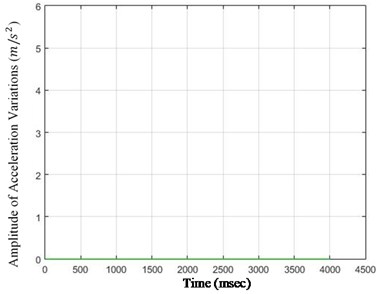
To investigate the behavior of Pine Flat dam-induced by the earthquake, on the Pine Flat Dam, various signal processing algorithms are used. Initially, the differences in acceleration after the earthquake are examined for different nodes of the structure (26 nodes). The results of 40 % destruction for the sample nodes are shown in Fig. 5.
As it is seen in Fig. 5, the effect of destruction is more distinctive on higher nodes, especially as the changes on the crest of the dam are more in comparison with those in the lower parts. The results for 80 % destruction for some sample nodes are shown in the following.
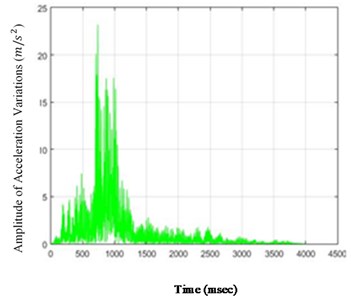
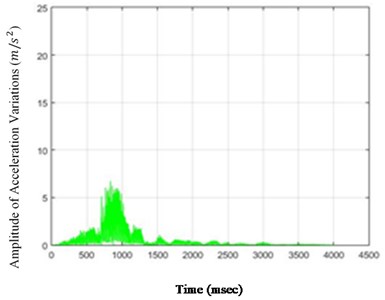
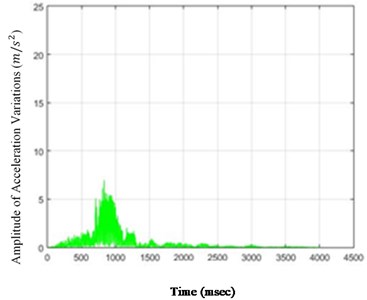
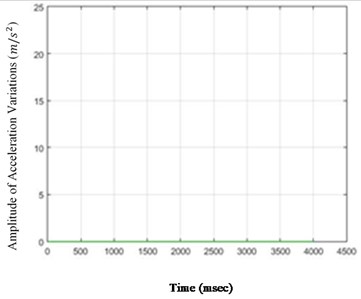
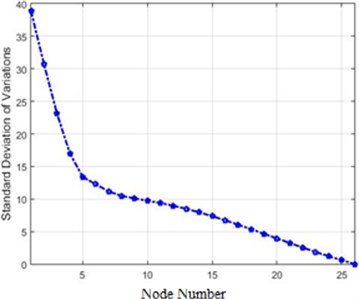
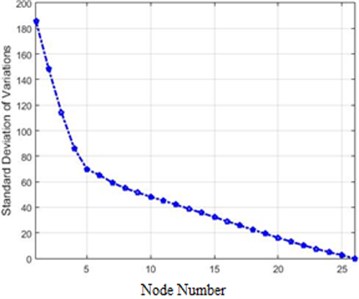
According to Fig. 5, in the case of 80 % destruction, the effect on higher nodes is still more noticeable than the lower parts of the structure. Although differences of changes in time for various nodes are obvious and, accordingly, the amount of destruction on different nodes could be compared to one another in the scenarios in this paper, these changes may not be so remarkable for each selected scenario. Therefore, to perceive the severity of the above changes, the standard deviation (square root) of the acceleration variations can be calculated and shown for the nodes of the structure. To do so, the standard deviations of the acceleration variations for different structure nodes (26 nodes) for destructions of 40 % and 80 % are shown in Fig. 6.
Fig. 5The amounts of acceleration difference before and after 40 % destruction on some sample nodes: a) node 1, b) node 5, c) node 6, d) node 26
a)
b)
c)
d)
Fig. 6The amounts of acceleration difference before and after 80 % destruction on some sample nodes: a) node 1, b) node 5, c) node 6, d) node 26
a)
b)
c)
d)
Fig. 7Standard deviations of acceleration variations for different structure nodes for 40 % and 80 % destruction: a) 40 % destruction, b) 80 % destruction
a)
b)
4.2. Investigating destruction behavior in the frequency domain via Fourier transform
Discrete-time Fourier transform for X[n] discrete-time signal is defined as [18]:
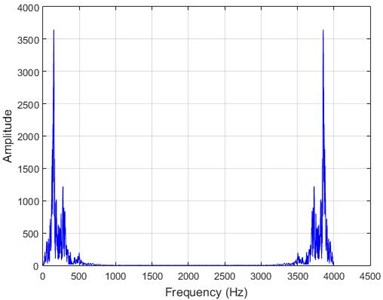
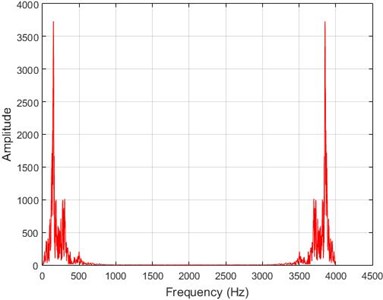
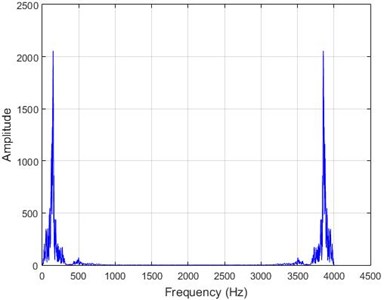
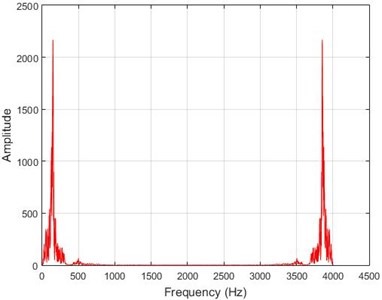
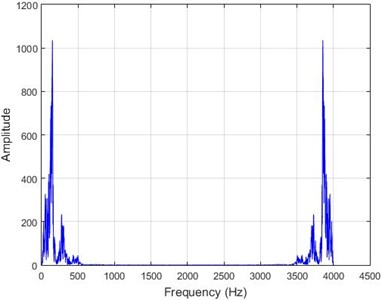
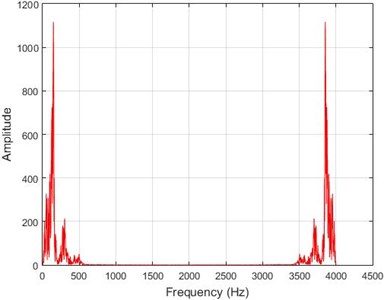
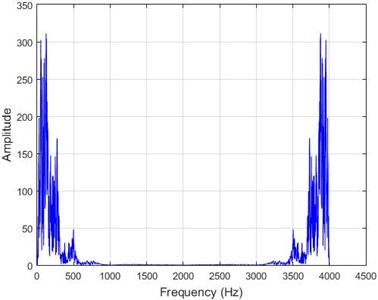
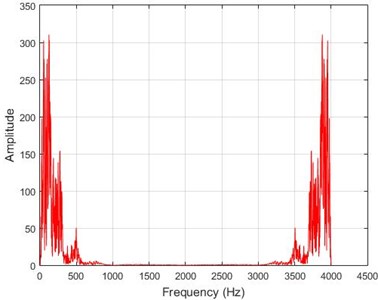
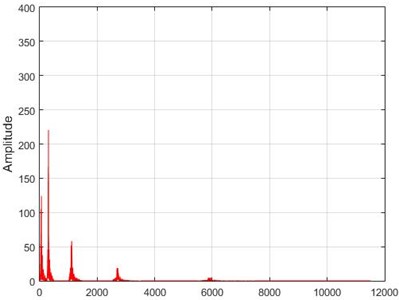
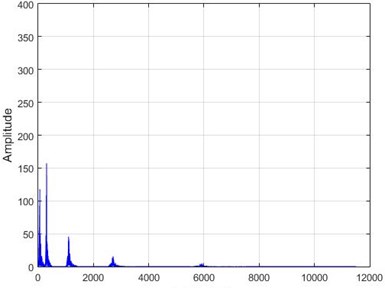
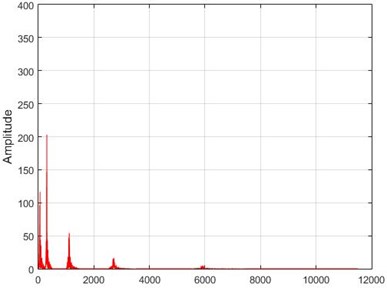
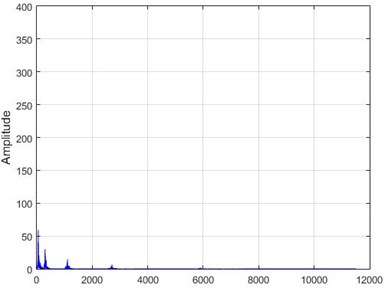
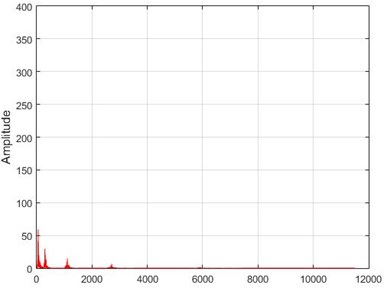
where n and f denote the time and frequency domain variables. The output function of the above equation is in the frequency domain and contains spectral features of X[n] signal in the frequency domain [18]. A common approach for monitoring the changes in time in a process is to investigate the behavior in the frequency domain. According to the Fourier theorem, each function with a limited domain can be reconstructed as a linear combination of infinite sinusoidal components with different amplitudes, phases, and frequencies. If a function has quick changes in tithe me domain, its frequency spectrum will have sinusoidal components with high frequencies, the domain of which is proportionate with that of the main changes of the function in the time domain. In this section, dam destruction by earthquake vibration in the frequency domain is investigated through Fourier transform. As an example, Fourier transform of time observations for some sample nodes, with and without the destruction, is shown in Fig. 8.
Fig. 8The results of Fourier transform on dam acceleration before and after 40 % destruction on some sample nodes
a) Node 1, damaged
b) Node 1, intact
c) Node 5, damaged
d) Node 5, intact
e) Node 10, damaged
f) Node 10, intact
g) Node 20, damaged
h) Node 20, intact
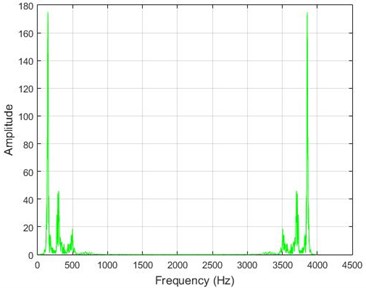
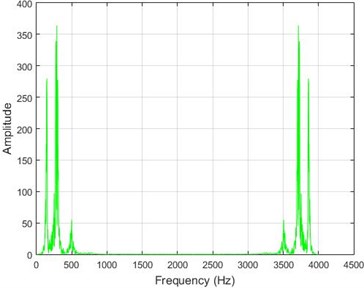
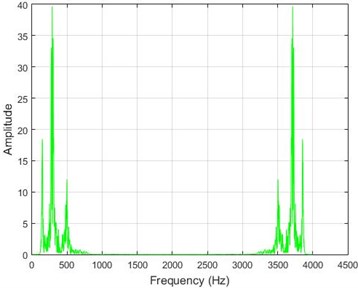
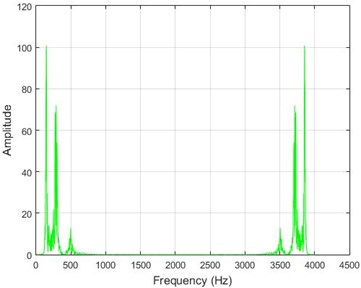
In lower nodes, the difference between the intact and damaged cases is less than that of higher nodes (especially in the crest of the dam) signifying that the effect of the earthquake on the crest is more independent of the destruction location. To investigate the differences between the intact and damaged states, differences of Fourier transform of observations before and after 40 % destruction are presented in Fig. 9.
Fig. 9The amounts of acceleration difference before and after 40 % destruction on some sample nodes. a) node 1, b) node 5, c) node 10, d) node 20
a)
b)
c)
d)
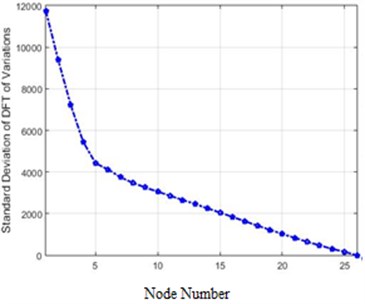
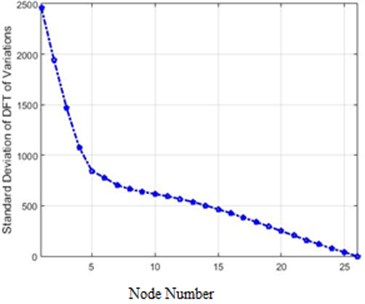
In Fig. 10 are presented the amounts of the standard deviation of acceleration differences for 26 nodes of the structure in the frequency domain for 40 % and 80 % destruction.
Fig. 10The standard deviation of acceleration differences for 26 nodes of the structure in the frequency domain for 40 % and 80 % destruction: a) 40 % of destruction, b) 80 % of destruction
a)
b)
The comparison of the two curves in Fig. 7 and Fig. 10, which represent standard deviations of 40 % and 80 % destructions in the frequency domain, clarifies that in each destruction case, the amounts of changes in the higher nodes of the structure are more than the lower ones. Furthermore, the severity of changes in 80 % destruction is more than 40 %, which was already expected. Also, the differences are independent of the destruction center (nodes 5 and 6 in this scenario), and in this structure, higher nodes face more changes due to the shape of the structure.
4.3. Wavelet transform
An arbitrary function f(t) can be characterized by a linear combination of a set of independent basis vectors (ψk) as [19]:
where αk is the kth coefficient of the linear combination; ψk is the kth vector of the space basis and N is the space dimension. The continuous Wavelet transform can be written as the inner product of the signal by a basic function as [20]:
In this equation:
where s is the scale parameter and τ is the transmission parameter. In the Wavelet transform, there is an inverse relationship between the scale parameter and frequency (s=1/f). Wavelet transform acts as a window and the signal is multiplied by the transform. In this transform, the width of the window changes parallel to the alterations of the frequency components, which is the most important feature of the Wavelet transform. Wavelet transform is well-known in signal processing and is practical in processing characteristics, such as energy concentration in a part of the signal, discontinuity, sudden variations, etc. [21]. In most cases, Wavelet is implemented via a bank filter which consists of low-pass and high-pass filters.
After Wavelet decomposition, those coefficients with small domains are mainly affected by noise, whereas more significant coefficients have more information about the signal in comparison with noise. Therefore, the substitution of small coefficients (smaller than a threshold amount) with zero and application of inverse Fourier transform cause reconstruction of the input signal with lower amounts of noise. As a result, the Wavelet transform leads to a reduction in noise (when it exists in the input data) [22].
4.3.1. Investigating destruction behavior via wavelet transform
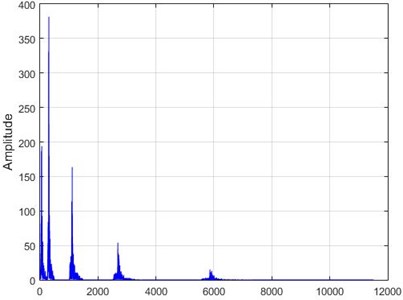
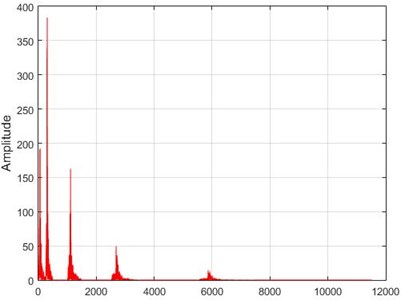
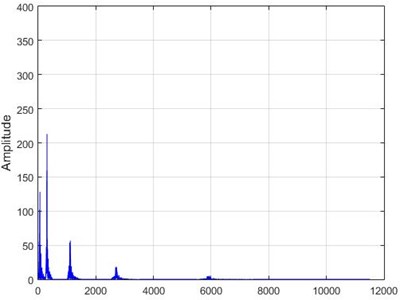
In the following figure, the results of Wavelet transform application on the dam acceleration amounts before and after 40 % destruction on some sample nodes are shown in Fig. 14.
Fig. 14The results of the Wavelet transform application on the dam acceleration amount shown before and after 40% destruction on some sample nodes
a) Node 1, damaged
b) Node 1, intact
c) Node 5, damaged
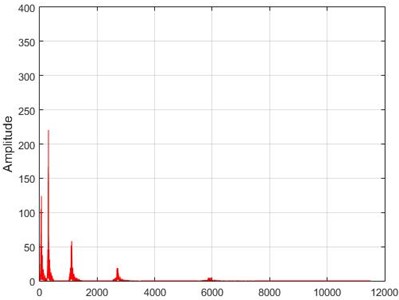
d) Node 5, intact
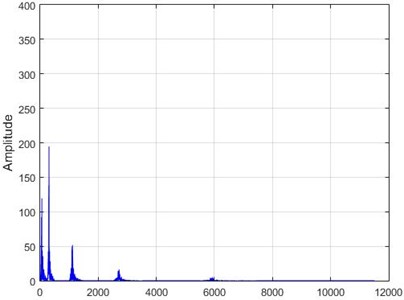
e) Node 6, damaged
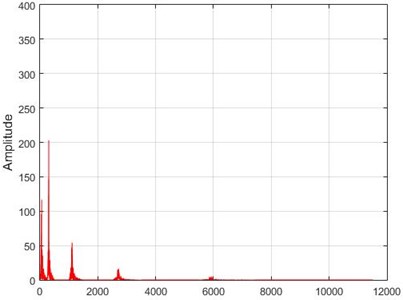
f) Node 6, intact
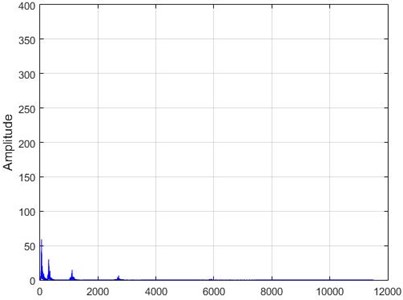
g) Node 26, damaged
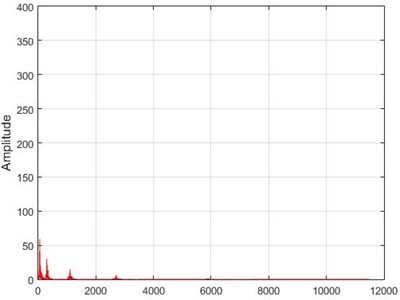
h) Node 26, intact
In Fig. 15, the results of Wavelet transform application on the dam acceleration amounts are shown before and after 80 % destruction on some sample nodes.
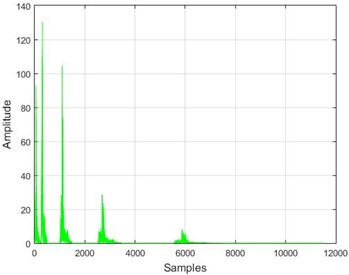
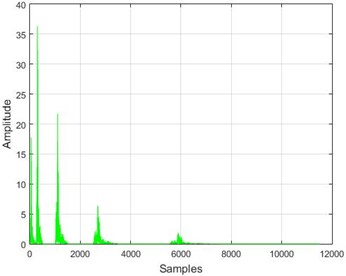
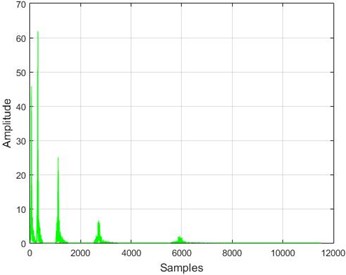
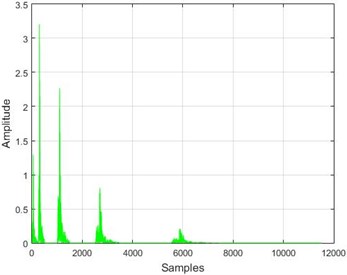
In this process, the Wavelet transform can also be obtained from the differences of the dam acceleration amounts before and after the destruction, and its results can be investigated. The outcome of this implementation for some sample nodes is shown in Fig. 16.
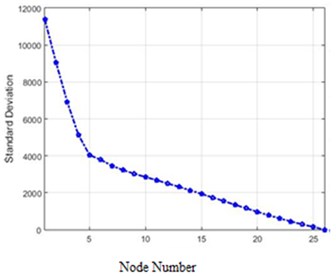
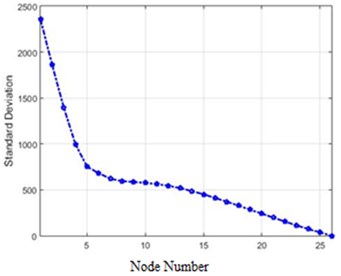
In Fig. 17, standard deviations of acceleration changes for different structure nodes for 40% and 80% destruction are shown in the field of the Wavelet transform.
Fig. 15The results of the Wavelet transform application on the dam acceleration amount shown before and after 80% destruction on some sample nodes
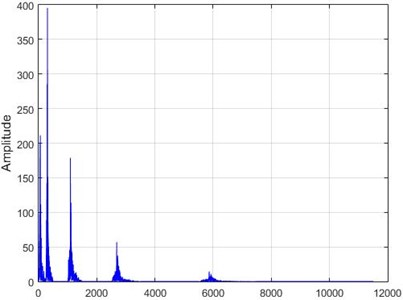
a) Node 1, damaged
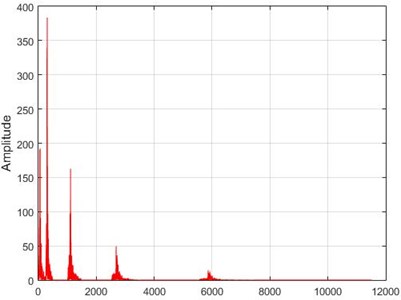
b) Node 1, intact
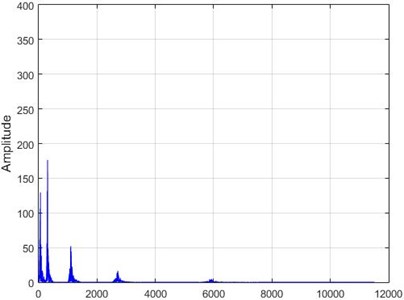
c) Node 5, damaged
d) Node 5, intact
e) Node 6, damaged
f) Node 6, intact
g) Node 26, damaged
h) Node 26, intact
4.4. Wiener filter
The relationship between Wiener filter and h[n] limited impulse response with the length of N, the coefficients of which are not zero in 0 ≤n≤N- 1 is defined as the following [18, 23]:
In the above equation, the operator shows convolution. z[n] is the variable of the new domain (after transform).
Wiener filter is applied as one, two-dimensional or more to the input signal. When the variance of the image is enormous, this filter relieves the signal fluctuations to some extent. However, in those areas of the input signals where the variance of changes is small, Wiener filter relieves the signal more. In comparison with linear filters, this method shows better results and preserves the edges of changes which are located in the higher frequencies.
Wiener filter is also called the minimum of the root mean square error. This is because the idea behind the Wiener filter is fulfilling a target function which is a function of the Mean Square Error (MSE).
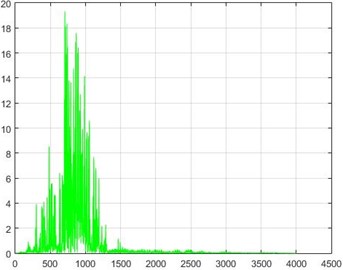
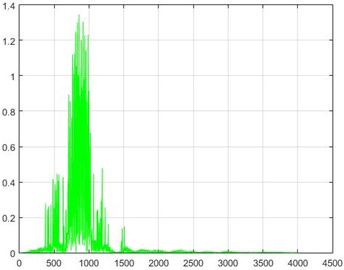
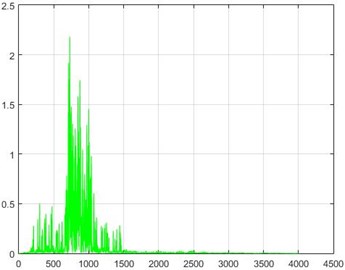
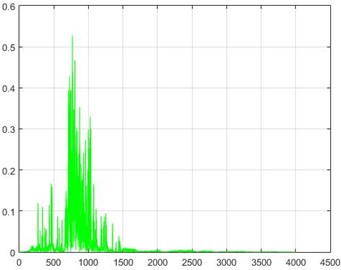
In the Wiener filter process, Wiener transforms/filter can be obtained from the differences in dam acceleration amounts before and after destruction, the results of which can be investigated. The outcome of this implementation on some sample nodes can be seen in Fig. 18.
Fig. 16The results of the wavelet transform application on the dam acceleration amounts before and after 40 % and 80 % destruction on some sample nodes
a) Node 1, 80 % destruction
b) Node 1, 40 % destruction
c) Node 5, 80 % destruction
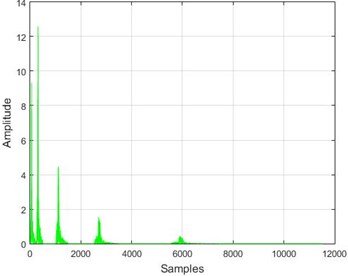
d) Node 5, 40 % destruction
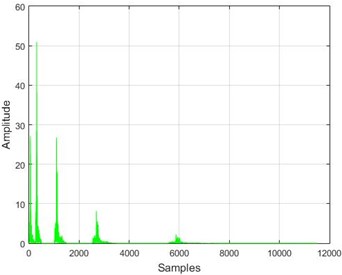
e) Node 10, 80 % destruction
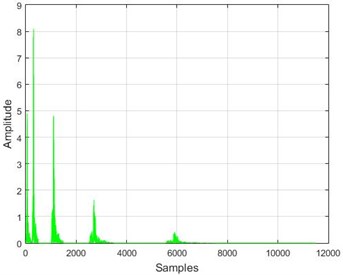
f) Node 10, 40 % destruction
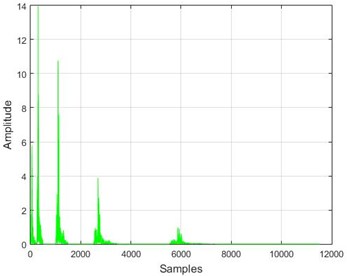
g) Node 20, 80 % destruction
h) Node 20, 40 % destruction
Fig. 17Standard deviations of acceleration changes for different structure nodes for 40 % and 80 % destruction in the field of the Wavelet transform: a) 40 % of destruction, b) 80 % of destruction
a)
b)
Fig. 18The results of the Wiener filter application on dam acceleration amounts before and after 40 % and 80 % destruction on some sample nodes
a) Node 1, 80 % destruction
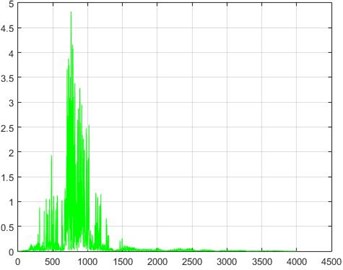
b) Node 1, 40 % destruction
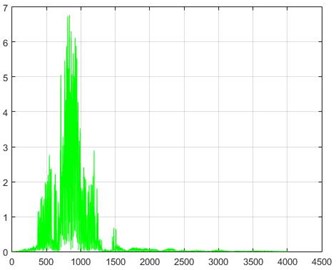
c) Node 5, 80 % destruction
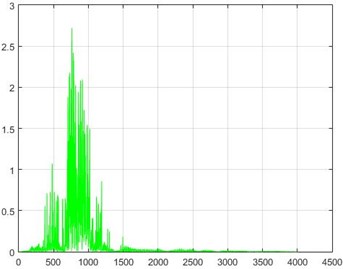
d) Node 5, 40 % destruction
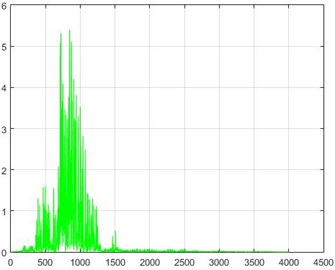
e) Node 10, 80 % destruction
f) Node 10, 40 % destruction
g) Node 20, 80 % destruction
h) Node 20, 40 % destruction
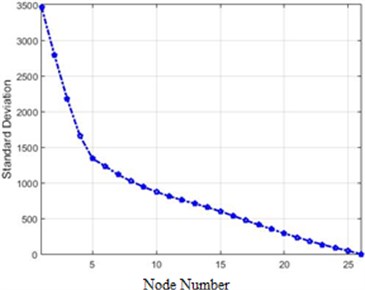
The standard deviations of acceleration changes for different nodes of the structure in the field of Wiener transform for 40 %, and 80 % destruction are shown in Fig. 19.
It should be noted that all of the above transforms are linear and, as a result, the two operators of difference and transform can be moved, which will not affect the results.
Fig. 19Standard deviations of acceleration changes for different nodes of the structure in the field of Wiener transform for 40 % and 80 % destruction: a) 40 % of destruction, b) 80 % of destruction
a)
b)
5. Comparison of the efficiency of the suggested methods
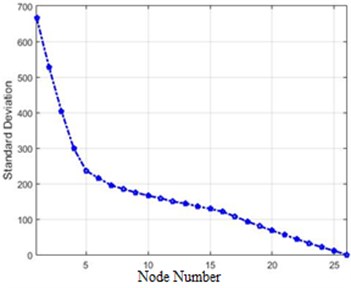
In order to compare the efficiency of the presented methods in this paper, the standard deviations of different methods were initially reviewed. This quantity for 80 % of destruction is shown in Fig. 20.
As Fig. 20 show a transform of acceleration changes before and after the destruction on the structure, it is evident that the methods providing more evident changes serve our purpose. Fig. 20 illustrates that Fourier and Wavelet transform are better alternatives than Wiener transforms and the difference of absolute value. Also, the amounts of differences before and after application of destruction for each node in the Fourier transform is bigger than Wavelet. It can be said that the Fourier transform is better than Wavelet and other methods in the detection of differences (destruction). In order to present a more accurate comparison of the efficiency of different methods for the detection of the destruction in the dam, Fig. 21 shows the efficiency of each method.
Fig. 20The amounts of the standard deviations of acceleration changes for different nodes of the structure for 80 % destruction
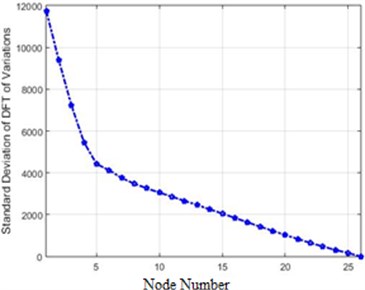
a) DTFT of acceleration
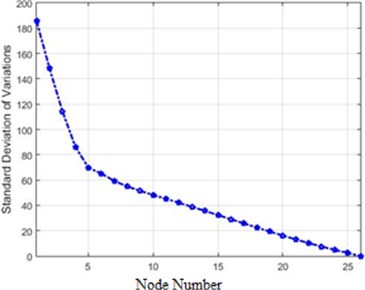
b) Absolute of acceleration
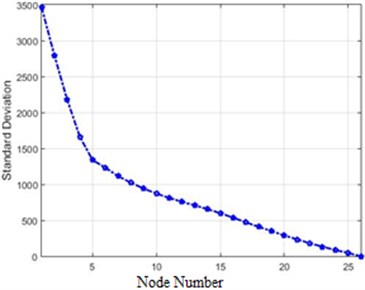
c) Wiener of acceleration
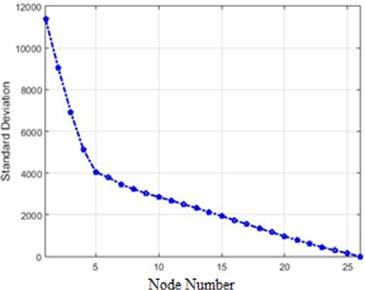
d) Wavelet of acceleration
Fig. 21The efficiency of the suggested methods for detection of destruction in the structure
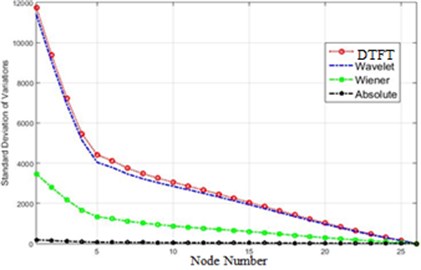
The efficiency of the methods offered in this research for detection of destruction in the dam, based on the standard deviation of acceleration before and after destruction, is shown Fig. 21.
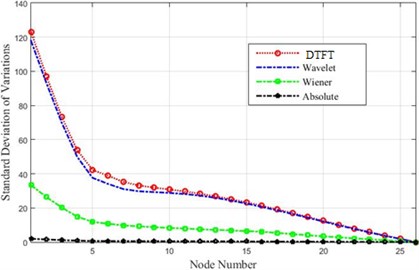
Among other approaches, the detection threshold is the one that best fits for destruction detection after the earthquake in both intact and damaged cases.
To extract the detection of each method, the destruction rate was gradually reduced and each time the dam acceleration amounts in different nodes (26 ones) were recorded and, following that, the dam destruction detection curves were plotted. This process continued up to a point where the given algorithm was no longer able to detect the damage.
For example, Fig. 22 indicates the detection ability of the four given methods for 5 % destruction.
Fig. 22The efficiency of the proposed method based on a decibel (dB) for the detection of destruction in the dam
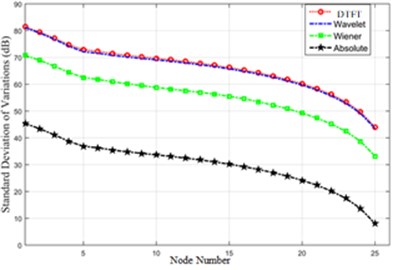
The curves of Fig. 22 have been extracted via 10*log10(.) an equation. According to the function curves of various methods based on decibel, the differences are negligible in the crest and lower nodes of the dam.
As it was seen, for minor destructions (5 %), DTFT and Wavelet algorithms could easily detect the occurrence of destruction, though the Wiener algorithm had a weaker performance. The range of differences in acceleration amounts or the absolute method could not detect the damage.
Fig. 23A comparison of the detection threshold for the given methods regarding minor destructions detection
6. Conclusions
In this paper, the behavior of the intact and damaged dam after applying the earthquake was investigated via signal processing algorithms. The destruction in the Pine Flat Dam was incurred by reduction of the elasticity module in some of the elements. To do so, both time and frequency domain algorithms were used. After the application of the earthquake, the acceleration amounts of different nodes were recorded in the intact and damaged cases as two signals with vector formats. In order to evaluate the difference between the signals, various signal processing algorithms were applied to distinguish the differences between the behavior of the intact and damaged structure at the time of the earthquake.
In this research, Discrete-time Fourier Transform (DTFT), Wavelet transform, and Wiener transform were used to assess the dam in intact and damaged cases. To present a quantitative and precise analysis of the efficiency of each method, the standard deviation of the changes was considered, and its curves were plotted for the efficacy of different algorithms. According to the results obtained from the implementation of the mentioned approaches, it can be claimed that DTFT had the most appropriate function, followed by Wavelet transform, which showed a close efficiency to that of DTFT. This functional difference was exactly zero dB both in the crest and lower nodes of the dam. Also, the efficacy of DTFT and Wavelet was 10 dB better than that of Wiener transform and around 35 dB more suitable than the time when the results of measurements are compared in a simple way and in the time domain. Signal processing algorithms depict the differences between intact and damaged cases caused by the earthquake. Although the destruction occurred in the elements between 5 and 6 nodes, as seen, acceleration amounts in different nodes vary, and these differences are apparent in the signal processing algorithms in this paper. Additionally, the detection threshold of the four mentioned methods was compared, and it was found that DTFT and Wavelet had a better function.
References
-
Chang Peter C., Chi Liu S. Recent research in nondestructive evaluation of civil infrastructures. Journal of Materials in Civil Engineering, Vol. 15, Issue 3, 2003, p. 298-304.
-
Richard E. Processing, Fast Algorithms for Signal. Cambridge, 2010.
-
Chopra Anil K. Earthquake analysis of concrete dams: factors to be considered. Journal of Structural Engineering, Vol. 138, Issue 2, 2012, p. 205-214.
-
Cleary R., Das P. W. A mesh-free approach for fracture modeling of gravity dams under earthquake. International Journal of Fracture, Vol. 179, Issues 1-2, 2013, p. 9-33.
-
Alembagheri Mohammad, Ghaemian Mohsen Damage assessment of a concrete arch dam through nonlinear incremental dynamic analysis. Soil Dynamics and Earthquake Engineering, Vol. 44, 2013, p. 127-37.
-
Dhakal Dharma Raj, Neupane Keshab, Thapa Chirayu, Ramanjaneyulu G. V. Different techniques of structural of health monitoring. International Journal of Civil, Structural, Environmental and Infrastructure Engineering Research and Development, Vol. 3, Issue 2, 2013, p. 55-66.
-
Raich A. M., Liszkai T. R. Multi-objective optimization of sensor and excitation layouts for frequency response function-based structural damage identification. Computer-Aided Civil and Infrastructure Engineering, Vol. 27, Issue 2, 2012, p. 95-117.
-
Farrar C. R., Jauregui D. A. Comparative study of damage identification algorithms applied to a bridge: I. Experiment. Smart Material Structure, Vol. 7, Issue 5, 1998, p. 720-731.
-
Lin C. Ambient modal identification using non-stationary. Archive of Applied Mechanics, Vol. 86, Issue 8, 2016, p. 1449-1464.
-
Kong Xuan, Cai Chun Sheng, Hu Jiexuan The state-of-the-art on the framework of vibration-based structural damage identification for decision making. Applied Sciences, Vol. 7, Issue 5, 2017, p. 497-528.
-
Bernagozzi Giacomo, Luca Landi, Pier Paolo Diotallevi On the output-only vibration-based damage detection of frame structures. Structural Health Monitoring, Damage Detection and Mechatronics, Vol. 7, 2016, p. 23-33.
-
Musafere F., Sadhu A., Liu K. Time-varying system identification using a hybrid blind source separation method. Structural Health Monitoring, Damage Detection and Mechatronics, Vol. 7, 2016, p. 99-104.
-
Kay S. M. Fundamentals of Statistical Signal Processing. Prentice Hall PTR, 1993.
-
Alembagheri M. Earthquake damage estimation of concrete arch dams using linear analysis and empirical failure criteria. Soil Dynamics and Earthquake Engineering, Vol. 90, 2016, p. 327-339.
-
Ruotolo R., Surace C. Damage assessment of multiple cracked beams: numerical result and experimental validation. Journal of Sound and Vibration, Vol. 206, Issue 4, 1997, p. 359-374.
-
Alemdar Bayraktar, Temel Türker, Mehmet Akköse, Şevket Ateş The effect of reservoir length on seismic performance of gravity dams to near- and far-fault ground motions. Natural Hazards, Vol. 52, Issue 2, 2010, p. 257-275.
-
Alembagheri M., Seyedkazemi M. Seismic performance sensitivity and uncertainty analysis of gravity dams. Pacific Conference Earthquake Engineering, Vol. 44, Issue 1, 2015, p. 41-58.
-
Oppenheim Alan V. Digital Signal Processing. Massachusetts Institute of Technology, Cambridge, 1981.
-
Strang Gilbert, Borre Kai Linear Algebra, Geodesy, and GPS. Siam, 1997.
-
Daubechies Ingrid The Wavelet transforms, time-frequency localization and signal analysis. IEEE Transactions on Information Theory, Vol. 36, Issue 5, 1990, p. 961-1005.
-
Addison Paul S. The Illustrated Wavelet Transform Handbook: Introductory Theory and Applications in Science, Engineering, Medicine and Finance. CRC Press, 2017.
-
Abbate Agostino, Koay Jeff, Frankel Julius, Schroeder Stephan C., Das Pankaj Signal detection and noise suppression using a Wavelet transform signal processor: application to ultrasonic flaw detection. IEEE Transactions on Ultrasonics, Ferroelectrics, and Frequency Control, Vol. 44, Issue 1, 1997, p. 14-26.
-
Clarkson Peter M. Optimal and Adaptive Signal Processing. Routledge, 2017.

