Abstract
Conformity of contact counterface is one of the important parameters in a total knee replacement (TKR) design. Understanding the effect of conformity on contact stress during static and dynamic loading is crucial. To date, many published reports discussing the effect of conformity were from the static analysis. Therefore, we were compelled to conduct an investigation on the effect of conformity using two-dimensional finite element analysis during dynamic or impact analysis. Five models taken from previous report have been made for this purpose. The model was composed of two parts: femoral indenter and tibial base which represented the femoral component and tibial insert, respectively. A 74 kg was taken as a body mass. The initial impact velocity of 0.6 m/s was applied. The comparative statistical analysis proved that the conformity of TKR significantly (p<0.05) gave the different effect on the Tresca stress, strain, displacement, indentation time, and also the reaction force. The largest displacement and indentation time of femoral indenter were happened in curved-on-flat model (Rf= 12 mm), and the lowest value was occurred in flat-on-flat (r= 1 mm) model. The largest reaction force was occurred in curved-on-curved model and the lowest one was happened in curved-on-flat (Rf= 12 mm) model. The largest Tresca stress was happened in curved-on-flat (Rf= 12mm) and flat-on-flat (r= 1 mm) model, and the lowest one was occurred in curved-on-flat (Rf= 40mm). The largest strain was occurred in flat-on-flat (r= 1mm) model, and the lowest one was in curved-on-curved model. The curved-on-flat (Rf=12 mm) model, even though it is bad in displacement, strain, and Tresca value, but it has a good performance in the reaction force value. For the curved-on-flat (Rf= 40 mm) model, it has a good performance if a low Tresca stress design of TKR is needed. The flat-on-flat (r= 1 mm) model, the low displacement and indentation time were its advantage, so that it is suitable for a low wear design of TKR. The flat-on-flat (r= 5 mm) model has no unique performance because all values are high. The last, the curved-on-curved model has the best performance in strain and a moderate good performance in displacement, indentation time, and Tresca value. But, it has a bad performance due to the high value of reaction force. If the average performance owned by each model used, we can summarize that the curved-on-flat (Rf=12 mm) was the most vulnerable model, and then followed by flat-on-flat (r= 5 mm), flat-on-flat (r= 1 mm), curved-on-curved, and curved-on-flat (Rf= 40 mm) as the safest model.
1. Introduction
Conformity of a total knee replacement (TKR) in sagittal and frontal plane is one of the important parameters in TKR design. The conformity is defined as the difference between femoral component radius and the tibial insert dish radius [1]. In some papers, the researchers normalize the conformity value, to be between 0 and 1, by dividing the femoral component radius with the tibial insert dish radius, where 0 is the minimum conformity and 1 is the maximum conformity [2]. The minimum conformity occurs when a round femoral component is brought into contact with a flat tibial insert. Meanwhile, the maximum conformity happens when both femoral component and tibial insert dish have a same profile. In other words, the femoral component and tibial insert dish radius are the same.
Many researchers have revealed the significant effect of conformity in developing stress and wear in TKR. Kuster et al. [3] have reported the serious effect of conformity on surface and shear stress. The conformity influence was greater than the load influence. Small change in conformity value (0.99 to 0.95) resulted in a greater increase in surface and shear stress than the increase caused by the great change in load (3000 to 6000 N). This report also supported by D’ Lima et al.’s investigation [4]. In the wear issue, Liau et. al [5] revealed that the high conformity in curve-on-curve TKR design produced the minimal risk of polyethylene wear under the mal-alignment condition. On the other hand, Essner et al. [6] reported that the decreasing of sagittal conformity of TKR lead to a trend toward lower wear. But, in PFC Sigma TKR design, the increased conformity significantly reduced UHMWPE (ultra-high molecular weight polyethylene) wear [7]. From this explanation, it can be concluded that the conformity has a great effect on developing stress in TKR counterface.
So far, the researchers studying the effect of conformity in TKR have been conducted using a static analysis. Whereas, in the reality, the load occurred in TKR is dynamic or impact load. Therefore, the understanding of stress behavior during impact loading is also crucial in TKR design. So, the aim of this study is to investigate the effect of the TKR conformity on the displacement, indentation time, and contact stress during impact load. The reaction force at the bottom of tibial insert was also investigated in this study.
The conformity effect was studied only in the frontal plane due to the fact that the stresses are most sensitive to change in frontal plane [8]. Three contact categories had been created for the purpose of the investigation, namely flat-on-flat which represented a full conforming contact, curved-on-flat which represented a low conforming contact, and curved-on-curved which represented a high conforming contact. The displacement of the counterface at the contact center, the maximum Tresca stress and strain in the tibial base, the reaction force at the bottom of tibial base, and the indentation time of femoral indenter were recorded and analyzed to produce the data of the effect of conformity during impact load in TKR.
2. Materials and methods
Five two-dimensional models in frontal plane of TKR were created. There were three categories of the contact, namely flat-on-flat, curved-on-flat, and curved-on-curved as clearly depicted in Fig. 1. Each model represented the different level of conformity: the flat-on-flat model represented a full conformity design of TKR, the curved-on-flat model represented a low conformity design of TKR, and the curved-on-curved model represented a high conformity design of TKR.
There were two parts in the model: the femoral indenter and tibial base. The femoral indenter and tibial base represented the femoral condyle and the tibial insert in the frontal plane in the real TKR, respectively. In this study, the femoral indenter and tibial base were simply modeled as a two-dimensional cylinder and rectangle, respectively.
The detail of the model categories and their measurements are tabulated in Table 1. The curved-on-flat contact category was simulated with two models (with the 12 mm and 40 mm of radius of femoral indenter). The flat-on-flat contact category also simulated with two models (with 1 mm and 5 mm of edge radius of femoral indenter). The width of both flat indenters was 20 mm. The curved-on-curved contact category was only simulated with one model, where the 20 mm radius femoral indenter was brought into contact with the 21 mm notch radius of tibial base.
Due to the femoral component of TKR was made from metal with a high modulus of elasticity compared with the modulus of elasticity of UHMWPE as the material of tibial insert, the femoral indenter was assumed as a rigid body. Meanwhile, the tibial base was modeled as a deformable body. The nonlinear true stress versus true strain of UHMWPE was chosen in consistent with Halloran et al. previous report [9] as shown in Fig. 2.
In this study, the Abaqus finite element analysis (FEA) software was used. As the true stress versus plastic strain data were needed as the input of material properties in the software, the data shown in Fig. 2 should be extracted to have the corresponding plastic strain for each true stress value by using Eq. (1). Then, the true stresses versus plastic strains are tabulated Table 2.
The modulus of elasticity of UHMWPE was also extracted from Fig. 2. It was obtained by dividing the first non-zero true stress (11 MPa) by its corresponding true strain (0.02), and we found that the modulus of elasticity of UHMWPE was 550 MPa. The density of UHMWPE of 9.36×10⁵ kg/m3 was chosen [10]:
Fig. 1The categories of contact models [8]
![The categories of contact models [8]](https://static-01.extrica.com/articles/18885/18885-img1.jpg)
Table 1Femoral indenter and tibial base measurements for each contact pair model [8]
Model | Femoral indenter radius (Rf) [mm] | Tibial base radius (Rt) [mm] |
Curved-on-flat, Rf= 12 mm | 12 | ~ |
Curved-on-flat, Rf= 40 mm | 40 | ~ |
Flat-on-flat, r= 1 mm | ~ (r= 1, width = 20) | ~ |
Flat-on-flat, r= 5 mm | ~ (r=5, width = 20) | ~ |
Curved-on-curved | 20 | 21 |
The dynamic explicit step was selected with the period of time of 0.05 second. As mentioned before that this study was intended to investigate the effect of the contact conformity on displacement, indentation time, and contact stress during impact load in TKR, the impact time of 14.4 ms was chosen. The impact time was taken from the period of the impact time of heel strike in running with hard footpad [11]. In impact simulation, the load applied is time dependent. Therefore, the load versus time was defined using amplitude, as we can see in Table 3.
A point mass of 12333.3 kg/m was applied at femoral indenter reference point. It was the mass of human body of 74 kg as previously used by Domire and Challis in their analysis [12] devided by 6 mm out-of-plane contact width [8]. It was also corresponding to the body weight of 700 N chosen by Thambyah et. al [13]. The gravity of 9.81 m/s2 was applied to the whole model. The vertical touchdown velocity of foot during running varies between 0.64 and 2.3 m/s [14]. Therefore, we chose the vertical impact velocity of 0.64 m/s in order to be close to the value used by Liu and Nigg [15, 16] in which they chose 0.6 m/s of touchdown velocity in their analysis. We also applied the boundary conditions to the models: the femoral indenter was only allowed to move vertically and the tibial base was fixed in all directions. For the contact interaction between femoral indenter and tibial base, the explicit frictional hard surface to surface contact type was selected with coefficient of friction of 0.04 [17].
The two-dimensional rectangles, as the representation of the tibial base, were modeled as the elastic half-space. Therefore, the width of the rectangles was extended well beyond the region of the contact [18]. An explicit 4-node bilinear plane strain quadrilateral, reduced integration with hourglass control element (CPE4R) was applied to discretize the rectangles. For the accurate result in the region of interest, the region around the contact point was finely meshed with 0.1 mm edge. And, the global mesh size of 5mm was used for the rest of region.
The use of reduced integration plain strain element with hourglass control (CPE4R) in this simulation was based on the recommendation of Abaqus as the finite element software used in this simulation. Related to the choice of the reduced or fully integration for the first order element, including CPE4, the phenomenon of shear locking is one of the reasons why the reduced integration element should be selected. This is because the shear locking occurs in the first order fully integration element when they subject to bending. Therefore, the reduced integration element was used in this simulation. However, on the other hand, the hourglass phenomenon is the other problem occurs in the first order elements if the reduced integration element is selected. So, for this reason, the elements were also equipped with the hourglass control [19].
Fig. 2Nonlinear true stress versus true strain of UHMWPE [9]
![Nonlinear true stress versus true strain of UHMWPE [9]](https://static-01.extrica.com/articles/18885/18885-img2.jpg)
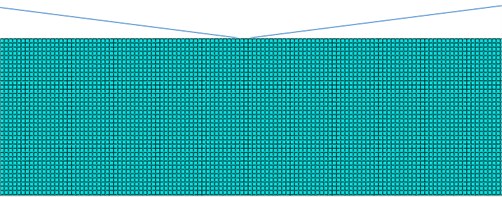
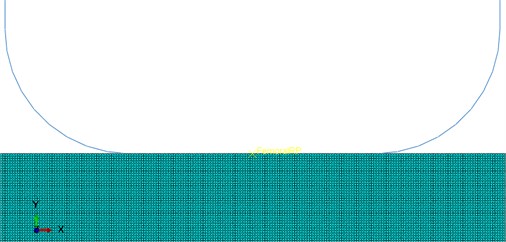
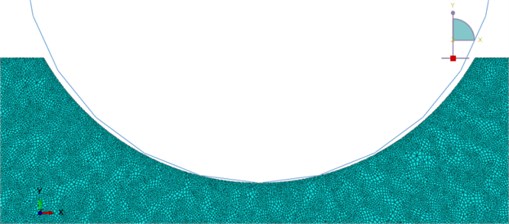
The finite element of the models is depicted in Fig. 3. And the corresponding total number of elements and nodes are tabulated in Table 4. In Fig. 3, only three models are showed because both curved-on-flat with Rf= 12 mm and Rf= 40 mm were brought into contact with the same tibial base. Therefore, only one of them is shown in the figure. The same thing also occurs for flat-on-flat models, both femoral indenter with r= 1mm and r= 5 mm models were also brought into contact with the same tibial base. But, the curved-on-curved model is shown as it is because it has no variation.
Table 2True stress versus plastic strain of UHMWPE for Abaqus material properties input
True stress (MPa) | Plastic strain |
11 | 0.00 |
16 | 0.01 |
18.5 | 0.02 |
20.8 | 0.03 |
23 | 0.05 |
24.5 | 0.08 |
31 | 0.22 |
33 | 0.29 |
Table 3Load amplitude
Time [s] | Amplitude |
0 | 0 |
0.00001 | 1 |
0.01440 | 1 |
0.01441 | 0 |
Table 4Numbers of element and node for all models
Model | Number of element | Number of node |
Curved-on-flat, Rf= 12 mm | 43427 | 43493 |
Curved-on-flat, Rf= 40 mm | 348080 | 348548 |
Flat-on-flat, r= 1 mm | 348080 | 348548 |
Flat-on-flat, r= 5 mm | 348080 | 348548 |
Curved-on-curved | 89385 | 88172 |
Fig. 3Finite element of all models: a) the curve-on-flat model, b) the flat-on-flat model, c) the curved-on-curved model. In this mesh figure, only a region near to the contact area is shown
a)
b)
c)
3. Results and discussions
The impact-contact FEA of five different models of TKR in frontal plane had been conducted. The nonparametric statistical analysis was also carried out to verify whether the conformity of TKR would significantly affect the displacement, indentation time, and the contact stress in tibial insert in contact-impact mechanism. For this purpose, The Friedman Two-Way Anova test had been used to detect the differences of displacement, indentation time, and contact stress developed in each model.
By the statistical analysis we found that the counterface conformity of TKR that represented by each model significantly (p<0.05) affected the displacement, the indentation time, and the contact stress in the contact-impact mechanism.
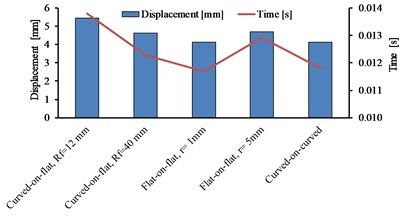
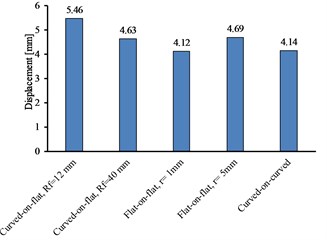
The Fig. 4 tells us the displacement of the counterface of tibial base at the center of contact. The displacement was also the depth of penetration of femoral indenter into the tibial base. The largest displacement of 5.46 mm was occurred in curved-on-flat model with femoral indenter radius of 12 mm. The second largest displacement was occurred in flat-on-flat (r= 5 mm) model with 4.69 mm. Then, it followed by curved-on-flat (Rf= 40 mm), curved-on-curved, and flat-on-flat (r= 1mm) model with displacement of 4.63, 4.14, and 4.12 mm, respectively, as clearly depicted in Fig. 8(a).
We can see that the flat-on-flat (r= 1 mm) model produced the lowest displacement. Inacio et al. [20] had compared the short-term revision risk in alternative knee tibial insert articulation with that for traditional tibial insert. And they have reported the results, one of them was that no failure of tibial insert due to its displacement. On the other hand, it is generally believed that a small penetration depth may result in a less subsurface deformation, and thus, less abrasive wear [21]. Therefore, the displacement presented in Fig. 4 may be one of the important considerations in TKR design, especially in determining the conformity value. In the term of displacement, flat-on-flat model with sharp edge was the best model to be selected.
Fig. 4The displacement of tibial base at the contact center in vertical direction for all models
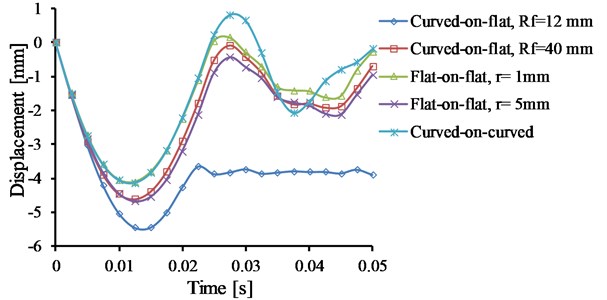
Fig. 5Reaction forces at the bottom of tibial base for all models
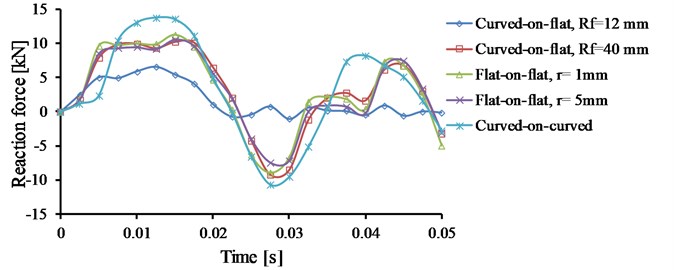
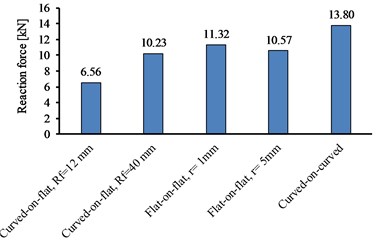
The Fig. 5 shows the reaction force at the bottom of tibial base during the contact-impact. The largest reaction force of 13.80 kN was occurred in curved-on-curved model, and flat-on-flat (r= 1 mm) model produced the second largest reaction force of 11.32 kN, and then followed by flat-on-flat (r= 5 mm), curved-on-flat (Rf= 40 mm), and curved-on-flat (Rf= 12 mm) model with reaction forces of 10.57, 10.23, and 6.58 kN, respectively, as we can see in Fig. 8(b). The lowest reaction force occurred in curved-on-flat (Rf= 12 mm). From this result we can see that the reaction force was dependent on the initial contact area. If the initial contact area increased, the reaction force also increased.
In a complete simulation that involves the whole body parts, the reaction force produced in this simulation may be regarded as a ground reaction force (GRF). However, when we compared with GRF in the previous reports, the reaction forces produced by this simulation were much larger. McNair and Prapavessis, for instance, have recorded the normative data of vertical GRF during human landing from a box of 0.3 m high. They found that the mean peak vertical GRF was 4.5 bodyweights (BW) across all subjects [22]. And also, Keller et al. have reported the smaller vertical GRF of approximately 2.5 BW. It was found when the subjects were running at 6 m/s [23]. At the same speed, Nilsson and Thorstensson also reported that the GRF was 2.9 BW [24]. The enlargement of GRF in this simulation was caused by the assumption that the whole body was represented by two rigid body segments: femoral indenter and tibial base. In this study, the whole bodyweight was positioned at the femoral indenter reference point. Therefore, the inclusion of the wobbling masses beside the rigid masses in human body simulation is recommended when we want to get a more accurate result.
As we know that the GRF on foot is influenced by several factors, namely the inertia of tested system, masses of various segment involved in the deceleration process, joint angle between body segment, coupling between soft and rigid masses, and the joint stiffness [16]. However, due to our objective was only to investigate the behavior of displacement, indentation time, and contact stress towards conformity during contact-impact, this simple model was used. Therefore, the data here was also displayed in the form of rank as showed in Table 5. The rank was made in an ascending manner, namely the largest value was given the largest rank and vice versa.
Table 5The average rank of maximum parameters value for all models
Parameters | Models | ||||
Curved-on-flat, Rf=12 mm | Curved-on-flat, Rf=40 mm | Flat-on-flat, r= 1 mm | Flat-on-flat, r= 5 mm | Curved-on-curved | |
Displacement [mm] | 5 | 3 | 1 | 4 | 2 |
Indentation time [s] | 5 | 3 | 1 | 4 | 2 |
Reaction force [kN] | 1 | 2 | 4 | 3 | 5 |
Tresca [MPa] | 4.5 | 1 | 4.5 | 3 | 2 |
Strain [%] | 4 | 2 | 5 | 3 | 1 |
Sum | 19.5 | 11 | 15.5 | 17 | 12 |
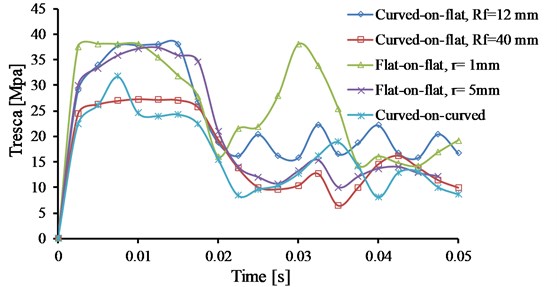
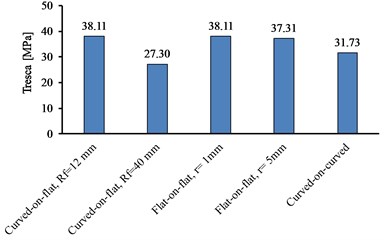
The Fig. 6 shows the Tresca stress for all models. It also can be seen in Fig. 8(c), the same largest Tresca stress of 38.11 MPa was occurred in curved-on-flat (Rf= 12 mm) and flat-on-flat (r= 1 mm). And then followed by flat-on-flat (r= 5 mm), curved-on-curved, and curved-on-flat (Rf= 40 mm) model with 37.11, 31.73, 27.30 MPa, respectively. This condition was consistent with the work of static simulation of Rawlinson and Bartel [8] in which they found that the flat-on-flat model produced larger stress compared with the other models. In this contact-impact simulation, we found that the flat-on-flat (r= 1 mm) model was as vulnerable as the curved-on-flat (Rf= 12 mm) model. However, the lowest Tresca stress was occurred in curved-on-flat (Rf= 40 mm) model, not in curved-on-curved model (Rf= 20 mm, Rt= 21 mm). This proved that full conforming contact was not necessarily to produce lowest stress in contact-impact.
Fig. 6Tresca stresses versus time in all models
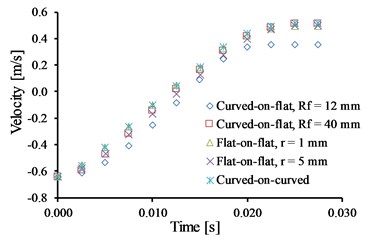
The Fig. 7(a) shows the velocity of femoral indenter for all models during the contact-impact time history. We were also interested in discussing the velocity of femoral indenter in the form of the time needed by the femoral indenter to reach the maximum displacement. In the other words, when the vertical velocities of femoral indenter were zero. From Fig. 7(a), we can extract the time when the velocity curve crossed the zero velocity line. We will call this time as the indentation time. Then, we also can define that the indentation time is the time needed by the femoral indenter to start to rebound after penetrating the tibial base. The indentation time and maximum displacement of femoral indenter is clearly depicted in Fig. 7(b). From Fig. 7(a) and 7(b) we can see that the trend of indentation time is similar to the trend of maximum displacement. And, as mentioned before, the maximum displacement of femoral indenter was significantly influenced by the counterface conformity, and so is the indentation time.
Fig. 7a) The vertical velocity of femoral indenter during time history, b) the maximum vertical displacement and the time taken by femoral indenter to reach its maximum displacement
a)
b)
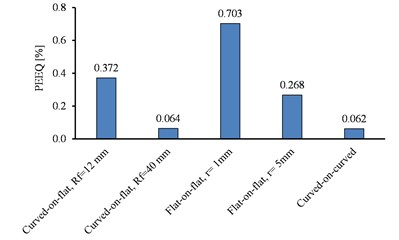
Fig. 8a) Maximum displacement, b) reaction force, c) tresca stress, and d) the equivalent plastic strain (PEEQ) for all models
a)
b)
c)
d)
From Table 5 we can see that the performance of every model was tabulated in the form of ordinal data. The ranks show us the value of displacement, indentation time, reaction force, Tresca stress, and strain in an ascending manner. And then, the ranks were summed for every model. The larger value of the sum, the more vulnerable the model. We can see that from Table 5, the Curved-on-flat (Rf= 12 mm) was the most vulnerable model. And then, followed by flat-on-flat (r= 5 mm), flat-on-flat (r= 1 mm), curved-on-curved, and curved-on-flat (Rf= 40 mm) as the safest model.
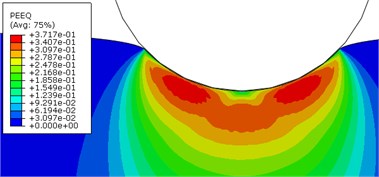
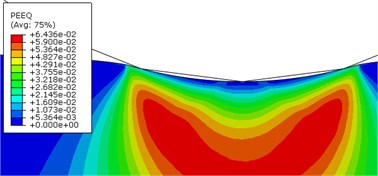
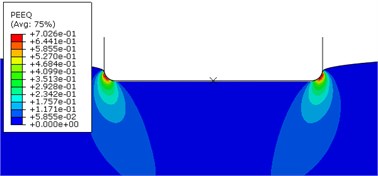
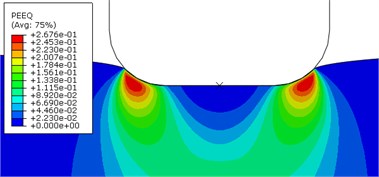
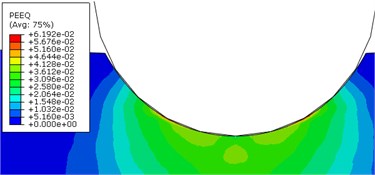
From Fig. 8(d), the equivalent plastic strains (PEEQ) for all models are shown, and their contours are depicted in Fig. 9. The strains were extracted when the femoral indenter reached the maximum indentation depth. The results showed that the largest strain of 0.703 occurred in the flat-on-flat (r= 1 mm) model and then decreased to 0.372, 0.268, 0.064, and 0.062 in curved-on-flat (Rf= 12 mm), flat-on-flat (r= 5 mm), curved-on-flat (Rf= 40 mm), and curved-on-curved model, respectively.
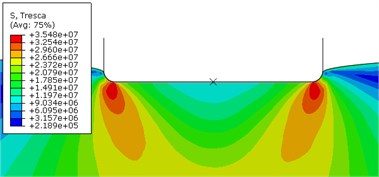
The important phenomenon that should be noticed from Fig. 9(c) and 9(d) is that the flat-on-flat models had two positions of maximum equivalent plastic strain, namely at the edges of femoral indenter. Same as the strain, the Tresca stress also occurred at the same position, as shown in Fig. 9(f). This phenomenon made the models more vulnerable to damage than the other models due to the existence of double maximum plastic strain and Tresca stress in one model.
As the flat-on-flat models represent a fully conforming TKR design, the phenomenon also decisively proved that the fully conforming TKR designed in the form of flat-on-flat contact mechanism did not decrease the failure tendency of TKR.
Fig. 9Equivalent plastic strain (PEEQ) contour for model: a) curved-on-flat, Rf= 12 mm, b) Curved-on-flat, Rf= 40 mm, c) flat-on-flat, r= 1 mm, d) flat-on-flat, r= 5 mm, and e) curved-on-curved. Tresca stress for model: f) flat-on-flat (r= 1 mm)
a)
b)
c)
d)
e)
f)
4. Conclusions
The two-dimensional finite element analysis to investigate the effect of conformity on the displacement, indentation time, contact stress, and strain during contact-impact in TKR, has been conducted. The statistical analysis to clarify significant effect between variables has also been carried out, and we found that the counterface conformity of TKR that represented by each model significantly (p<0.05) affected the displacement, indentation time, contact stress, and strain in contact-impact mechanism simulation in TKR.
The largest displacement and indentation time of femoral indenter were happened in curved-on-flat model (Rf= 12 mm). And the lowest value was occurred in flat-on-flat (r= 1 mm) model. In the term of displacement and indentation time, flat-on-flat model with sharp edge was the best model to be selected. The largest reaction force was occurred in curved-on-curved model and the lowest one was happened in curved-on-flat (Rf= 12 mm) model. From the result, we can see that the reaction forces were dependent on the contact area. If the initial contact area increased, the reaction force also increased. The largest Tresca stress was happened in curved-on-flat (Rf= 12 mm) and flat-on-flat (r= 1 mm) model, and the lowest one was occurred in curved-on-flat (Rf= 40 mm). This proved that full conforming contact was not necessarily to produce lowest Tresca stress in contact-impact mechanism. Meanwhile, the largest strain was occurred in flat-on-flat (r= 1 mm) model, and the lowest one was in curved-on-curved model.
If we look the performance of each model in detail, we found that every model has its own advantage. The curved-on-flat (Rf=12 mm) model, even though it is bad in displacement, Tresca, and strain value, but it has a good performance in the reaction force value. For the curved-on-flat (Rf= 40 mm) model, it has a good performance if a low Tresca stress design of TKR is needed. The flat-on-flat (r= 1 mm) model, the low displacement was its advantage, so that it is suitable for a low wear design of TKR. The flat-on-flat (r= 5 mm) model has no unique performance because all values are high. The last, the curved-on-curved model has the best performance in strain and a moderate good performance in displacement, indentation time, and Tresca value. But, it has a bad performance due to the high value of reaction force.
However, if the average performance owned by each model used, we can summarize that the curved-on-flat (Rf=12 mm) was the most vulnerable model, and then followed by flat-on-flat (r= 5 mm), flat-on-flat (r= 1 mm), curved-on-curved, and curved-on-flat (Rf= 40 mm) as the safest model.
References
-
Ardestani M. M., Moazen M., Jin Z. Contribution of geometric design parameters to knee implant performance: conflicting impact of conformity on kinematics and contact mechanics. The Knee, Vol. 22, Issue 3, 2015, p. 217-224.
-
Willing R., Kim I. Y. Three dimensional shape optimization of total knee replacements for reduced wear. Structural and Multidisciplinary Optimization, Vol. 38, Issue 4, 2009, p. 105-414.
-
Kuster M. S., Horz S., Spalinger E., Stachowiak W., Gächter A. The effects of conformity and load in total knee replacement. Clinical Orthopaedics and Related Research, Vol. 375, 2000, p. 302-312.
-
D' Lima D. D., Chen P. C., Colwell C. W. Jr. Polyethylene contact stresses, articular congruity, and knee alignment. Clinical Orthopaedics and Related Research, Vol. 392, 2001, p. 232-238.
-
Liau J. J., Cheng C. K., Huang C. H., Lo W. H. The effect of malalignment on stresses in polyethylene component of total knee prostheses – a finite element analysis. Clinical Biomechanics. Vol. 17, Issue 2, 2002, p. 140-146.
-
Essner A., Klein R., Bushelow M., Wang A., Kvitnitsky M., Mahoney O. The effect of sagittal conformity on knee wear. Wear, Vol. 255, Issues 7-12, 2003, p. 1085-1092.
-
McEwen H., Barnett P., Bell C., Farrar R., Auger D., Stone M., Fisher J. The influence of design, materials and kinematics on the in vitro wear of total knee replacements. Journal of Biomechanics, Vol. 38, Issue 2, 2005, p. 357-365.
-
Rawlinson J. J., Bartel D. L. Flat medial-lateral conformity in total knee replacements does not minimize contact stresses. Journal of Biomechanics, Vol. 35, Issue 1, 2002, p. 27-34.
-
Halloran J. P., Petrella A. J., Rullkoetter P. J. Explicit finite element modeling of total knee replacement mechanics. Journal of Biomechanics, Vol. 38, Issue 2, 2005, p. 323-331.
-
Liu H., Xie D., Qian L., Deng X., Leng Y., Huanga N. The mechanical properties of the ultrahigh molecular weight polyethylene (UHMWPE) modified by oxygen plasma. Surface and Coatings Technology, Vol. 205, Issues 8-9, 2011, p. 2697-2701.
-
Addison B. J., Lieberman D. E. Tradeoffs between impact loading rate, vertical impulse and effective mass for walkers and heel strike runners wearing footwear of varying stiffness. Journal of Biomechanics, Vol. 48, Issue 7, 2015, p. 1318-1324.
-
Domire Z. J., Challis J. H. Maximum height and minimum time vertical jumping. Journal of Biomechanics, Vol. 48, Issue 11, 2015, p. 2865-2870.
-
Thambyah A., Goh J. C., De S. D. Contact stresses in the knee joint in deep flexion. Medical Engineering and Physics, Vol. 27, Issue 4, 2005, p. 329-335.
-
Rodgers M. M. Dynamic biomechanics of the normal foot and ankle during walking and running. Physical Therapy, Vol. 68, Issue 12, 1988, p. 1822-1830.
-
Liu W., Nigg B. M. Amechanical model to determine the influence of masses and mass distribution on the impact force during running. Journal of Biomechanics, Vol. 33, Issue 2, 2000, p. 219-224.
-
Nigg B. M., Liu W. The effect of muscle stiffness and damping on simulated impact force peaks during running. Journal of Biomechanics, Vol. 32, Issue 8, 1999, p. 849-856.
-
Godest A., Beaugonin M., Haug E. Taylor M. Simulation of a knee joint replacement during a gait cycle using explicit finite element analysis. Journal of Biomechanics, Vol. 35, Issue 2, 2002, p. 267-275.
-
Abaqus 6.10 Online Documentation. Dassault Systèmes, 2010.
-
Abaqus 6.12 Online Documentation. Dassault Systèmes, 2012.
-
Inacio M. C. S., Cafri G., Paxton E. W., Kurtz S. M., Namba R. S. Alternative bearings in total knee arthroplasty: risk of early revision compared to traditional bearings. Acta Orthopaedica, Vol. 84, Issue 2, 2013, p. 145-152.
-
Pirsoa J., Viljusb M., Juhania K., Letunovitšc S. Two-body dry abrasive wear of cermets. Wear, Vol. 266, Issues 1-2, 2009, p. 21-29.
-
McNair P. J., Prapavessis H. Normative data of vertical ground reaction forces during landing from a jump. Journal of Science and Medicine in Sport, Vol. 2, Issue 1, 1999, p. 86-88.
-
Keller T., Weisberger A., Ray J., Hasan S., Shiavi R., Spengler D. Relationship between vertical ground reaction force and speed during walking, slow jogging, and running. Clinical Biomechanics, Vol. 11, Issue 5, 1996, p. 253-259.
-
Nilsson J., Thorstensson A. Ground reaction forces at different speeds of human walking and running. Acta Physiologica Scandinavica, Vol. 136, Issue 2, 1989, p. 217-227.
About this article
The authors acknowledge and thank the Ministry of Science and Technology of the Republic of China for their partial financial support of this study under Contract No. MOST 104-2221-E-151-010.

