Abstract
Gearbox, as a critical component to convert speed and torque to maintain machinery normal operation in the industrial processes, has been received and still needs considerable attentions to ensure its reliable operation. Direct sensing and indirect sensing techniques are widely used for gearbox condition monitoring and fault diagnosis, but both have Pros and Cons. To bridge their gaps and enhance the performance of early fault diagnosis, this paper presents a new virtual sensing technique based on extreme learning machine (ELM) for gearbox degradation status estimation. By fusing the features extracted from indirect sensing measurements (e.g. in-process vibration measurement), ELM based virtual sensing model could infer the gearbox condition which was usually directly indicated by the direct sensing measurements (e.g. offline oil debris mass (ODM)). Different state-of-the-art dimension reduction techniques have been investigated for feature selection and fusion including principal component analysis (PCA) and its kernel version, locality preserving projection (LPP) method. The effectiveness of the presented virtual sensing technique is experimentally validated by the sensing measurements from a spiral bevel gear test rig. The experimental results show that the estimated gearbox condition by the virtual sensing model based on ELM and kernel PCA well follows the trend of truth data and presents the better performance over the support vector regression based virtual sensing scheme.
1. Introduction
Gearbox is one of the most important components in mechanical equipment during industrial process. Its health and safety are vital to the reliable operation and improved efficiency of relevant facilities in the whole system. However, gearboxes generally work under harsh operating environment, which may accelerate their degradation. Consequently, they are subject to different defect types such as gear fatigue crack, gear pitting, bearing defects, bent shaft, etc. Gearbox defects may even cause failure of the whole system, leading to significant economic losses, costly downtime and even catastrophic damage. Thus, fault diagnosis and prognosis of gearboxes are of great importance to achieve a high degree of availability, reliability, and operational safety.
In gearbox condition monitoring, a variety of sensing techniques have been instrumented to acquire gearbox mechanical components’ conditions. According to the correlation between sensing parameters and gearbox mechanical components’ conditions, these sensing techniques can be categorized into direct sensing and indirect sensing methods [1]. Direct sensing techniques measure actual quantities that directly indicate gearbox mechanical components’ conditions (e.g. oil debris mass). Inductance type oil debris sensors have been used to monitor the health of gearbox mechanical components [2]. Inductance type, oil debris sensors count particles and approximate debris size and mass based on disturbances of a magnetic field caused by passage of a metallic particle. However, such direct sensing techniques usually involve high cost, and present some practical limitations during gearbox normal operations. Therefore, oil debris analysis is often performed offline or in the laboratory.
On the contrary, indirect sensing techniques measure the auxiliary in-process quantities (e.g. vibration, acoustic emission, etc.) that indirectly indicate gearbox components’ conditions. At present, vibration sensors have been the most commonly used sensors in mechanical systems health monitoring applications. Therefore, some vibration analysis techniques have been developed for gearbox fault detection (e.g. the detection of gear tooth pitting and crack). In [3], a windowing and mapping strategy is proposed for gear tooth fault detection of a planetary gearbox when the fault symptom generated by the single cracked tooth may be very weak. In [4], it aims to model the vibration signals of a planetary gearbox for tooth crack detection when there are multiple vibration sources and the transmission path of vibration signals changes due to the rotation of the carrier in a planetary gearbox. In [5], Approximate Entropy based gearbox diagnosis model is proposed to quantify the regularities of vibration signals measured on rolling bearings. Comparing to direct sensing, indirect sensing methods are less costly and enable continuous detection of all changes to signal measurements. However, such indirect sensing techniques have some disadvantages such as low accuracy to indicate gearbox conditions and data redundancy caused by the increased amount of data samples.
To sum up, direct sensing measures direct indicators of gearbox conditions, but it is usually performed offline and thus interrupts normal machine operations. On the other hand, indirect sensing can continuously measure in-process parameters, but the obtained information is indirect indicators of gearbox mechanical components’ conditions. To bridge the gap between direct sensing and indirect sensing, virtual sensing, as a complement to physical sensing, has emerged as a viable, noninvasive, and cost-effective method to infer difficult-to-measure or expensive-to-measure parameters in dynamic systems based on computational models [6]. It has been investigated for active noise and vibration control [7], industrial process control [8], building operation optimization [9], lead-through robot programming [10], product quality of semiconductor industry [11], and tool condition monitoring [12, 13].
In the fields of safety inspection and intelligent diagnosis for mechanical equipment, the role of artificial intelligence models employed in the implementation of intelligent sensors systems is an essential one. These commonly investigated artificial intelligence models include artificial neural network (ANN) [14], and support vector regression (SVR), etc. In general, given the high cost and practical constraints to obtain data samples, SVR with good generalization capability attracts much research interest compared with ANN. However, it should be noted that in order to obtain as good performance as possible for SVR, long time effort has been made to find the appropriate parameters, which increases computational complexity in practical applications. Therefore, a new machine learning algorithm named extreme learning machine (ELM) is investigated and validated for machinery condition monitoring, which was originally proposed for the single hidden-layer feedforward neural networks (SLFNs). It can provide a unified learning platform with a widespread type of feature mappings and then is applied in regression and multiclass classification applications directly. In addition, through performance comparison of ELM and SVM in terms of running time and model accuracy in real application, it is found that the proposed ELM learning algorithm obtains better generalization performance than SVM learning algorithm. Moreover, the proposed ELM learning algorithm spent much less time on learning than SVM. The learning speed has dramatically been increased in ELM. Therefore, ELM can offer significant advantages such as fast learning speed, ease implementation, and minimal human intervention for real applications.
When using in-process measurements to infer gearbox components’ conditions, the increased amount of data samples inevitably brings data redundancy problem. To address this issue, the paper presents a feature fusion based virtual sensing technique. Different dimension reduction methods including Principal Component Analysis (PCA) and kernel PCA, Locality Preserving Projection (LPP) have been investigated for feature selection and fusion. The fused features using the above methods are then fed into ELM model to infer the actual quantities of gearbox components’ conditions. The performance of the proposed virtual sensing scheme is validated using experimental studies on a spiral bevel gear test facility.
The rest of the paper is constructed as follows. After introducing the theoretical background of KPCA for dimension reduction and machine learning methods in Section 2, the details of ELM based virtual sensing method are discussed in Section 3. The effectiveness of presented technique is experimentally demonstrated and compared with SVR based virtual sensing scheme in Section 4 based on direct and indirect sensing data acquired from a spiral bevel gear test facility. Finally, conclusions are drawn in Section 5.
2. Theoretical framework
2.1. Kernel principal component analysis
Principal component analysis (PCA) allows linear dimensionality reduction. However, if the data has more complicated structures which cannot be well represented in a linear subspace, traditional PCA will not be very helpful. Fortunately, kernel principal component analysis (KPCA) allows us to generalize traditional PCA to nonlinear dimensionality reduction, which is a nonlinear version of PCA and has been widely used for feature selection and fusion applications. The key idea of KPCA is to define a nonlinear transformation ϕ() which transforms the sample data into a high-dimensional data space. Then each data point Xi is projected to a point ϕ(Xi). Next, we can perform traditional PCA in the new feature space [15]. It transforms a set of observations of possible correlated variables into a set of uncorrelated variables called principal components. The first principal component has the largest variance, and each succeeding principal component has comparative lower variance orthogonal to the preceding principal components. The first several principal components can represent the original data with minimal mean squared approximation error, and thus KPCA can be used in dimensionality reduction.
Mathematically, given a set of input vectors (Xi(1),Xi(2),…,Xi(m))T, i=1, 2,…, p, the sample data Xi is mapped into ϕ(Xi) via the nonlinear kernel function ϕ(), i.e. With the assumption of centered data 1p∑pi=1ϕ(Xi)=0, the principal components are obtained by solving eigenvalue problem in KPCA:
where C is the sample covariance matrix of ϕ(Xi), λi is one of the eigenvalues of covariance matrix C, and ui is the corresponding eigenvector. The covariance matrix is constructed as:
Define a Gram matrix K with its elements as:
where xi and xj are the sample vectors. Assuming k() is a symmetric kernel function, the dot production in Eq. (3) can be replaced by a kernel function k() based on the Mercer’s theorem. Since the data points need to be centered in the feature space, the centered kernel matrix ˜K is defined as [16]:
where Ap is a p×p matrix with (Ap)ij=1/p. The eigenvalue Eq. (1) can be rewritten as:
Then the nth kernel principal component is readily obtained by projecting the observations in the direction of the nth eigenvector [15]:
Since the number of eigenvectors is the same as the sample size in KPCA, it can deal with nonlinear problems which cannot be solved by PCA. By calculating the accumulated contribution rate (e.g., 95 %), the number of the most significant principal components can be selected for dimensionality reduction:
2.2. Support vector regression model
Support vector regression (SVR) is the term used when Support vector machines (SVMs) are used to solve nonlinear regression estimation problems [17], which is based on statistics learning theory and has already been widely applied in most fields and made great results. Comparing with other data mining techniques such as artificial neural networks (ANN), it reveals good generalization capability and needs less training samples [18]. SVR transforms the original feature space into a higher dimensional space to determine an optimal hyperplane by maximizing the separation distances among the classes. Given an input training data set z∈χ, the transformed higher dimensional feature space can be obtained as:
where ϕ is the transformation function. A hyperplane f(z’)= 0 can be formulated as [18]:
where τ is a n-dimensional vector and b is a scalar. The vector τ and scalar b are used to define the position of the separating hyperplane. The hyperplane is built to maximize the distance D among the closest classes through the following optimization:
where yi is the class labeler. For example, it is labeled as {–1, 1} for two classes. Taking into account the noise with slack variables ξi and error penalty C, Eq. (10) can be rewritten as [18]:
subject toξi≥0,yi(τTϕ(zi)+b)≥1-ξi,∀i.
The hyperplane can be determined as the following sign function (sgn(t)= 1 for t≥ 0, and sgn(t)= –1 for t< 0). The linear decision function is given by:
where α is the Lagrange multiplier. The hyperplane function can be determined by kernel function K(zi,zj)=ϕT(zi)ϕ(zj) by computing the inner products without specifying the explicit form of the transformation function. Different kernels can be formulated such as linear, polynomial, Gaussian RBF, and Sigmoid kernel functions. Accordingly, the associated decision function for regression analysis is expressed as [19]:
2.3. Extreme learning machine model
ELM [20–22] was originally proposed for the single hidden-layer feedforward neural networks (SLFNs) and was then extended to the generalized SLFNs where the hidden layer need not be neuron alike. ELMs have both universal approximation and classification capabilities; and they can also build a direct link between multiple theories (specifically, ridge regression, optimization, neural network generalization performance, linear system stability, and matrix theory). Consequently, ELMs, which can be biologically inspired, offer significant advantages such as fast learning speed, ease of implementation, and minimal human intervention. They thus have strong potential as a viable alternative technique for large-scale computing and machine learning.
Compared with other machine learning methods including back-propagation (BP) and SVMs, the ELM methods have the following advantages. Firstly, since the support vectors obtained by SVM are much larger than the required hidden neurons in ELM, the testing time spent SVMs for the same testing data set is much longer than the ELM. In addition, ELM only needs to set the number of hidden neurons, and it does not need to adjust the input weights and the bias of hidden neurons during the implementation of the algorithm, which leads to producing a unique optimal solution. However, it should be noted that in order to obtain as good performance as possible for SVM, long time effort has been made to find the appropriate parameters for SVM. That means, after trained and deployed the ELM may react to new observations much faster than SVMs in such real application.
The ELM for SLFNs shows that hidden nodes can be randomly generated. The input data is mapped to L-dimensional ELM random feature space, and the network output is:
where β=[β1,β2,…,βL]T is the vector of the output weights between the hidden layer of L nodes and the output node and h(x)=[h1(x),h2(x),…,hL(x)] is the output (row) vector of the hidden layer with respect to the input x, and hi(x) is the output of the ith hidden node. h(x) actually, maps the data from the d-dimensional input space to the L-dimensional hidden-layer feature space (ELM feature space) H, and thus, h(x) is indeed a feature mapping.
Given N training samples {(xi,ti)}Ni=1, the ELM can resolve the following learning problem:
where T=[t1,t2,…,tN]T are target labels, and H=[hT(x1),hT(x2),…,hT(xN)]T.
Different from traditional learning algorithms, ELM tends to reach not only the smallest training error but also the smallest norm of output weights. According to Bartlett’s theory [23], for feedforward neural networks reaching smaller training error, the smaller the norms of weights are, the better generalization performance the networks tend to have. ELM is to minimize the training error as well as the norm of the output weights [20, 21].
Minimize:
The minimal norm least square method instead of the standard optimization method was used for calculating the output weights β in the original implementation of ELM [20, 21]:
where H† is the Moore-Penrose generalized inverse of matrix H [24, 25]. Different methods can be used to calculate the Moore–Penrose generalized inverse of a matrix: orthogonal projection method, orthogonalization method, iterative method, and singular value decomposition (SVD) [25].
The theoretical background of KPCA and machine learning methods discussed here, including SVR and ELM, forms the basis of virtual gearbox condition sensing model formulated in the next section.
3. Virtual gearbox condition sensing framework
It is recognized that indirect sensing techniques measure in-process auxiliary parameters during mechanical equipment operations. The indirect sensing parameters are less accurate to indicate gearbox components’ conditions, but the rugged senor design makes them more suitable for practical applications. On the other hand, direct sensing techniques measure actual quantities of gearbox components’ conditions and have a high degree of accuracy. Due to the practical limitations during gearbox normal operations, direct sensing techniques are commonly used for offline measurement or as laboratory techniques.
Fig. 1The rationale of developing virtual gearbox state sensing model
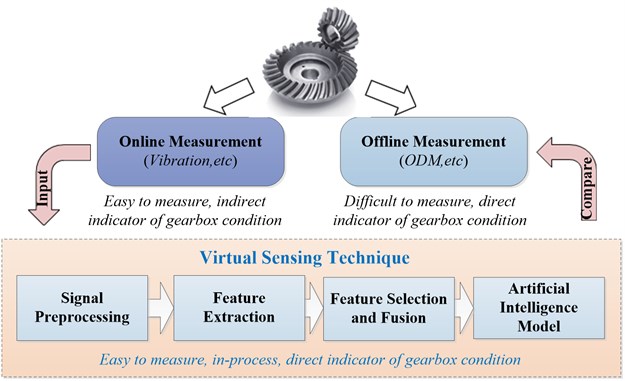
Utilizing the advantage of indirect sensing, virtual sensing technique can model the nonlinear dependencies between in-process measurements and actual quantities of gearbox mechanical components’ conditions based on computational models. The accuracy of virtual sensing is expected to be comparable to direct sensing. The rationale of virtual sensing to bridge the gap between indirect sensing and direct sensing is described in Fig. 1.
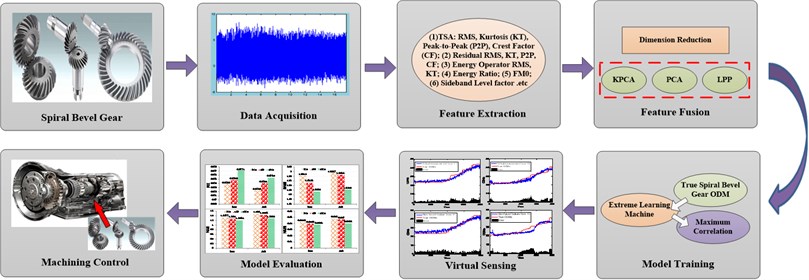
The developed virtual sensing model in this work mainly consists of four modules: (i) a data acquisition system capable of measuring vibration measurements from gearbox operating processes, (ii) a feature extraction module to extract gearbox condition indicators (CIs) by preprocessing raw noisy measurements, (iii) a feature fusion module to select and fuse the extracted features for dimension reduction, and (iv) an extreme learning machine based artificial intelligence model to infer gearbox mechanical components’ conditions from the fused features, as illustrated in Fig. 2. The proposed virtual sensing model is a complement to physical sensing, and can be used for gearbox condition monitoring and maintenance actions guidance.
Fig. 2Diagram of developed virtual gearbox condition sensing model
3.1. Data acquisition and feature extraction
During operation process of mechanical equipment, online measurements can acquire the in-process parameters such as accelerometer and tachometer signals reflecting gearbox conditions. Due to low signal to noise ratio (SNR), it is usually difficult to model the relationship between raw measurement and gearbox condition. To tackle this problem, effective feature extraction techniques are usually performed to reduce data dimension without losing gearbox defect signatures. In this study, 21 features indictors or condition indictors (CIs) from time domain, frequency domain, and time-frequency domain are investigated. Time domain methods involve statistical features such as root mean square (RMS), Kurtosis (KT), crest factor (CF), peak-to-peak value (P2P). RMS is a measure for the magnitude of a varying quantity. It is also related to the energy of a signal. Kurtosis indicates the spikiness of a signal. Features from the frequency domain provide another perspective of gearbox mechanical components’ conditions, and reveal information that are not included in the statistical domain. In frequency domain, spectral skewness and spectral kurtosis are extracted, where S(fi) is the power spectrum density obtained using the Welch method. In time-frequency domain, wavelet transform can be used for signal denoising and feature extraction. The wavelet coefficient with higher energy is selected which is related to the bearing defect characteristic frequencies. Thus, the energy of the selected wavelet coefficient is also extracted as a feature.
3.2. Feature selection and fusion
There are an overwhelming number of features extracted from the raw measurements. In general, the extracted features can be viewed as a high-dimensional multivariate matrix composed of several feature vectors. It is not feasible to input the above matrix to a virtual sensing model without dimension reduction because of the curse of dimensionality and the high correlation between vectors. For improved computational efficiency in virtual sensing model, a proper feature selection and fusion strategy is needed to lower the dimension of a feature space.
By implementing feature selection and fusion algorithms, the complexity of modeling process could be reduced and new feature vectors are reconstructed. Different representative dimensional reduction techniques are investigated for feature selection and fusion, including KPCA, PCA and LPP algorithms. Generally, it is difficult to determine which feature is more sensitive to gearbox conditions. The goal of feature selection and fusion is to preserve as much of the relevant information as possible by removing redundant or irrelevant information in acquired sensory signals. The top ranked features of these three schemes (e.g. KPCA, PCA, LPP, etc.) are then selected and fused into the computational model to infer the actual quantities of gearbox mechanical components’ conditions. Afterwards, their performance is evaluated by comparing the predicted gearbox conditions with actual offline measurement in terms of model accuracy.
3.3. ELM based virtual sensing model
Given the complex relationship between fused features and actual quantities of gearbox mechanical components’ conditions, it is difficult to describe it in an explicit analytic form. By exploiting the underlying structure of data measurements, the paper utilizes a novel machine learning tool-ELM model, which has significant advantages such as fast learning speed, ease of implementation, and minimal human intervention compared with ANN and SVM in real applications. Thus, in this paper, the ELM model is used to investigate the dependency between fused features and gearbox conditions.
As previously mentioned, the parameters of ELM model mainly involve a tunable parameter of hidden neurons compared with SVR algorithm. In general, the proper hidden neurons number is obtained through a lot of artificial experiments or cross validation (CV) method. In this paper, the CV method is adopted to find the optimal hidden neurons number. Additionally, in order to validate the effectiveness of ELM method, SVR based virtual sensing scheme is investigated and compared in terms of model accuracy. And the selection of parameters and kernel functions in SVR model is determined using grid search algorithm whose evaluation of model performance follows leave-one-out cross-validation method.
4. Experimental studies
4.1. Experimental setup and data collection
In this chapter, data from a spiral bevel gear case study conducted on the spiral bevel gear test facility are used to validate the presented method. And the experimental analyses of different virtual sensing schemes on three data sets are carried out in MATLAB 7.11.0 environment running in Intel(R) Xeon(R) E5-2650 v2, 2.60-GHZ CPU with 64-GB RAM.
Vibration data from experiments performed on the spiral bevel gear test facility was reprocessed for this analysis. A more detailed description of the test rig and test procedure is given in [2]. The rig is used to quantify the performance of gear materials, gear tooth design and lubrication additives on the fatigue strength of gears. During this testing, vibration condition indictors (CIs) and oil debris monitoring were used to detect pitting damage on spiral bevel gears.
The tests consisted of running the gears under load through a “back to back” closed loop torque regenerative system. Accelerometers were installed on the right and left side of the gearbox per Fig. 3. Vibration data was collected once per minute using a sampling rate of 100 kHz for 2 seconds duration. Shaft speed was measured by an optical sensor once per each gear shaft revolution, generating time synchronous averages (TSA) on the gear shaft (36 teeth). The pinion, on which the damage occurred, has 12 teeth. The tests were performed for a specific number of hours or until surface fatigue occurs. In this paper, data collected from three gears were used for performance comparison of virtual sensing schemes based on different feature selection and fusion methods. At test completion, destructive pitting could be observed on the teeth of the pinions (see Fig. 3).
Fig. 3a) The bevel gear test rig and bevel gears in [2], b) damaged spiral bevel gear in experiment 1, c) damaged spiral bevel gear in experiment 3
![a) The bevel gear test rig and bevel gears in [2], b) damaged spiral bevel gear in experiment 1, c) damaged spiral bevel gear in experiment 3](https://static-01.extrica.com/articles/17379/17379-img3.jpg)
a)
![a) The bevel gear test rig and bevel gears in [2], b) damaged spiral bevel gear in experiment 1, c) damaged spiral bevel gear in experiment 3](https://static-01.extrica.com/articles/17379/17379-img4.jpg)
b)
![a) The bevel gear test rig and bevel gears in [2], b) damaged spiral bevel gear in experiment 1, c) damaged spiral bevel gear in experiment 3](https://static-01.extrica.com/articles/17379/17379-img5.jpg)
c)
4.2. Data processing
TSA data was processed with gear CI algorithms presented in [26] and [27] to compute the following CIs:
(1) TSA: RMS, Kurtosis (KT), Peak-to-Peak (P2P), Crest Factor (CF); (2) Residual RMS, KT, P2P, CF; (3) Energy Operator RMS, KT; (4) Energy Ratio; (5) FM0; (6) Sideband Level factor; (7) Narrowband (NB) RMS, KT, CF; (8) Amplitude Modulation (AM) RMS, KT; (9) Derivative AM KT; (10) Frequency Modulation (FM) RMS, KT. However, not all the CIs generated from TSA data were good candidates for virtual sensing model. For the purpose of prognostics, one is interested in selecting the CIs that have shown a good trending correlation. In order to select the best CIs, correlation coefficients of the CIs with the time index were computed. The following 6 CIs with correlation coefficients over 0.5 were selected for virtual sensing model: (1) residual RMS, (2) energy operator RMS, (3) FM0, (4) narrowband kurtosis, (5) amplitude modulation kurtosis, and (6) frequency modulation RMS. Next, different dimensional reduction techniques including KPCA, PCA and LPP are performed to exploit the 6 features by fusing the extracted 21 features. In all feature selection and fusion algorithms, the reduced dimensions are set: k=4 by calculating the accumulated contribution rate (e.g. 95 %), and kernel functions are optimized using grid search algorithm, respectively.
4.3. Performance evaluation
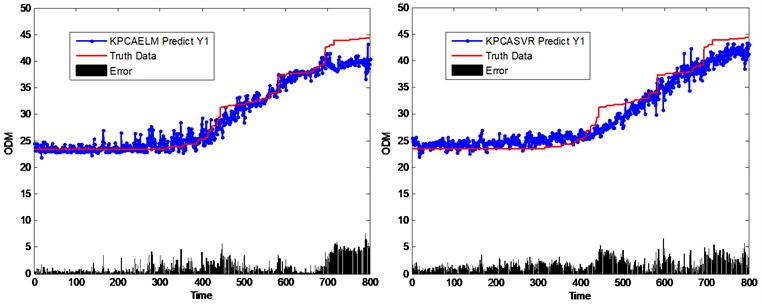
The selected and fused features obtained by KPCA, PCA and LPP are fed into the ELM model to infer the gearbox mechanical components’ conditions from the in-process vibration signals. And its parameter, hidden neurons number, is optimized by a 10-fold cross validation process. Afterwards, the performance of the proposed virtual sensing scheme is compared with SVR based virtual sensing scheme, in which two hyperparameters, the cost parameter C and the Gaussian kernel parameter γ, are selected using grid search method in the cross validation process to prevent overfitting. A total of three sets of gearbox life test data (e.g. Y1, Y2, and Y3, etc.) are available. Take dataset Y1 as example. The predicted spiral bevel gear ODM using different virtual sensing schemes including KPCA, PCA and LLP algorithms with SVR and ELM models are illustrated in Figs. 4-6, respectively. To compare their performance, the actual spiral bevel gear ODM measured offline is also included. It is found that the predicted spiral bevel gear ODM by the virtual sensing model follows the trend of the truth data well.
Fig. 4Performance comparison of different virtual sensing schemes based on PCA method
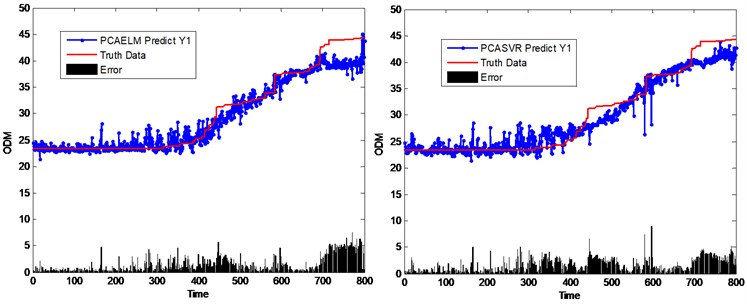
Fig. 5Performance comparison of different virtual sensing schemes based on LPP method
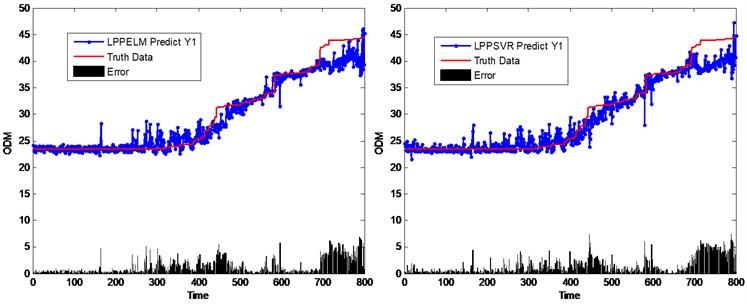
Fig. 6Performance comparison of different virtual sensing schemes based on KPCA method
To quantitatively evaluate the performance of the proposed virtual sensing model, different criteria are investigated including Pearson Correlation coefficient (PCC), Root Mean Square Error (RMSE), Mean Absolute Error (MAE), and Mean Absolute Percentage Error (MAPE). PCC is a statistical measure of independence of two or more random variables which is defined as:
where x is the actual spiral bevel gear ODM, and ˆx is the predicted spiral bevel gear ODM using the virtual sensing model. The model with the highest correlation coefficient is considered as the one of the best. RMSE is defined as the square root of the average of the square of all difference between estimated spiral bevel gear ODM ˆx and actual spiral bevel gear ODM x:
MAE is defined as the mean of all absolute difference between estimated spiral bevel gear ODM ˆx and actual spiral bevel gear ODM x:
MAPE is defined as the mean of all absolute percentage differences between estimated spiral bevel gear ODM ˆx and actual spiral bevel gear ODM x:
Fig. 7Performance comparison of different virtual sensing schemes using different criteria
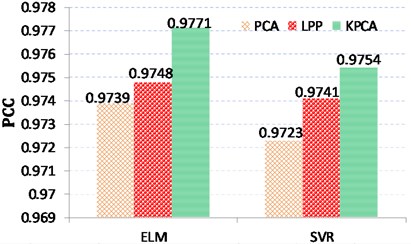
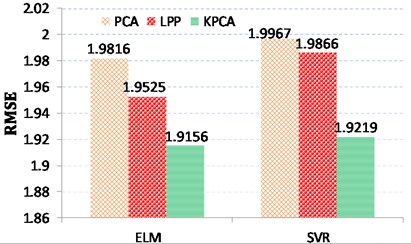
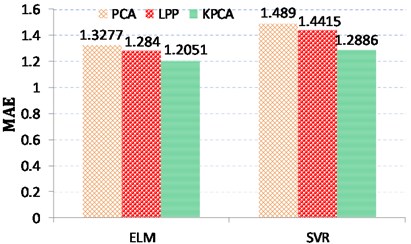
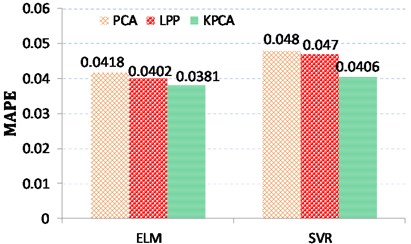
Next, three different virtual sensing schemes with SVR and ELM models are quantitatively evaluated according to different criteria including PCC, RMSE, MAE, and MAPE. The performance of these three virtual sensing schemes is compared as shown in Fig. 7. In general, the larger the PCC value, the better the model performance, while the less the RMSE/MAE/MAPE value, the better the model performance. From the perspective of estimation accuracy, it is found from Table 1 that the predicted gearbox conditions using KPCA model follows the trend of the truth data best compared with other feature selection and fusion methods. In addition, ELM based virtual sensing scheme can obtain better prediction performance in comparison with SVR based virtual sensing scheme.
Table 1Performance comparison of virtual sensing schemes based on different feature selection and fusion methods using different criteria
Methods | Prediction models | PCC | RMSE | MAE | MAPE |
PCA | ELM | 0.9739 | 1.9816 | 1.3277 | 0.0418 |
SVR | 0.9723 | 1.9967 | 1.489 | 0.048 | |
LPP | ELM | 0.9748 | 1.9525 | 1.284 | 0.0402 |
SVR | 0.9741 | 1.9866 | 1.4415 | 0.047 | |
KPCA | ELM | 0.9771 | 1.9156 | 1.2051 | 0.0381 |
SVR | 0.9754 | 1.9219 | 1.2886 | 0.0406 |
5. Conclusions
Gearboxes are key components in mechanical facilities, and gearbox defects would badly threaten safety of the whole system. Therefore, keeping gearbox running reliably is the guarantee of mechanical equipment safety. Taking advantages of advanced sensing and signal processing methods in artificial intelligence, which are critically needed for effective fault diagnosis and condition monitoring, the proposed virtual gearbox condition sensing framework utilizes in-process sensory measurements to infer the actual gearbox mechanical components’ conditions on an ELM model basis. According to the results obtained, the following conclusions can be drawn:
1) Virtual sensing technique bridges the gap between direct sensing and indirect sensing for gearbox condition monitoring and prediction.
2) Different dimension reduction techniques including KPCA, PCA and LPP algorithms have been investigated for feature selection and fusion in gearbox condition monitoring, and experimental results show that KPCA performs best.
3) The effectiveness of the proposed virtual sensing model is validated using the data from a spiral bevel gear case study. The results have shown that its performance is comparable to the costly offline instrumentation. Moreover, the proposed ELM based virtual sensing scheme outperforms SVR based virtual sensing scheme in terms of model accuracy through quantitative comparison using different criteria.
For future work, a variety of experimental tests will be performed to evaluate the robustness of the proposed method in our next-step research.
References
-
Teti R., Jemielniak K., O’Donnell G., Dornfeld D. Advanced monitoring of machining operations. CIRP Annals – Manufacturing Technology, Vol. 59, 2010, p. 717-739.
-
Dempsey P., Handschuh R., Afjeh A. Spiral Bevel Gear Damage Detection Using Decision Fusion Analysis. NASA/TM-2002-211814, 2002.
-
Liang X., Zuo M.J., Liu L. A windowing and mapping strategy for gear tooth fault detection of a planetary gearbox. Mechanical Systems and Signal Processing, Vol. 80, 2016, p. 445-459.
-
Liang X., Zuo M. J., Hoseini Mohammad R. Vibration signal modeling of a planetary gear set for tooth crack detection. Engineering Failure Analysis, Vol. 48, 2015, p. 185-200.
-
Wang P., Gao. R. X., Wang H., Yuan H. Defect growth prediction in rolling bearings based on approximate entropy. ASME 2013 Dynamic Systems and Control Conference, American Society of Mechanical Engineers, 2013.
-
Tham M. T., Montague G. A., Morris J. A., Lant P. A. Soft sensors for process estimation and inferential control. Journal of Process Control, Vol. 1, Issue 1, 1991, p. 3-14.
-
Petersen C. D., Fraanje R., Cazzolato B. S., Zander A. C., Hansen C. H. A Kalman filter approach to virtual sensing for active noise control. Mechanical Systems and Signal Processing, Vol. 22, 2008, p. 490-508.
-
Cheng J. J. W., Chao T. C., Chang L. H., Huang B. F. A model-based virtual sensing approach for the injection molding process. Polymer Engineering and Science, Vol. 44, Issue 9, 2004, p. 1605-1614.
-
Ploennigs J., Ahmed A., Hensel B., Stack P., Menzel K. Virtual sensors for estimation of energy consumption and thermal comfort in buildings with underfloor heating. Advanced Engineering Informatics, Vol. 25, Issue 4, 2011, p. 688-698.
-
Ragaglia M., Zanchettin A. M., Bascetta L., Rocco P. Accurate sensorless lead-through programming for lightweight robots in structured environments. Robotics and Computer-Integrated Manufacturing, Vol. 39, 2016, p. 9-21.
-
Huang H. C., Lin Y. C., Hung M. H., Tu C. C., Cheng F. T. Development of cloud-based automatic virtual metrology system for semiconductor industry. Robotics and Computer-Integrated Manufacturing, Vol. 34, 2015, p. 30-43.
-
Correa Bustillo M., Renones A. A virtual sensor for online fault detection of multitooth-tools. Sensors, Vol. 11, 2011, p. 2773-2795.
-
Li C. J., Tzeng T. C. Multimilling-insert wear assessment using non-linear virtual sensor, time-frequency distribution and neural networks. Mechanical Systems and Signal Processing, Vol. 14, Issue 6, 2000, p. 945-957.
-
Chen T., Wang Y. C. Estimating simulation workload in cloud manufacturing using a classifying artificial neural network ensemble approach. Robotics and Computer-Integrated Manufacturing, Vol. 38, 2016, p. 42-51.
-
He Q., Kong F., Yan R. Subspace-based gearbox condition monitoring by kernel principal component analysis. Mechanical Systems and Signal Processing, Vol. 21, 2007, p. 1755-1772.
-
Scholkopf B., Smola A., Muller K. R. Nonlinear component analysis as a kernel eigenvalue. Neural Computation, Vol. 10, 1998, p. 1299-1319.
-
Vapnik V. N. The Nature of Statistical Learning Theory. Springer, New York, 1999.
-
Widodo A., Yang B. S. Support vector machine in machine condition monitoring and fault diagnosis. Mechanical Systems and Signal Processing, Vol. 21, 2007, p. 2560-2574.
-
Wang J., Liu S., Gao R. X., Yan R. Current envelope analysis for defect identification and diagnosis in induction motors. Journal of Manufacturing Systems, Vol. 31, Issue 4, 2012, p. 380-387.
-
Huang G.-B., Zhu Q.-Y., Siew C.-K. Extreme learning machine: a new learning scheme of feedforward neural networks. Proceedings of IJCNN, Budapest, Hungary, Vol. 2, 2004, p. 985-990.
-
Huang G.-B., Zhu Q.-Y., Siew C.-K. Extreme learning machine: theory and applications. Neurocomputing, Vol. 70, Issues 1-3, 2006, p. 489-501.
-
Huang G.-B., Chen L., Siew C.-K. Universal approximation using incremental constructive feedforward networks with random hidden nodes. IEEE Transactions on Neural Networks, Vol. 17, Issue 4, 2006, p. 879-892.
-
Bartlett P. L. The sample complexity of pattern classification with neural networks: the size of the weights is more important than the size of the network. IEEE Transactions on Information Theory, Vol. 44, Issue 2, 1998, p. 525-536.
-
Serre D. Matrices: Theory and Applications. Springer Verlag, New York, 2002.
-
Rao C. R., Mitra S. K. Generalized Inverse of Matrices and Its Applications. Wiley, New York, 1971.
-
Zakrajsek J., Townsend D. P., Decker H. J. An Analysis of Gear Fault Detection Method as Applied to Pitting Fatigue Failure Damage. NASA Technical Memorandum 105950, 1993.
-
Wemhoff E., Chin H., Begin M. Gearbox diagnostics development using dynamic modeling. Proceedings of AHS 63rd Annual Forum, Virginia Beach, VA, 2007.
About this article
This research acknowledges the financial support provided by the National Science foundation of China (Nos. 51504274 and 51674277), the National Key Research and Development Program of China (No. 2016YFC0802103), Science Foundation of China University of Petroleum, Beijing (No. 2462014YJRC039 and 2462015YQ0403). The authors would like to thank the anonymous reviewers for their constructive comments, which have helped improve the paper.
Jinjiang Wang proposed the innovative idea, and was responsible for the writing of the paper. Yinghao Zheng performed the experiment, collected and processed data in the whole process, which was very important for finishing paper. Lixiang Duan offered guiding opinions for framework design of the paper. Junyao Xie provided constructive comments for data analysis and interpretation in the whole process of finishing paper. Laibin Zhang revised the paper critically for important intellectual content.

