Abstract
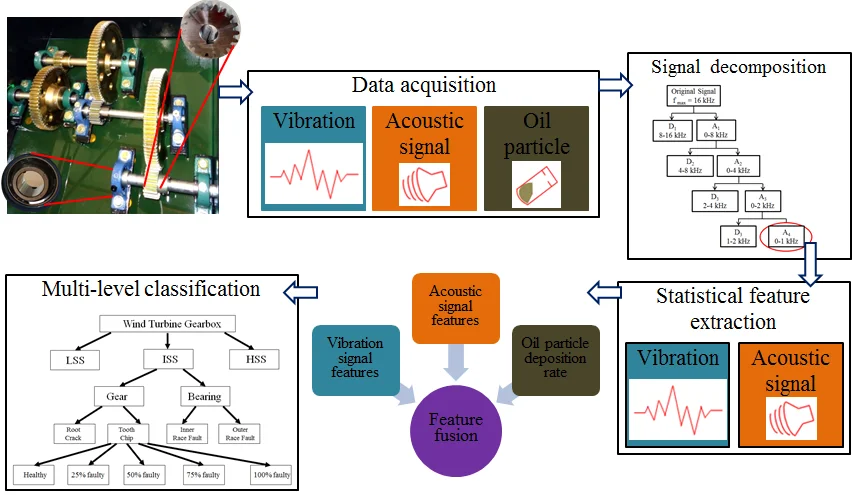
Majority of the previous research investigations on fault diagnostics in a wind turbine gearbox are limited to binary classification, i.e., either detecting the type of defect or severities of defect. However, wind turbine gearbox consists of multiple speed stages and components, therefore performing the binary classification is not adequate. In the present study, a multi-level classification scheme which is capable of classifying the defects by stage, component, type of defect and severity level is proposed. Experiments are performed and the response is recorded through vibration, acoustic signal and lubrication oil analysis. Later, an integrated multi-variable feature set is achieved by combining the statistical features of the above mentioned individual condition monitoring strategies. Further, the obtained integrated multi-variable feature set is subjected to multi-level classification using various machine learning models and the learning model that best suits for carrying the multi-level classification is investigated. Finally, the hyperparameters of the learning models are optimized by an iterative process of reducing the objective function. It is observed that, optimized support vector machine model has yielded favorable results when compared to other machine learning models with the overall classification accuracy of 82.52 % for the four-level classification.
Highlights
- Integration of individual condition monitoring techniques to device a multi-variable integrated feature set
- Multi-level feature classification on a wind turbine gearbox using various machine learning algorithms
- Investigating the best algorithm after optimizing the hyperparameters of the learning models for carrying the multi-level classification
- Predicting the severity of gears as well as bearings of a wind turbine gearbox operating under fluctuating speeds
1. Introduction
The maintenance costs of wind power plants are significantly higher and the primary objective of condition based maintenance (CBM) is to reduce the unexpected downtime and further to reduce the operational and maintenance (O&M) costs. Gearbox of wind turbine is regarded as a critical component of the transmission system and a failure in the associated components of the gearbox (bearings/gears) can lead to huge economic losses. Local defects such as bearing race defects and gear tooth defects are to be diagnosed during their nascent level otherwise they may lead to secondary defects of the associated system. Condition monitoring (CM) is a maintenance strategy capable of diagnosing the defects precisely, which works basically on historical data which is being collected. CM involves the installation of sensors, data acquisition, processing the acquired signal, evoking the diagnostic information and decision making with the help of software driven algorithms [1]. Vibration and lubrication oil monitoring are the widely implemented CM strategies in order to monitor the condition of wind turbine gearbox [2-4]. However, contemporary investigations are more concerned about the integration of individual CM strategies as it is capable of diagnosing various types of defects, quantifying the defect severity and suitable for various ranges of operating speeds [5]. On the other hand, processing the acquired raw data and extracting the suitable diagnostic information is also a thrust area of research and many research investigations have described about the various algorithms such as wavelet transform, empirical mode decomposition, variational mode decomposition etc. [3, 6, 7]. Application of a suitable signal processing approach assisted with machine learning algorithms has received considerable attention and many authors have devoted their efforts to detect the defects present in bearings and gears.
However, the majority of the investigations are focused towards the fault diagnosis of either bearings/gears of a gearbox. In addition to that, the research studies have implemented machine learning algorithms in order to classify the defects present at a single-stage of the gearbox. In fact, most of the investigations are limited to a binary or single-level of classification, i.e., either type of defect or different severities of defect. Whereas, wind turbine gearbox is a multi-stage gearbox and it requires multi-level feature classification rather than a binary classification. In order to bridge these gaps, the current investigation attempts to propose a multi-level classification scheme which is capable of classifying the defects by stage, component, type of defect and severity level. Initially, an integrated multi-variable feature set is achieved by combining the statistical features from vibration, acoustic signal and lubrication oil analysis. Further, the obtained integrated multi-variable feature set is subjected to multi-level classification using various machine learning algorithms. Finally, the machine learning algorithm that best suits for carrying the multi-level classification is investigated.
2. Methodology
2.1. Experimental test rig
A laboratory scaled wind turbine gearbox with a typical gear ratio of 48:1 was designed and developed at BITS Pilani, Hyderabad campus. The gearbox consists of three speed stages, namely, high speed stage (HSS), intermediate speed stage (ISS) and low speed stage (LSS). Every stage of the gearbox consists of a pair of pinion and gear connected by the shaft, and the shaft was supported by two ball bearings. The bearing close to pinion was test bearing and the bearing far from the pinion was support bearing. A 1-hp motor was used to drive the HSS, which further drives the subsequent stages. All the mating components were lubricated by gear oil (80w-90), refer Fig. 1 [4]. The experiments pertaining to gears were performed on pinion and the experiments related to bearings were performed on test bearing of each speed stage. An axial slit on the bearing race (inner as well as outer) and at the root of the pinion teeth was seeded individually and the depth of slit was varied (from 1.4 mm to 3.8 mm on inner race, 1 mm to 2.2 mm on outer race and 1 mm to 4 mm at tooth root) to achieve the different fault severity levels (25 % fault to 100 % fault). Similarly tooth chip was created by removing some portion of the teeth along the face of the teeth and the width of chip was varied from 1.5 mm to 6 mm which corresponds to the defect severity level of 25 % to 100 % fault. The similar type of defect simulation was done on all the speed stages of the gearbox. Accelerometers (frequency range 0.7 Hz to 10 kHz and sensitivity 100 mV/g) were mounted on the top of bearings and microphones were situated on the top of bearings and oil particle counting sensor was immersed in the lubrication oil. All the sensors were connected to computer through data logger and the data was acquired with a sampling frequency of 16 kHz. The acquired raw vibration and acoustic signal signatures are subjected to further processing using discrete wavelet transform.
2.2. Experimental procedure
Discrete wavelet transform (DWT) decomposes the raw signatures based on their frequency bands. It decomposes the signal to high frequency detail and low frequency approximation coefficients and the approximation coefficients are subjected to next level of decomposition. Here, four-level decomposition with the help of Haar wavelet is performed to achieve the fourth level approximation coefficients cA4 corresponding to the frequency band of 0-625 Hz and statistical features are computed from cA4 for vibration and acoustic signals individually [4]. A total of thirteen statistical features from vibration signals, thirteen from acoustic signals and the overall oil particle deposition rate are computed. The most significant among the extracted are identified by decision tree algorithm. The features suggested are, root mean square (RMS) value, standard error, kurtosis and skewness [5]. As mentioned earlier, integrated multi-variable feature set is formed by combing the features from the individual CM analysis. Therefore, four features from vibration analysis, four features from acoustic signal analysis and one from oil analysis are combined to devise the integrated multi-variable feature set. For every test condition of bearing (either of HSS/ISS), 150 observations are considered and for every test condition of gear (either of HSS/ISS), 120 observations are considered. Similarly, for every test condition of LSS bearing as well as gear, 120 observations are considered. The order of the integrated multi-variable feature set is as described in the Table 1. The obtained integrated feature set is supplied as input to the machine learning algorithms for further classification. In this study, three most widely used machine learning algorithms, namely, k-nearest neighbours (k-NN), support vector machine (SVM) and discriminant analysis (DA) are considered to perform the multi-level classification [8].
Table 1Order of the integrated multi-variable feature set for different stages of the gearbox
Name of the speed stage | Name of the component | Type of the defect | Order of the feature set |
HSS | Bearing | Inner race fault (IRF) | 9 rows and 750 columns (5 cases * 150) |
Outer race fault (ORF) | 9 rows and 750 columns (5 cases * 150) | ||
Gear | Tooth root crack (RC) | 9 rows and 600 columns (5 cases * 120) | |
Tooth chip (TC) | 9 rows and 600 columns (5 cases * 120) | ||
ISS | Bearing | Inner race fault (IRF) | 9 rows and 750 columns (5 cases * 150) |
Outer race fault (ORF) | 9 rows and 750 columns (5 cases * 150) | ||
Gear | Tooth root crack (RC) | 9 rows and 600 columns (5 cases * 120) | |
Tooth chip (TC) | 9 rows and 600 columns (5 cases * 120) | ||
LSS | Bearing | Inner race fault (IRF) | 9 rows and 600 columns (5 cases * 120) |
Outer race fault (ORF) | 9 rows and 600 columns (5 cases * 120) | ||
Gear | Tooth root crack (RC) | 9 rows and 600 columns (5 cases * 120) | |
Tooth chip (TC) | 9 rows and 600 columns (5 cases * 120) | ||
Total input matrix size | 9 rows and 7800 columns | ||
Order of the training data (70 %) | 9 rows and 5460 columns | ||
Order of the testing data (30 %) | 9 rows and 2340 columns | ||
3. Multi-level classification
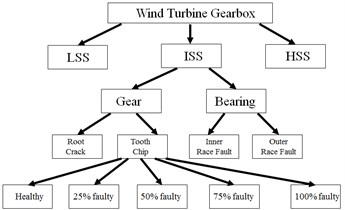
A four-level classification is required to understand the location and severity of fault arising in the multi stage gearbox. The first level classification is used to separate in which speed stage of the shaft the fault is arising from i.e., either from HSS, ISS or LSS. The second level of classification identifies the component from which the fault is arising from i.e., either from gear or bearing. The third level of classification identifies the type of the fault, if it is a gear it will classify as root crack or tooth chip, whereas, if it is a bearing, it will classify as inner race or outer race fault. The last level of classification identifies the severity level of the fault i.e., healthy, 25 % faulty, 50 % faulty, 75 % faulty and 100 % faulty. A small glimpse of the multi-level classification scheme for an intermediate speed stage with tooth chip fault is as shown in Fig. 2.
Fig. 1Wind turbine gearbox bench top with sensors
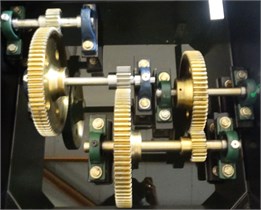
Fig. 2Classification scheme
Among the various machine learning algorithms that are available, we have considered seven most widely implemented models for classification purpose. The models are, fine k-NN, weighted k-NN, optimized k-NN, optimized polynomial SVM, fine Gaussian SVM, quadratic DA and optimized DA. The brief description about the machine learning models is given in the Table 2. Initially, all the above models are trained for a single classification level and the model hat yields highest accuracy is identified as best model. Further, we obtain the best model for each classification level based on their maximum accuracy. Later, the obtained best models are used to combine the output for the necessary classification scheme. Hyperparameters are to be specified manually to the learning models as these are used further to estimate the model parameters during training process. The optimized models generally have the highest accuracy as they iterate the model hyperparameters and choose the best parameters for the models based on thirty iterations. The integrated multi-variable feature matrix is supplied as input to the learning models for training the model.
Table 2Machine learning models
Name of the model | Significant hyperparameters of the model |
Fine k-NN | Nearest neighbour classifier with number of nearest neighbours as 1 |
Weighted k-NN | Uses a distance weighting function with Euclidean distance operator with 1 nearest neighbour |
Optimized k-NN | Optimized hyperparameters in k-NN |
Optimized SVM | Support vector machine with kernel function as polynomial with optimized hyperparameters |
Fine Gaussian SVM | Support vector machine with kernel function as Gaussian with a kernel scale of 0.75 |
Quadratic DA | Discriminant analysis with a discriminant type as quadratic |
Optimized DA | Discriminant analysis with optimized hyperparameters |
4. Results and discussion
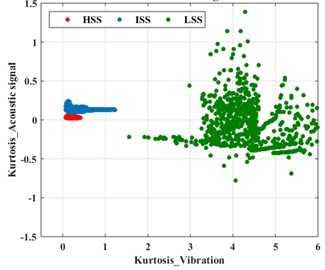
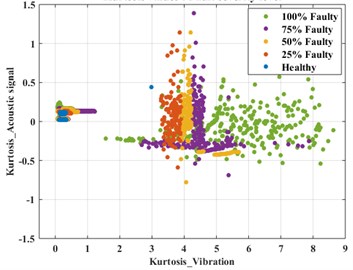
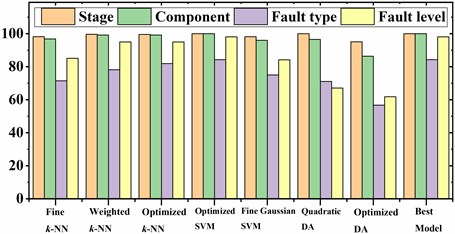
Before supplying the integrated multi-variable feature data as input to the classification algorithms, the non-linear nature of the input data has to be analyzed. Hence, the RMS values of vibration signals are plotted on the x-axis and the RMS values of acoustic signal are plotted on the y-axis, and it is shown in Fig. 3. It can be observed that, there exists a considerable discrimination between the clusters of different speed stages. However, these clusters are scattered all over the feature space while plotted between the various fault severity levels, refer Fig. 3(b). Therefore, a single machine learning model may not be efficient for performing the classification at different levels. Among the available input integrated feature data (described in Table 1), 70 % is used for training the model and 30 % is reserved for testing the model and the obtained classification accuracies for different levels of classification are illustrated in Fig. 4. It can be observed that, for classification amongst stages, quadratic discriminant analysis and optimized SVM have provided the maximum accuracy of 100 %, for the component level classification optimized SVM and optimized k-NN provided classification accuracies of 100 % and 99.23 % respectively. The classification amongst fault types fetched the least accuracy amongst other classifications with optimized SVM and optimized k-NN models lending an accuracy of 84.27 % and 81.96 % respectively. The classification amongst fault severity levels saw the maximum accuracy of 98.11 % from optimized SVM and 95 % from weighted k-NN models. Therefore, the models with maximum accuracy were chosen for the overall classification purpose. Optimized SVM models performed better than other models in terms of accuracy because they continuously choose the best hyper parameters for training the model based on the iterative process of minimizing the objective function value. The confusion matrix is used to analyze the extent of effect of false positives and false negatives on the model performance. If there is a fault in gear but our model predicts the fault in the bearing, it can have substantial effects on the maintenance costs. The confusion matrix for the best classification models for 2340 data sets (which is 30 % of the total input matrix) are shown in Tables 3-6. It was observed that the multi-level classification has an overall accuracy of 82.25 % considering that all four classifications are predicted correctly.
Fig. 3Scatter plots for classification: a) speed stage, b) fault severity levels
a)
b)
Table 3Confusion matrix for stage wise
HSS | ISS | LSS | Stage class |
810 | 0 | 0 | HSS |
0 | 810 | 0 | ISS |
0 | 0 | 720 | LSS |
Table 4Confusion matrix for component wise
Gear | Bearing | Component class |
1079 | 1 | Gear |
0 | 1280 | Bearing |
Table 5Confusion matrix for fault type wise
IRF | ORF | RC | TC | Fault type class |
525 | 104 | 0 | 1 | IRF |
78 | 552 | 0 | 0 | ORF |
1 | 0 | 445 | 94 | RC |
0 | 0 | 90 | 450 | TC |
Table 6Confusion matrix for fault severity wise
Healthy | 25 % faulty | 50 % faulty | 75 % faulty | 100 % faulty | Fault severity class |
466 | 1 | 1 | 0 | 0 | Healthy |
6 | 455 | 6 | 1 | 0 | 25 % faulty |
2 | 4 | 460 | 2 | 0 | 50 % faulty |
2 | 2 | 2 | 460 | 2 | 75 % faulty |
1 | 0 | 0 | 0 | 467 | 100 % faulty |
Fig. 4Classification accuracy amongst levels
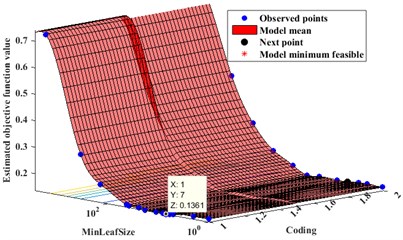
It can be observed that while training the best models in each classification level, the optimized version of the machine learning algorithm fetches the maximum accuracy. These hyperparameters can be weighting functions, kernel functions, distance functions, number of nearest neighbors etc. depending on the type of algorithm used. The iterative process tries a different combination of hyperparameter values and generates an objective function model value which converges at the end of the iteration. Every algorithm has a certain set of hyperparameters which needs to be tuned to reduce the error. The minimum validation classification error is to be reduced at the end of the iterative process and the set of hyperparameters which leads to the lowest error is chosen as the optimized parameters. The optimizable model always does not yield a higher accuracy than the standard models, but the number of iterations can be increased to obtain better results. There is also a problem of overfitting with the optimizable models, so it is better to compare these models with the standard models to resolve the problems of overfitting or bias. Fig. 5 represents the plot of error with the number of iterations for an optimizable SVM model for the fault type classification. The hyperparameters are minimum leaf size (size of the model) which signifies the ability to capture noise in data and one vs one or one vs all classification which signifies the number of binary classifiers used. The hyperparameter optimization yielded a minimum leaf size of 20 and one vs all classification with an objective function value of 0.13615 at fifteenth iteration. Fig. 6 depicts the surface plot of the variation of objective function value with hyperparameters. It can be seen that it flattens out after a certain point in the figure which is known as the model minimum at which the model converges for the optimized set of hyperparameters.
Fig. 5Evaluation of objective value over function
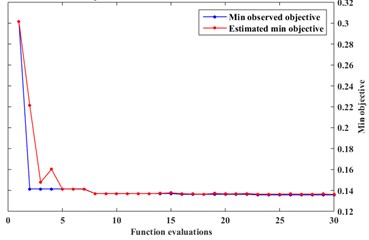
Fig. 6Objective function model
5. Conclusions
A multi-level classification scheme which is capable of classifying the defects by stage, component, type of defect and severity level is proposed. Experiments are performed on a three-stage wind turbine gearbox and the response through vibration, acoustic signal and oil analysis was recorded. Later, an integrated multi-variable feature set is achieved by combining the statistical features from above mentioned condition monitoring strategies. Further, the obtained integrated multi-variable feature set is subjected to multi-level classification using various machine learning algorithms. The best model was chosen for each level of classification based on the maximum accuracy of the model at each level. The accuracies are obtained for classifications amongst stage, component, fault type and fault levels are 100 %, 100 %, 84.27 % and 98.11 % respectively. Optimised SVM model has yielded for favorable results and the overall classification accuracy for the four-level classification is 82.52 %. An improvised approach for training the machine learning algorithms were discussed where the hyperparameters are optimized by an iterative process of reducing the objective function.
References
-
Kar C., Mohanty A. R. Monitoring gear vibrations through motor current signature analysis and wavelet transform. Mechanical Systems and Signal Processing, Vol. 20, Issue 1, 2006, p. 158-187.
-
Peng Z., Kessissoglou N. An integrated approach to fault diagnosis of machinery using wear debris and vibration analysis. Wear, Vol. 255, Issues 7-12, 2003, p. 1221-1232.
-
Loutas T. H., Roulias D., Pauly E., Kostopoulos V. The combined use of vibration, acoustic emission and oil debris on-line monitoring towards a more effective condition monitoring of rotating machinery. Mechanical Systems and Signal Processing, Vol. 25, Issue 4, 2011, p. 1339-1352.
-
Vamsi I., Sabareesh G. R., Penumakala P. K. Comparison of condition monitoring techniques in assessing fault severity for a wind turbine gearbox under non-stationary loading. Mechanical Systems and Signal Processing, Vol. 124, 2019, p. 1-20.
-
Inturi V., Sabareesh G. R., Supradeepan K., Penumakala P. K. Integrated condition monitoring scheme for bearing fault diagnosis of a wind turbine gearbox. Journal of Vibration and Control, Vol. 25, Issue 12, 2019, p. 1852-1865.
-
Chen D., Lin J., Li Y. Modified complementary ensemble empirical mode decomposition and intrinsic mode functions evaluation index for high-speed train gearbox fault diagnosis. Journal of Sound and Vibration, Vol. 424, 2018, p. 192-207.
-
Mohanty S., Gupta K. K., Raju K. S. Hurst based vibro-acoustic feature extraction of bearing using EMD and VMD. Measurement, Vol. 117, 2018, p. 200-220.
-
Stetco A., Dinmohammadi F., Zhao X., Robu V., Flynn D., Barnes M., Keane J., Nenadic G. Machine learning methods for wind turbine condition monitoring: a review. Renewable Energy, Vol. 133, 2019, p. 620-635.

