Abstract
This paper proposes singular spectrum analysis (SSA) based feature extraction method in Lamb wave based damage detection. SSA is used for the decomposition of the acquired Lamb wave signal into an additive set of principal components and a new universal approach for selection of the principal components is presented. The principal components which contain the least measurement noise and the most damage information are then used to detect local damage in an aluminum plate and a new approach based on the maximum likelihood analysis for damage signal decomposition is proposed. Genetic algorithm is adopted for the purpose of making the similarity between the synthetic signal and the target signal reach the maximum. The experimental result shows that the proposed method is capable of yielding accurate identified results with noisy measurement.
1. Introduction
Acousto-ultrasonic waves have shown great potential for damage detection in metallic and composite structures (e.g. [1-7]). This is particularly relevant to guided waves such as Lamb waves. Lamb waves are guided waves in traction-free thin plates. Plate-like structures are common in a number of aerospace, ground and sea transportation applications. Therefore Lamb waves are often used for crack monitoring in metallic structures and impact damage detection in composite structures. However, during the generation and sampling of wave signals, various types of noise are induced unavoidably, which will inevitably result in big error or even false judgment. Besides, many existing methods for extracting damage scattered signal are sensitive to external factors such as the environment and it is often difficult to extract damage scattered waves from the reflected sources since there are boundary reflected waves exist. Thus, how to reduce the noise interference and obtain a good extraction result becomes the key point for damage detection.
Singular spectrum analysis (SSA) which is based on singular value decomposition (SVD) has been used in many applications. Broomhead and King [8] have made the original contribution of SSA for reporting that the singular value decomposition is effective for noise reduction. This technique has been adopted in forecasting, smoothing, filtering, trend extraction [9], and it has been used in many research areas such as climatology [10, 11], biosciences [12], geology [13, 14], economics [15] and solar physics [16]. Some researchers [17-19] also adopted the SSA technique in structural engineering.
In this work, a simple time series method for experimental data processing in structure damage detection using SSA is proposed. A new approach for the selection of the principal components are discussed which just need to determine the optimal components but not the unique components. In the experimental analysis, active Lamb wave technique is used for the damage detection of an aluminum plate and a selected subset of the singular values is adopted as the dynamic feature. An approach based on the maximum likelihood analysis is then proposed. Damage reflected signal and boundary reflected signal are simulated on the basis of analyzing Lamb wave propagation characteristics, and various parameters of the synthetic signal are optimized through genetic algorithm in order to make the similarity between the synthetic signal and the target signal reach the maximum.
2. Singular spectrum analysis
SSA is a time series analysis technique which decomposes the signal into an additive set of independent time series (principal components). In this paper SSA is applied to the response obtained by the experiment. The SSA algorithm is described below.
2.1. Embedding
A trajectory matrix or a lagged version is obtained during this step. Let y=[y1,y2,…,yN] be a time series of length N, L is an integer (window length) and K is the number of lagged vector (K=N-L+1). The obtained trajectory matrix is defined as:
Eq. (1) shows that the trajectory matrix is a Hankel matrix since all the elements along the ‘anti-diagonals’ are the same.
2.2. Singular value decomposition (SVD)
In this step, the SVD of the matrix Y is obtained. It is further decomposed into a sum of mutually orthogonal, unit-rank, elementary matrices. Let S=YYT be a L×L matrix. Let λ1, λ2,…, λr be the non-zero eigenvalues of S (r=L if no eigenvalue is zero) arranged in decreasing order, and U1, U2,…, Ur be the corresponding eigenvectors. The vectors Vj=YT(Uj/√λj) for j= 1, 2,…, r is constructed.
The SVD of the trajectory matrix Y can be written as:
where Yj=√λjUjVTj.
The obtained L numbers of singular value are the square roots of the eigenvalues of matrix S. The plot of the singular value in decreasing order is known as singular spectrum, and thus gives the method its name.
2.3. Diagonal averaging
Each matrix of Eq. (2) is transformed into a new time series of length N by applying a linear transformation known as diagonal averaging. The diagonal averaging algorithm is as follows:
Since Y is an L×K matrix with elements yij, 1 ≤i≤L, 1 ≤j≤K. Set L*=min(L,K), K*=max(L,K) and N=L+K-1. Let y*ij=yij if L<K and y*ij=yji otherwise. By averaging the diagonal the matrix Y is transferred into the series y1,…, yN using the formula:
The diagonal averaging procedure is applied to all the selected matrix components (Y1, Y2,…, Yr) to form Hankel matrices (ˉY1, ˉY2,…, ˉYr). Each Hankel matrix determines a time series that is recognized as the projection of the original signal in the corresponding direction determined by the corresponding eigentriple. Then the sum of all selected projected time series component represents the reconstructed signal.
2.4. Parameter selection
It should be mentioned that two parameters are required in SSA: the window length L and the number of reconstructed components r. A detailed description of parameter selection is presented in Golyandina et al. [9]. Values for L and r could be defined using information provided by the time series under study or through additional indices. The general rule is to select L=N/2, which is also the value used in this paper. The dimension of the selected components, which is defined as r, is very important. In fact the “selection” of useful signals with SSA is still under studied with no unified approach. However, by the data structure of Hankel matrix it can be seen that the next row vector is just lagging one data point compare to the front row vector. Therefore the adjacent two lines of the noise-free Hankel matrix (in a morbid form) will be highly correlated, and the rank r is much smaller than min (m, n). The number of non-zero singular value is equal to the rank of the matrix according to the theory of SVD, which means only the first r singular values are non-zero, while the rest are substantially zero. And there will be a curve exists at the turning point.
For the noise constructed Hankel matrix, the autocorrelation function of noise sequence ζ(i) is as follows:
where b is standard deviation of ζ(i), δ(τ) is Kronecker function:
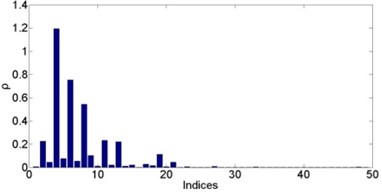
Eq. (4) and Eq. (5) show that there is no correlation between the two adjacent rows of the noise constructed Hankel matrix, the matrix is benign with rank r=min(m,n). There will be no turning point exists in the singular value curve for the noise-only condition. Thus, the turning point of the singular value curve can be the distinction of real signal and noise involved signal. At this turning point energy of the real signal is more concentrated, while the noise energy is relatively dispersed. It can be concluded that there will be a “peak” (not unique) at the boundary between signal and noise, and noise makes main contribution after that “peak”. Singular value differential spectrum value is then defined as:
By Eq. (6) we can select the critical point r (also not unique) to be the reconstructed components.
3. Damage detection for an aluminum plate that integrating SSA and Lamb waves
3.1. Modeling Lamb wave for damage detection
This subsection is mainly about the introduction of active Lamb wave in structure damage detection. Lamb waves are firstly inspired by piezoelectric ceramics and narrow band excitation is applied here which has a form as bellows:
where n is the peak number, fc is the center frequency, A is the amplitude modulation and H is the Heaviside step function.
The inspired field quantity is expressed as u(x,t), where x presents the propagation distance and t presents the propagation time. If one point of u(x,t) and the propagation characteristics of Lamb waves are known, then any point of u(x,t) may be obtained by the phase shift of each frequency component. And u(x,t) can be expressed as [20]:
where k(ω) is the wave number, ω is the angular frequency and F(ω) is the Fourier transform of f(t).
During the propagation the inspired signal will encounter reflector (such as damage spot or boundary) and the reflected signal g(t) is typically superimposed by different reflected sources. The reflected signal to the sensor which is going across the jth reflected source can be expressed as:
where dj is the distance between actuator and reflector, xj is the distance between reflector and sensor, A(ω)j is the reflection coefficient.
The propagation distance from the actuator to the sensor is defined as lj and:
Then Eq. (9) can be expressed as:
Fig. 1Schematic diagram of detection principle
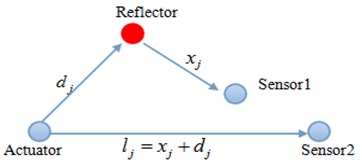
Eq. (9) and Eq. (11) show that signal from the jth reflected source gj(t) can be considered as the propagation signal from the actuator to another sensor (see Fig. 1).
3.2. Damage detection based on the maximum similarity analysis
In this subsection the maximum similarity analysis method is introduced. This method is based on the priori knowledge as below:
1. Dispersion characteristics of the propagated Lamb waves are obtained from the material properties;
2. Direct wave arrival time is known when structural model dimensions and actuator/sensor arrangement are determined;
3. Reflected signal is typically superimposed by different reflected sources and it can be determined by the form of the inspired signal and propagation distance.
It is assumed that there are totally n reflected sources and all of them (damage scattered waves or boundary reflected waves) can be determined by Eq. (11), the synthetic signal that consists of damage scattered waves and boundary reflected waves is further obtained as:
where an is the control factor of the amplitude.
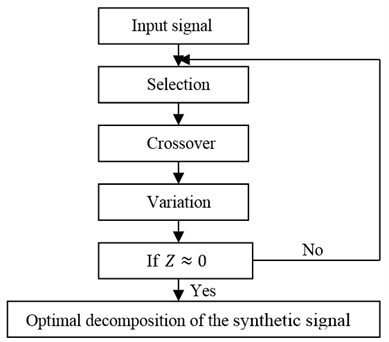
Then the extraction of damage scattered signal can be converted to the optimization problem: Parameter optimization (an, ln and n) that base on the Genetic Algorithms (GA). Cosine method [21] is applied to be the similarity index to measure the degree of coincidence between the synthetic signal and the target signal, the formula is as follows:
where x presents the synthetic signal and y presents the target signal. The fitness function is as follows:
The two signals have a better similarity when fitness function value is closer to zero. Fig. 2 shows the main process of the maximum similarity analysis that based on GA.
Fig. 2Block diagram
3.3. Damage location
Time of Flight [22] method is used for damage location. The actuator and sensor can be regarded as two focus of an ellipse, which means the ellipse can be determined. However, damage can’t be located if only one ellipse is known. So another sensor is added for obtaining a second ellipse and the intersection of the two ellipses is the exact damage location.
3.4. Experiment analysis
Test device and specimen are shown in Fig. 3 and Fig. 4, including Sonox P5 circular piezoelectric plate (diameter is 6 mm), RIGOL DG1022 Arbitrary Waveform Generator, HVPA05 amplifier, Tektronix TDS2014C oscilloscopes and 2024-T3 aluminum specimen (dimension is 600 mm×600 mm×1 mm). The boundary-free aluminum plate is supported by foam and the material parameters are shown in Table 1. Three piezoelectric sheets are pasted with conductive silver colloid. PZT A is actuator, PZT B and PZT C is sensor. A transparent hole (diameter is 5 mm) is represented for the damage, five-cycle sine signal (modulated with Hanning window) is adopted as the inspired signal, with the center frequency of 300 KHz and the inspired voltage peak is 20 V. In addition, TDS2014C digital oscilloscope is set to 256 times average automatically processing in order to improve the stability and signal to noise ratio, and trigger interval is set to 1 second to ensure that the last inspiration and reflection disappear completely. Equipment and each piezoelectric sheet are accessed to the ground to avoid electromagnetic interference wave packet.
Fig. 3Test device
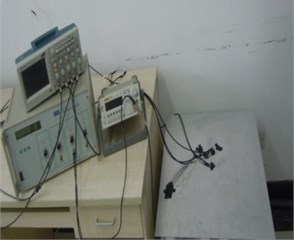
Fig. 4Test specimen
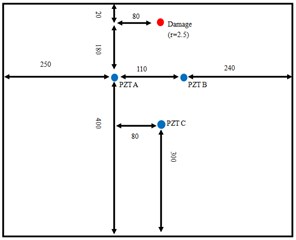
Table 1Material parameters of the aluminum sheet (cl: longitudinal wave velocity; ct: shear wave velocity)
E (GPa) | ρ (kg/m3) | h (mm) | cl (m/s) | ct (m/s) |
72.4 | 2780 | 1 | 6211.8 | 3129 |
Original response signal of path AB is shown in Fig. 5. SSA technique is applied for the original signal and the singular value differential spectrum is shown in Fig. 6. In Fig. 6 “peak” exist when r is equal to 2, 4, 6, 8, 9, 11, 13 and 19. The reconstructed results of these components are plotted in Fig. 6 respectively. The first 19 components reconstructed result is a very accurate approximation to the real response on comparison of Fig. 5 and Fig. 7. Since no aliasing happens in direct wave so the target signal can be simplified as the dashed frame part of Fig. 7(h).
Fig. 5Damage signal captured by PZT B
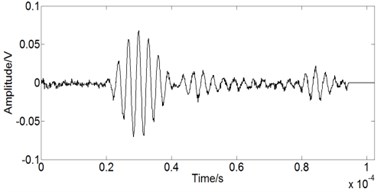
Fig. 6Singular value differential spectrum
Maximum similarity analysis that based on GA is applied for the optimization of the target signal and the optimization results are shown in Table 2. Here n presents the number of reflected waves (damage scattered wave or boundary reflected waves). The accurate propagation distance l and propagation time t of the boundary reflected wave can be obtained by the position of the sensor and the boundary (see Table 3).
Fig. 7Reconstructed responses with different combinations of components
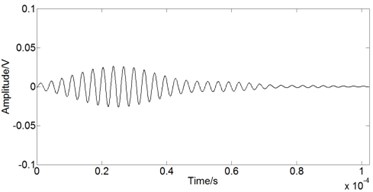
a) First 2 components
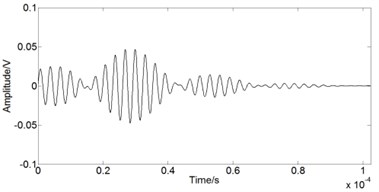
b) First 4 components
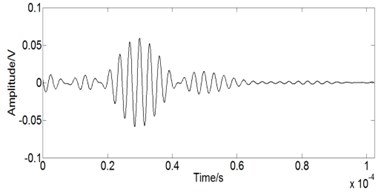
c) First 6 components
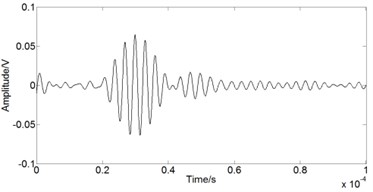
d) First 8 components
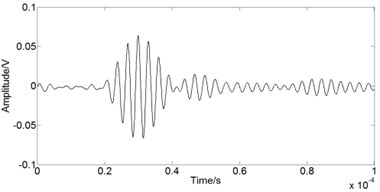
e) First 9 components
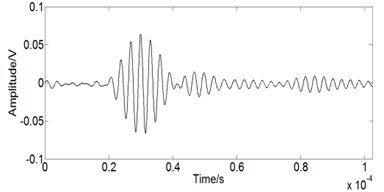
f) First 11 components
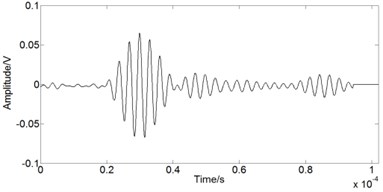
g) First 13 components
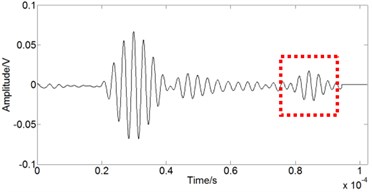
h) First 19 components
Table 2Optimization results by GA
n | Z | ln (m) | an |
1 | 0.342 | 0.410 | 0.440 |
2 | 0.099 | 0.380, 0.416 | –0.425, 0.434 |
3 | 0.128 | 0.415, 0.379, 0.417 | 0.574, 1.030, 1.433 |
4 | 0.185 | 0.223, 0.406, 0.440, 0.408 | 0.078, 0.916, 0.440, 0.408 |
5 | 0.068 | 0.393, 0.432, 0.409, 0.446, 0.388 | 1.678, 0.538, 0.961, 0.946, 2.559 |
Table 3Boundary path
Parameter | Upper boundary | Lower boundary | Left boundary | Right boundary |
l (m) | 0.415 | 0.808 | 0.66 | 0.59 |
t (10-5 s) | 7.701 | 14.993 | 12.254 | 10.954 |
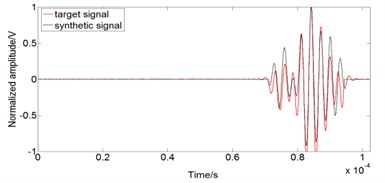
Table 3 shows the accurate propagation distance l is equal to 0.415, and 0.415 also appears in Table 3 when n= 2 and n= 3. Since there will be only one damage scattered wave and the rest are boundary reflected waves, optimization results match the known conditions best when n= 2. So the synthetic signal contains two waves: damage scattered wave and upper boundary reflected wave. The time domain waveform is shown in Fig. 8. Fig. 9 shows the comparison of synthetic signal and target signal. In addition, Fig. 4 shows that the accurate propagation of damage scattered wave laccurate is equal to 0.3795 m, while the optimization results fit it very well (lcalculate=0.380, see Table 2).
Fig. 8Reflected signal
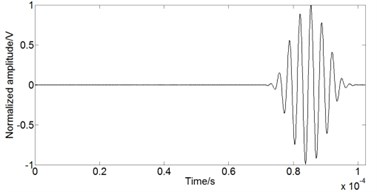
a) Boundary reflected wave
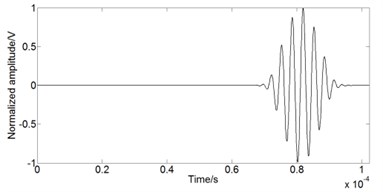
b) Damage scattered wave
Fig. 9Comparison of synthetic signal and target signal
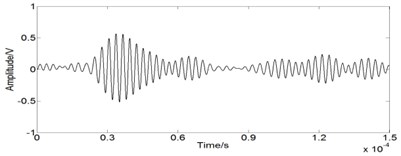
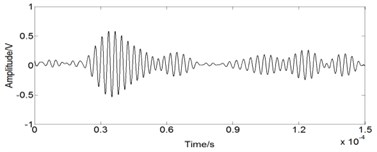
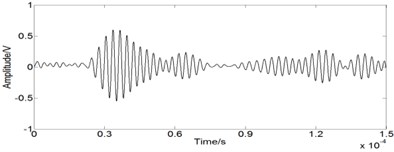
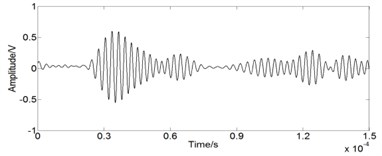
In order to obtain the exact damage location another path AC is analyzed. Fig. 10 shows the original response signal of path AC. SSA technique is also applied for the original signal and the singular value differential spectrum is shown in Fig. 11. “Peak” exists when r is equal to 2, 4, 6, 8, 10, 11, 13, 15, 17, 19, 21 and 24. The reconstructed results of these components are plotted in Fig. 12 respectively. The first 21 components reconstructed result is a very accurate approximation to the real response on comparison of Fig. 10 and Fig. 12. The same optimization analysis is conducted and Table 4 shows the damage localization results. The identification results show that the damage location can be identified accurately with small positive errors when the best reconstructed components are selected. Fig. 13 shows the comparison of the actual position and the ellipse orientation position.
Fig. 10Damage signal captured by PZT C
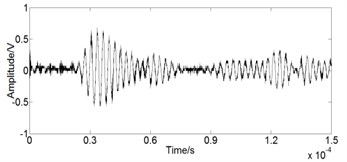
Fig. 11Singular value differential spectrum
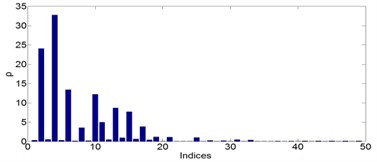
Table 4Damage localization results
Path | (l)actual / m | (l)calculate / m | Actual position / m | Calculate position / m | Error / m |
AB | 0.3795 | 0.3810 | (0.33, 0.58) | (0.3321, 0.5801) | 0.0021 |
AC | 0.4770 | 0.4780 |
Fig. 12Reconstructed responses with different combinations of components
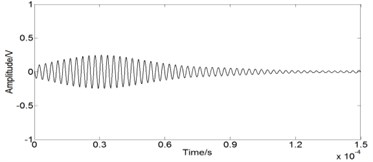
a) First 2 components
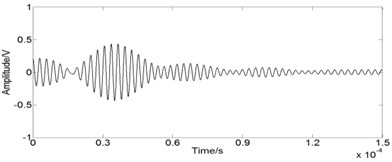
b) First 4 components
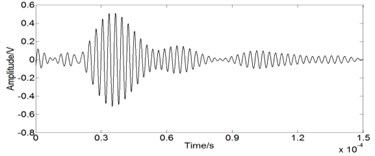
c) First 6 components
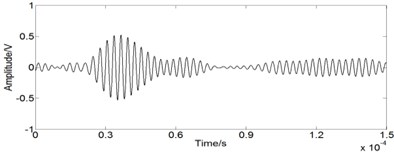
d) First 8 components
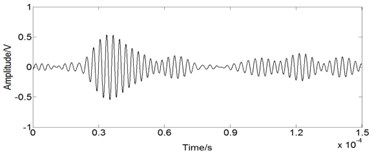
e) First 10 components
f) First 11 components
g) First 13 components
h) First 15 components
i) First 17 components
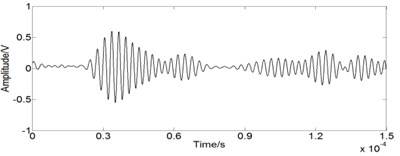
j) First 19 components
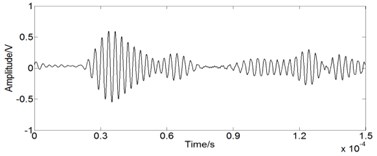
k) First 21 components
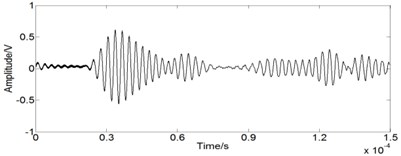
l) First 24 components
4. Conclusion
The presented work discussed SSA technique in experimental data processing and a new damage detection method based on SSA and Lamb wave was also proposed. Experimental response was decomposed with the SSA technique and a new approach for selection of the principal components was employed. In the experimental analysis, Lamb wave was applied for damage detection and the maximum likelihood theory based on Genetic Algorithm was generalized. Time of Flight method was used for damage location. It shows that the features obtained from the principal components corresponding to singular value numbers are useful for damage detection. The correspondence between the real damage and the calculated damage has also been shown. The experimental results demonstrate that the proposed damage detection method is simple, noise tolerant and efficient.
Fig. 13Comparison of the actual position and the ellipse orientation position
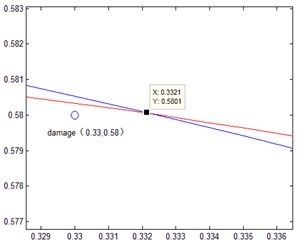
a) Ellipse orientation
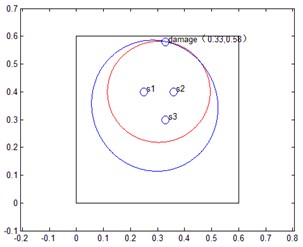
b) Ellipse intersection
References
-
Alleyne D. N., Cawley P. The excitation of Lamb waves in pipes using dry-coupled piezoelectric transducers. Journal of Nondestructive Evaluation, Vol. 15, Issue 1, 1996, p. 11-20.
-
Birt E. A. Damage detection in carbon-fibre composites using ultrasonic Lamb waves. Insight, Vol. 40, Issue 5, 1998, p. 335-339.
-
Badcock R. A., Birt E. A. The use of 0-3 piezocomposite embedded Lamb wave sensors for detection of damage in advanced fibre composites. Smart Materials and Structures, Vol. 9, Issue 3, 2000, p. 291-297.
-
Boller C. Ways and options for aircraft structural health management. Smart Materials and Structures, Vol. 10, Issue 3, 2001, p. 432-440.
-
Grondel S., Paget C., Delebarre C., et al. Design of optimal configuration for generating A0 Lamb mode in a composite plate using piezoceramic transducers. Journal of the Acoustical Society of America, Vol. 112, Issue 1, 2002, p. 84-90.
-
Tua P. S., Quek S. T., Wang Q. Detection of cracks in cylindrical pipes and plates using piezo-actuated Lamb waves. Smart Materials and Structures, Vol. 14, Issue 6, 2005, p. 1325-1342.
-
Su Z., Ye L. Lamb wave propagation-based damage identification for quasi-isotropic CF/EP composite laminates using artificial neural algorithm, part I: methodology and database development. Journal of Intelligent Material Systems and Structures, Vol. 16, Issue 2, 2005, p. 97-111.
-
Broomhead D. S., King G. P. Extracting qualitative dynamics from experimental data. Physica D, Vol. 20, Issues 2-3, 1986, p. 217-236.
-
Golyandina N., Malkus D. S., Zhiglitative A. A. Analysis of time series structure-SSA and related techniques. Chapman and Hall/CRC, Boca Raton, FL, US, 2001.
-
Vautard R., Ghil M. Singularspectrum analysis in nonlinear dynamics, with applications to paleoclimatic time series. Physica D, Vol. 35, Issue 3, 1989, p. 395-424.
-
Vautard R., Yiou P., Ghii M. Singular-spectrum analysis: a toolkit for short, noisy chaotic signals. Physica D, Vol. 58, Issues 1-4, 1992, p. 95-126.
-
Mineva A., Popivanov D. Method for single-trial readiness potential identification based on singular spectrum analysis. Journal of Neuroscience Methods, Vol. 68, Issue 1, 1996, p. 91-99.
-
Rozynsk G., Larson M., Pruszak Z. Forced and self-organized shoreline response for a beach in the southern Baltic Sea determined through singular spectrum analysis. Coastal Engineering, Vol. 43, Issue 1, 2001, p. 41-58.
-
Schoellhamer D. H. Singular spectrum analysis for time series with missing data. Geophysical Research Letters, Vol. 28, Issue 16, 2001, p. 3187-3190.
-
Hossein H., Anatoly Z. Singular spectrum analysis: methodology and application to economics data. Journal of Systems Science and Complexity, Vol. 22, Issue 3, 2009, p. 372-394.
-
Kepenne C. L. An ENSO signal in soybean futures prices. Journal of Climate, Vol. 8, Issue 6, 1992, p. 1685-1689.
-
Chao S. H., Loh C. H. Application of singular spectrum analysis to structural monitoring and damage diagnosis of bridges, structure and infrastructure engineering: maintenance, management. Life-Cycle Design and Performance, Vol. 10, Issue 6, 2014, p. 708-727.
-
Moisés Lima de Menezes, et al. Combining singular spectrum analysis and PAR(p) structures to model wind speed time series. Journal of Systems Science and Complexity, Vol. 27, Issue 1, 2014, p. 29-46.
-
Liu K., Law S. S., et al. Singular spectrum analysis for enhancing the sensitivity in structural damage detection. Journal of Sound and Vibration, Vol. 333, Issue 2, 2014, p. 392-417.
-
Wilcox P. D. A rapid signal processing technique to remove the effect of dispersion from guided wave signals. IEEE Transactions on Ultra, Ferroe and Frequency Control, Vol. 50, Issue 4, 2003, p. 419-427.
-
Hassanpour H., Darvishi A., Khalili A. A regression-based approach for measuring similarity in discrete signals. International Journal of Electronics, Vol. 98, Issue 9, 2011, p. 1141-1156.
-
Yu L., Cheng L., Su Z. Correlative sensor array and its applications to identification of damage in plate-like structures. Structural Control and Health Monitoring, Vol. 19, Issue 8, 2012, p. 650-671.
About this article
The authors would like to thank for the supports by the National Natural Science Foundation of China under the Grant 50875212 and Specialized Research Fund (priority development area) for the Doctoral Program of Higher Education of China under the Grant 20126102130004. This work is also supported by the Chinese Scholarship Council for the visiting scholar program at the University of Michigan.
