Abstract
Lamb wave-based structural health monitoring is one of the most widely used damage detection techniques. For quantitatively identifying the damage, damage features that Lamb waves carry may need to be carefully studied by numerical simulation. In this paper, spectral element method (SEM) is used to simulate Lamb wave interaction with open and closed crack. Cracked spectral element models are established for open and closed cracks, respectively. Results calculated by SEM are compared with the conventional finite element method to verify the proposed model. Some simulations are conducted to study different damage features between open and closed crack models. Wave reflection and transmission ratios with different crack depths are also quantitatively analyzed. Damage features obtained are used to conduct a simple experiment to identify the location and size of the crack.
1. Introduction
On-line structural health monitoring (SHM) techniques, based on Lamb waves, has been an affordable technology. Plenty of experimental works have been carried out to identify the damage [1-3]. Generally, for identifying quantitative damage characteristics, e.g. the crack size, depth, etc., theoretical and numerical studies on the damaged structures must be developed.
In theory, Shkerdin et al. [4] have analytically studied the mode conversion of Lamb wave from each other at the tip of delamination in a composite plate. Wang et al. [5] and Yuan et al. [6] have investigated reflection and transmission of wave mode in metal and composite beams containing delamination and inhomogeneity. In addition, power reflection and transmission at the damage location have been carried out and demonstrated to meet energy conservation law [5-7]. Lee et al. [8] used the local interaction simulation approach to analyze Lamb wave interaction with fatigue cracks in an aluminum plate, and the study shows that Lamb wave amplitude and arrival time are different for fully open and closed fatigue cracks. Peng et al. [9] investigated the interaction between waves and fully open delamination in a composite laminate by 2D pseudo-spectral element method, and some unique mechanisms are obtained.
Spectral element method (SEM), a finite element method in frequency domain introduced by Beskos et al. [10] and developed by Doyle [11], attracts wide attention for its high performance and little memory in simulating wave propagation. Ostachowicz [12] used SEM to model wave scattering at the location of embedded open delamination in composite beams.
The objective of this paper is to look for some damage features by using SEM to model Lamb wave propagation in an isotropic beam containing a horizontal fully open or closed crack. The paper is organized as follows. Spectral element formulas in a contact beam are given in Section 2. Damaged spectral element formulas, under fully and open crack condition separately, are derived in Section 3. In Section 4, comparison of SEM results and conventional FEM results is made, and some damaged features are obtained by simulations under open and closed crack condition, separately. Damaged features obtained are conducted a concise experiment to identify the location and size of the crack in Section 5. Finally, some conclusions are drawn in Section 6.
2. Spectral element formulation in a beam
Based on first shear deformation theory, the displacement of a beam can be written as:
where u(x,t), ϕ(x,t) and w(x,t) are the axial displacement, the rotation of the cross section and the transverse displacement of the beam, respectively. x-axis is the centroidal axis.
The force including axis force N, bending moment M, and shear force V can be expressed as:
where E and G are Young’s modulus and shear modulus, respectively; A and I is the area and the rotational inertia of the cross section; κ2 is shear correction factor [13].
Hamilton theory is employed to derive wave motion equations as:
where ρ is the mass density of the beam.
Substituting u=Ue-i(kx-ωt), w=We-i(kx-ωt) and ϕ=Φe-i(kx-ωt) into Eq. (3), there exists 6 roots of k (wavenumber), which denote six wave modes. The extensional wave wavenumbers can be obtained as:
The wavenumbers of flexural waves can be obtained as:
where cs=√G/ρ and cl=√E/ρ are shear and longitudinal wave velocities respectively. These wave velocities are independent of the beam thickness. q=h/√12.
There exists a cut-off frequency, ωc=κcs/q. When ω<ωc, k5 and k6 are purely imaginary, which represent non-propagating flexural waves but two evanescent (near-field) waves.
For a beam with length L, the spectral displacement can be written as:
w=˜u3e-ik3x+˜u4eik4(L-x)+β˜u5e-ik5x-β˜u6eik6(L-x),
ϕ=α˜u3e-ik3x-α˜u4eik4(L-x)+˜u5e-ik5x+˜u6eik6(L-x),
where there is a time dependence term e-iωt which has been suppressed here; ˜u1, ˜u3 and ˜u5 are spectral amplitudes of incident wave, and ˜u2, ˜u4 and ˜u6 are reflected amplitudes; α and β are given by:
Thus, Eq. (7) can be expressed as:
where ˜u={˜u1˜u2˜u3˜u4˜u5˜u6}T, and:
Λ0 is a diagonal (6×6) matrix with asymptotic entries in characteristic wavenumbers (kj, j= 1, 2, …, 6), which can be expressed as:
By evaluating Eq. (9) at the element nodes at x= 0, L, the element nodal displacement vector can be expressed as:
The non-singular (6×6) complex matrix T2 represents the local wave characteristics of displacement field. Eliminating the unknown wave coefficient vector ˜u from Eq. (9) using Eq. (12), the generic displacement field can be written in terms of the nodal displacements as:
where ℵ(x,ω)e is the exact spectral element shape function matrix. Next, the force boundary conditions can be evaluated for particular beam model at x= 0, L, which yield the element nodal force vector as:
where Ke is the (6×6) exact spectral element stiffness matrix. From Eq. (2), Q0 and Q1 are both (3×3) real matrix as follows:
Λ1 is a (6×6) diagonal matrix obtained as:
3. Cracked spectral element formulation
As in Fig. 1, a breathing fatigue crack in a beam usually have two typical conditions, open crack in Fig. 1 and closed crack in Fig. 2. In the SEM, the crack divides the beam into three regions, two uncracked regions and one open- or closed-crack region. Each region can be considered as a spectral beam element, whose stiffness matrix needs to be derived as Ke for uncracked beam element in Eq. (14). In the following sections, spectral element formulations for open and closed-crack beam elements will be drawn.

Fig. 1. A beam containing open crack
Fig. 2A beam containing closed crack

3.1. Formulations for open-crack beam element
Taking the crack as boundary, an open-crack beam element can be separated into upper and lower elements in Fig. 3. In Fig. 4.
Fig. 3Open-crack beam element
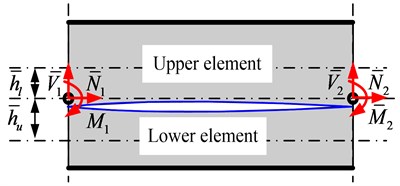
Fig. 4Force equilibrium at tip of the open-crack
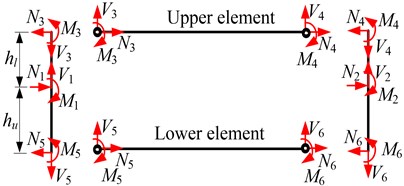
The upper and lower elements are both considered as individual elements, whose stiffness can be obtained by Eq. (14) as follows:
At the two tips of crack, displacement continuity and force equilibrium conditions can be written as:
{u6w6ϕ6}=[10hu010001]{u2w2ϕ2},{N1V1M1}=[100010hl01]{N3V3M3}+[100010-hu01]{N5V5M5},
{N2V2M2}=[100010hl01]{N4V4M4}+[100010-hu01]{N6V6M6}.
Eq. (16) can be labeled as:
Substituting Eq. (15) into Eq. (17), it yields:
3.2. Formulations for closed-crack beam element
As shown in Fig. 5, assuming the contacted pressure between the upper and lower elements as p(x,t).
Fig. 5Closed-crack beam element
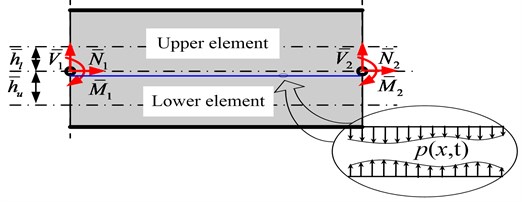
The transverse displacement is identical, i.e., ˉw=ˉwu=ˉwl, and the governing equations of flexural waves can be derived as:
Combining Eqs. (19) and (21) may eliminate the contact pressure p:
Assume the displacements as:
By substituting Eq. (24) into Eqs. (23), (20) and (22), the dispersion relation can be obtained as:
The roots of Eq. (25) denote three flexural wave modes, which are related to the un-cracked fundamental flexural mode, A(0)d0, and the A1 mode of the upper and lower beam elements, A(u)d1 and A(l)d1, respectively.
The general displacement of in the cracked region can be derived as:
where:
Eqs. (26)-(29) can be labeled as:
where:
ˉ˜u(10×1)={ˉ˜u1ˉ˜u2ˉ˜u3ˉ˜u4ˉ˜u5ˉ˜u6ˉ˜u7ˉ˜u8ˉ˜u9ˉ˜u10}T,
Similarly, as derivations from Eq. (9) to Eq. (14), the relations between the nodal forces and displacements of the upper and lower beam elements can be written as:
where:
And:
(L denotes the length of crack, and subscripts ‘0’ and ‘L’ represent the left and right end of the crack).
At the two tips of crack, displacement continuity and force equilibrium conditions can be written as:
{ˉfe1ˉfe2}=[ˉS'(3×6)0(3×6)0(3×6)ˉS'(3×6)]ˉfe=Sf(6×12)ˉfe,
where:
And {ˉfe1ˉfe2}T={ˉNe1ˉVe1ˉMe1ˉNe2ˉVe2ˉMe2}T represent the nodal displacements and forces of closed-crack beam element as in Fig. 5. ˉS(5×3) and ˉS'(3×6) can be written as follows:
Substituting Eq. (31) to Eq. (32), the relation between the nodal forces and displacements, for a closed-crack beam element in Fig. 5, can be obtained as:
4. Numerical results
Considering a cantilever beam containing a horizontal crack, wave propagation is studied by spectral element method (SEM). The material of beam is aluminum, and the dimensions are 500 mm (length) × 10 mm (width) × 2 mm (thickness) as in Fig. 6. The crack is at the middle-length of the beam. Lc and Hc represent the length and depth of the crack, respectively. A bending moment M is loaded at the left end of the beam, and the right end is fixed. The displacements of sensor points A and B are calculated to analyze wave reflection and transmission due to crack. In SEM, FFT sampling points is set as 65536 and frequency resolution is 24.414 Hz.
Fig. 6Schematics of the beam for numerical simulation

4.1. Modal analysis
Model analysis performed by SEM is compared with that by the finite element method (FEM) to validate the proposed model. Three conditions, i.e., intact beam, the beam containing open crack and closed crack, respectively, are considered. The length of the crack, Lc, is 100 mm and the depth of the crack Hc is 0.75 mm. In the SEM, it is conveniently calculated to look for the resonant region of the displacement when the force is set to always white noise. However, in the FEM, 4-node plane stain element (with dimension 0.5 mm×0.5 mm) is employed to model the beam, and open crack is modeled as duplicate nodes, while closed crack is modeled by setting the transverse displacements of duplicate nodes equaling to each other. Table 1 shows frequency comparison calculated by SEM and FEM in three conditions. Under open crack condition, there are two additional local bending mode as the transverse displacement of sub-beams above and below open crack is independent with each other. It can be seen that natural frequencies of each mode calculated by SEM and FEM reach a good consistency, which verifies the proposed model.
4.2. Wave propagation in an intact beam
When there is no crack in the beam, i.e. Lc= 0, the bending moment, a five-peaked and Hanning-windowed sinusoidal toneburst, is loaded at the left end of beam to generate A0 wave. Fig. 7 is the displacement of point A under excitation with central frequency 200 kHz. The first wave is incident A0 wave, and the second wave is reflected A0 wave from the right end of the beam. The second wave packet in Fig. 7 denotes that A0 wave is dispersive when it propagates along the beam. The time and distance of flight between two packets in Fig. 7 are 278.4 μs and 750 mm, respectively. Group velocity of A0 wave can be calculated as 2.694 km/s.
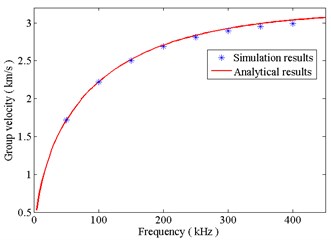
As the central frequency of the bending moment varies from 50 kHz to 400 kHz with a step of 50 kHz, similarly, group velocities can be calculated in comparison with analytical results as seen in Fig. 8. It can be observed that results calculated by SEM achieve a good agreement with analytical results, demonstrating the effectiveness of the proposed SEM model.
Table 1Comparison of natural frequencies by FEM and SEM in three conditions
FEM | SEM | |||||
Intact | Open crack | Closed crack | Intact | Open crack | Closed crack | |
1st bending (Hz) | 6.581 | 6.553 | 6.553 | 6.556 | 6.533 | 6.533 |
2nd bending (Hz) | 41.239 | 41.181 | 41.192 | 41.222 | 41.151 | 41.151 |
3rd bending (Hz) | 115.460 | 106.223 | 106.240 | 115.418 | 106.287 | 106.287 |
4th bending (Hz) | 226.222 | 221.573 | 223.171 | 226.163 | 221.562 | 223.135 |
5th bending (Hz) | 373.891 | 315.484 | 315.935 | 373.792 | 315.761 | 316.095 |
Local 1st bending of sub-beam above the crack (Hz) | 417.952 | 422.930 | ||||
6th bending (Hz) | 558.401 | 547.711 | 522.030 | 558.232 | 550.126 | 522.302 |
7th bending (Hz) | 779.705 | 660.741 | 665.982 | 779.412 | 660.990 | 655.782 |
8th bending (Hz) | 1037.745 | 915.468 | 904.859 | 1037.261 | 917.146 | 905.297 |
9th bending (Hz) | 1332.455 | 1081.893 | 1179.345 | 1331.707 | 1088.450 | 1178.762 |
Local 2nd bending of sub-beam above the crack (Hz) | 1286.341 | 1293.704 | ||||
Fig. 7The transverse displacement in an intact beam
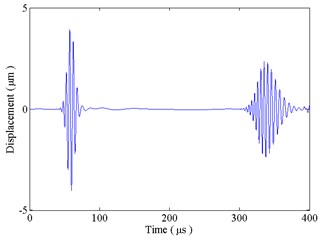
Fig. 8Group velocity of A0 wave
4.3. Wave propagation under open and closed crack condition
4.3.1. Wave interaction with the crack
Wave propagation in the cracked beam is studied under fully open or fully closed crack condition. The length of the crack Lc is 100 mm, and the depth of the crack Hc is 0.75 mm. A five-peaked and Hanning-windowed sinusoidal toneburst with central frequency 200 kHz is selected the time history of the bending moment.
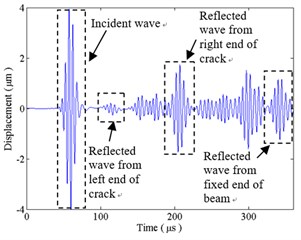
When the crack is fully open, Fig. 9(a) shows the transverse displacement of the sensor point A. The first wave packet is an incident A0 wave. According to Fig. 8, the group velocity of A0 wave at 200 kHz is 2.694 km/s. Thus, it is recognized that the second wave packet is A0 wave reflected from the left end of the crack, and relevant A0 waves reflected from the right end of the crack and the fixed end of the beam are noted in Fig. 9. Wave packets, between reflected waves from the left and right ends of the crack, can be illustrated as follows: the incident A0 wave transmits into the damaged region and converts to S0 wave at the left end of the crack; this transmitted S0 wave is reflected at the right end of the crack and then transmitted into the left side of the crack as A0 wave. Wave packets, between reflected waves from the right end of the crack and fixed end of the beam, are related that the waves that reflected from the crack are reflected from the left end of the beam and form multiple reflection and conversion between the crack and left end of the beam. Amplitudes of reflected waves from the left and right ends of the crack is 0.239 μm and 1.730 μm, which indicate that reflection from the right end of the crack is the dominant reflection compared with the left end of the crack.
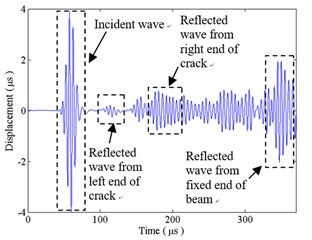
Fig. 9(b) gives the transverse displacement of sensor point A under closed crack condition. It is the same as the open crack that reflection from the left end of the crack is much less than that from the right end of the crack. Amplitudes of reflected waves from the left and right ends of the crack is 0.221 μm and 0.771 μm, which indicates that reflection at the crack under closed crack condition is smaller than that under open crack condition. Hence, reflection from the fixed end of the beam under closed crack condition, i.e. transmission from the crack, is larger than that under open crack condition.
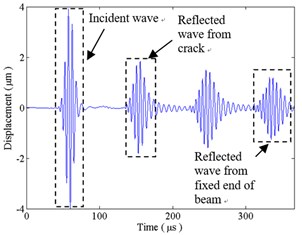
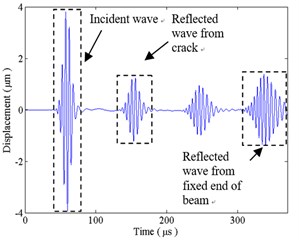
When the length of the crack becomes shorter as 5 mm, which is smaller than the wavelength of A0 wave with central frequency 200 kHz, Fig. 10 gives the displacements of sensor point A under open and closed crack conditions. It can be seen that waves reflected from the left end and the right end are emerged into one wave packet.
Fig. 9The transverse displacement at sensor point A: a) under open crack condition; b) under closed crack condition
a)
b)
Fig. 10The transverse displacement at sensor point A when the length of the crack is short: a) under open crack condition; b) under closed crack condition
a)
b)
4.3.2. The effect of the crack depth
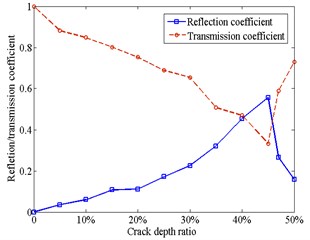
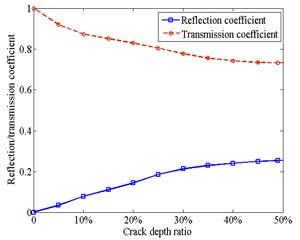
The reflection and transmission coefficients can convey information about the crack depth. As in Fig. 6, the excitation frequency 200 kHz is used in the analysis, the length of the crack is 100 mm, and the crack depth ratio (compared with the thickness of the beam) varies from 0 % to 50 % with a step of 5 %. The reflection and transmission coefficients, calculated from the displacement at sensor points A and B (Fig. 6), respectively, are defined as the ratio of the magnitude of reflected and transmitted waves from the right end of the crack to the magnitude of the incident wave at sensor point A. The reflection and transmission coefficients with crack depth ratio from 50 % to 100 % are symmetric as those from 0 to 50 %.
Seen in Fig. 11(a), when the crack is fully open, the reflection coefficient starts from zero, first increases with the crack depth ratio from 0 to 45 % and then decreases with that from 45 % to 50 %; whereas the transmission coefficient starts from 1 and changes with an opposite direction as the reflection coefficient. It can be seen in Fig. 11(b), when the crack is fully closed, that the reflection coefficient increases monotonically and the transmission coefficient decreases monotonically. This difference may be illustrated as, under the open crack condition, incident wave travels above and below crack at different group velocities and results in a time delay. Hence, when arrival waves at the right end of the crack are in phase, a maximum in magnitude for the reflection will occur. Otherwise, when they are out of phase, a minimum in magnitude will occur. However, under the closed crack condition, the displacements above and below the crack are all the same, and waves travels at the same velocity in Eqs. (26)-(29).
Fig. 11Reflection and transmission coefficients versus the crack depth: a) under open crack condition; b) under closed crack condition
a)
b)
5. Experiment to identify the crack
An experiment is designed to identify the length of the crack. As in Fig. 12, a through cutting crack, 160 mm length, is made at the middle of an aluminum beam (with dimensions 500 mm (length) × 20 mm (width) × 2 mm (thickness)). Two piezoelectric actuators and two piezoelectric sensors (each with dimensions 5 mm (radius) × 1 mm (thickness)), made of PbZrTiO3 (PZT), are mounted on the surface of the beam. From Section 4.3, wave reflection from the second end of the crack is much larger than that from the first end. Wave excited by PZT A is mainly reflected by the right end of the crack, thus, the signal received by PZT B may be used to calculate the location of the right end of the crack. Similarly, signals excited by PZT C and received by PZT D may locate the left end of the crack.
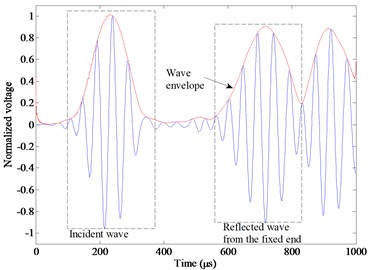
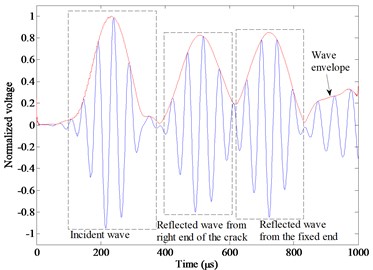
The excitation signal is also selected as a five-peaked and Hanning-windowed sinusoidal toneburst. The central frequency of the excitation is 20 kHz, for there is no S0 wave but only A0 wave in this frequency [14]. Fig. 13 shows signals received by PZT B at both uncracked and cracked conditions. By comparing two figures, it is obviously seen that there is a wave packet reflected from the crack. The first two wave packets in Fig. 13(a) represent incident A0 wave and reflection A0 wave from the right end of the beam, respectively. Flight time is extracted by wavelet decomposition. Group velocity of A0 wave can be calculated as 1540 m/s. By analyzing the first two wave packets in Fig. 13(b), the distance between PZT B and the right end of the crack can be known as 208 mm. Identified right end of the crack have an error 3 mm from the real end. Similarly, when the signal is excited by PZT C and received by PZT D, the left end of the crack is located with a left offset of 4 mm from the left end of the crack. Thus, the length of the crack is identified as 167 mm, whose error may be due to the size of PZT and change of group velocity.
Fig. 12Schematics of experiment

Fig. 13Signal received by PZT B at: a) uncracked condition; b) cracked condition
a)
b)
6. Conclusions
This paper has the following contributions:
1) Spectral element formulas in an open or closed-cracked beam are derived separately, which have been verified by the conventional FEM and are used to study wave propagation in the cracked beam and look for damage feature.
2) Wave reflection when wave propagated into the crack is much smaller than that propagating out of the crack, which can be used to identify the end of the crack and an example has been given in the paper.
3) Wave reflection and transmission at the crack have also been studied.
References
-
Shan S. B., Qiu J. H. Multi-damage localization on large complex structures through an extended delay-and-sum based method. Structural Health Monitoring, Vol. 15, 2016, p. 50-64.
-
Gao D. Y., Wu Z. J. Guide waves-based multi-damage identification using a local probability-based diagnostic imaging method. Smart Materials and Structures, Vol. 25, 2016, p. 045009.
-
Tao J., Feng Y., Tang K. Fatigue crack detection for a structural hotspot. Journal of Measurements in Engineering, Vol. 2, Issue 1, 2014, p. 49-56.
-
Shkerdin G., Glorieux C. Lamb mode conversion in a plate with a delamination. Journal of the Acoustical Society of America, Vol. 116, Issue 4, 2004, p. 2089-2100.
-
Wang C. H., Rose L. R. F. Wave reflection and transmission in beams containing delaminating and in homogeneity. Journal of Sound and Vibration, Vol. 264, 2003, p. 851-872.
-
Yuan W. C., Zhou L., Yuan F. G. Wave reflection and transmission in composite beams containing semi-infinite delamination. Journal of Sound and Vibration, Vol. 313, 2008, p. 676-695.
-
Zhou L., Yuan W. C. Power reflection and transmission in beam structures containing a semi-infinite crack. Acta Mechanica Solida Sinica, Vol. 21, Issue 2, 2008, p. 177-188.
-
Lee B. C., Staszewski W. J. Modeling of Lamb wave interaction with open and closed fatigue cracks for damage detection. IOP Conference Series: Materials Science and Engineering, Vol. 10, 2010, p. 012059.
-
Peng H. K., Ye L., Meng G., Mustapha S., Li F. C. Concise analysis of wave propagation using the spectral element method and identification of delamination in CF/EP composite beams. Smart Material and Structures, Vol. 19, Issue 8, 2010, p. 085018.
-
Beskos D., Narayanan G. Dynamic response of frameworks by numerical Laplace transform. Computer Methods in Applied Mechanics and Engineering, Vol. 7, 1983, p. 289-307.
-
Doyle J. F. Wave Propagation in Structures. Springer-Verlag, New York, 1997.
-
Ostachowicz W. Damage detection of structures using spectral finite element method. Computers and Structures, Vol. 86, 2008, p. 454-462.
-
Achenbach J. D. Wave Propagation in Elastic Solids. North-Holland Publishing Company, Amsterdam, 1984.
-
Bottai G., Giurgiutiu V. Simulation of the Lamb wave interaction between piezoelectric wafer active sensors and host structure. Proceedings of SPIE, Sensors and Smart Structures Technologies for Civil, Mechanical, and Aerospace Systems, Vol. 5765, 2005, p. 259-270.
About this article
This research was supported by the National Natural Science Foundation of China (Grants Nos. 11472308, 51475067) and the Fundamental Research Funds for the Central Universities (20720170058). The authors also acknowledge the support of Xiamen Key laboratory of Optoelectronic Transducer Technology and Fujian Key Laboratory of Universities and Colleges for Transducer Technology.

