Abstract
Concrete filled steel tubular (CFST) structure can effectively combine the properties of steel tube and concrete. The structural displacement, internal force and energy consumption of the pier under earthquake are calculated by time history analysis method. The seismic performance of CFST composite pier after the corresponding structural parameters are changed is predicted. Under the given seismic load, the pier concrete and steel tube have different degrees of plasticity. Concrete damage consumes the energy input into the structure by the earthquake to a certain extent, and the existence of steel tubes makes the overall stability of the structure better.
1. Introduction
Concrete-filled steel tube (CFST) is a structural form in which concrete is poured inside an empty steel tube, so that the two materials are jointly stressed. The steel tube provides a circumferential constraint to the concrete, the concrete provides an internal support for the steel tube to prevent local buckling and deformation [1-2]. Higher performance targets and damage tolerance requirements for composite columns as pier components are put forward [3-4]. In order to further study the CFST composite column under earthquake, the three-dimensional solid finite element model of CFST composite frame pier is established by using the general finite element software ABAQUS. The structural displacement, internal force and energy consumption of the pier under earthquake are calculated by time history analysis method. The seismic performance of CFST composite pier after the corresponding structural parameters are changed is predicted [5].
2. Finite element calculation model
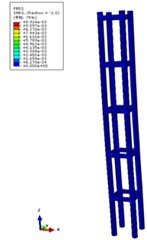
In this paper, the frame CFST pier is used. The basic parameters as follows: the pier height is 40 m and the superstructure is simplified to a mass of 800 tons and set on the top of the pier. The cross beam adopts hollow steel tube, and the base of the pier adopts consolidation form. The materials are Q345 steel and C40 concrete, with concrete compressive strength 40 MPa and steel yield strength 345 MPa, respectively. The pier is shown in Fig. 1.
The steel tube is simulated by S4R four node curved thin shell element, and the Simpson integration rule of 5 integration points is adopted in the thickness direction. The concrete is simulated by C3D8R eight node linear hexahedron element. Fig. 2 is the grid division diagram of CFST pier in the model. The nonlinear analysis method is used to analyze the displacement at the top of the pier, the internal force response characteristics at the bottom of the pier, and the energy dissipation capacity of the structure under different parameters. The model is shown in Table 1.
Fig. 1Schematic diagram of CFST pier
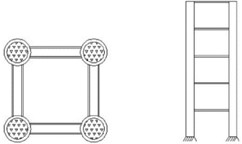
Fig. 2Mode grid
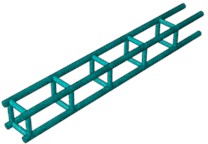
Table 1Model design
Parameter control | Diameter of the crossbeam (m) | Column spacing | Column size (m) | Pier height (m) |
M0 | 0.8 | 4 | 1.0×0.020 | 40 |
Diameter of the crossbeam | 0.6 | 4 | 1.0×0.020 | 40 |
0.7 | ||||
0.9 | ||||
Column spacing | 0.8 | 5 | 1.0×0.020 | 40 |
6 | ||||
7 | ||||
Column size | 0.8 | 4 | 1.2×0.024 | 40 |
1.4×0.028 | ||||
1.6×0.032 | ||||
Pier height | 0.8 | 4 | 1.0×0.020 | 48 |
56 | ||||
64 |
3. Seismic response analysis
Dynamic time history analysis is the process of calculating the dynamic equilibrium equation of a structure under the action of dynamic loads. The dynamic characteristics of the structure and the applied dynamic loads are used to determine the response (displacement, internal forces) of the structure at any given time. The dynamic balance equation used in the time history analysis method can be written as follows:
where – mass matrix, – damping matrix, – stiffness matrix, – dynamic load, , , – each represents relative displacement, velocity, and acceleration, respectively.
The mass matrix, damping matrix, and overall stiffness matrix of the structure in Eq. (1) are assembled by assigning elements and material types to each component. In dynamic elastoplastic analysis, materials need to consider a large number of nonlinear issues, including the hysteresis of steel and concrete under cyclic loading, as well as the stiffness degradation of concrete from cracking to complete crushing and withdrawal from work, and the strength recovery during concrete tension compression cycles. How to solve these nonlinear problems is the key to elastic-plastic time history analysis.
The time history analysis method has obvious influence on the seismic wave input. Government departments and research institutions such as ATC, PEER, FEMA, and USGS in the United States have conducted a large number of studies on the fault characteristics and site conditions of earthquakes. The records of previous earthquakes were classified and sorted out to establish a database of fortification standards in different regions [6-7].
In order to consider the randomness of ground motion, the design acceleration time history shall not be less than three groups, and the absolute value of the correlation coefficient defined by the time history in the same direction between any two groups shall be less than 0.1:
This paper selects three seismic waves, i.e. EL Centro wave, Hollywood Storage wave and Lanzhou wave (hereinafter referred to as EL wave, HW wave and LZ wave, respectively) [8-9]. The peak acceleration of time history analysis is adjusted to . Since the peak intervals of the three seismic waves are all included in 20 s, the ground motion acceleration begins to decay after 20 s, and the structural response also begins to decay synchronously. Considering the large number of analysis models, in order to save the calculation time, the seismic wave is only calculated for 20 s, and the earthquake is simulated by uniform loading. The seismic load acceleration curves of the four bases are the same, and there is no phase difference.
3.1. Displacement time history
Table 2 is the maximum value of the time history analysis results of the pier top displacement of the model under different seismic wave excitations.
As shown in Table 2, under the EL wave, the maximum nonlinear displacement response of the structure is 0.2535 m, and the maximum linear displacement is 0.2508 m. The linear response result is 98.97 % of non-linear. The occurring time is between 5 s-6 s, and the EL peak interval is also in this interval. Under the HW wave, the maximum displacement of nonlinear and linear response of the structure is 0.2258 m and 0.2044 m, respectively. The ratio of them is 90.52 %, and the maximum value occurs at about 19s. Under the LZ wave, the nonlinear and linear displacement responses of the structure are 0.1677 m and 0.1669 m, respectively, with a proportion of 99.52 %, and the maximum value occurs at about 6S. In the case of nonlinearity and linearity, the displacements of the three waves are similar, and the displacement time-history curves are also relatively similar.
Table 2Maximum displacement response of the pier top
Seismic wave | Nonlinear time history | Linear time history | ||
Maximum (m) | Occurrence time (s) | Maximum (m) | Occurrence time (s) | |
EL wave | 0.2535 | 5.66 | 0.2508 | 5.58 |
HW wave | 0.2258 | 19.85 | 0.2044 | 19.74 |
LZ wave | 0.1677 | 6.96 | 0.1669 | 6.88 |
3.2. Acceleration time history
Table 3 is the maximum time-history response of the pier top acceleration of the model under different seismic waves, where the maximum acceleration unit is m/s2.
As shown in Table 3, it can be seen from the time-history curve that under the three seismic waves, the change trend of the acceleration time-history curve of the pier top is highly similar. However, from the perspective of maximum response, the acceleration of linear method is amplified to some extent, and the simulation of real structure is not accurate enough. In the nonlinear and linear cases, the acceleration response trend of the structure is the same, and the linear method has certain amplification on the acceleration response.
Table 3Maximum acceleration response of the pier top
Seismic waves | Nonlinear time history | Linear time history | ||
Maximum (m/s2) | Occurrence time (s) | Maximum (m/s2) | Occurrence time (s) | |
EL wave | 3.661 | 4.48 | 4.164 | 4.48 |
HW wave | 3.606 | 3.32 | 4.139 | 3.32 |
LZ wave | 3.639 | 7.96 | 3.661 | 7.96 |
3.3. Internal force time history
There are four sections at the bottom of the pier. Since there is no phase difference in each section during loading, there is little difference in the internal force time history between each pier column. The following is the internal force response analysis of only one leg column. Table 4 is the maximum value of internal force response. Fig. 3 is the shear time history in the direction at the pier base, in which column a is the linear time history and column b is the nonlinear time history.
As shown in Table 4, under the three seismic waves, the axial force of a single leg column of the pier is relatively large and the corresponding bending moment is relatively small. This is because the pier is a frame structure. When there is displacement at the top, due to its own characteristics, the bending moment will be transformed into axial force and act on the four columns respectively. The axial force time history curve is ignored. The nonlinear and linear responses of the three waves are consistent. Therefore, the general trend is the same as the nonlinear time history analysis based on step-by-step integration.
It can be seen from Fig. 3 that, similar to the shear time history curve, the nonlinear and linear responses of the pier structure under three waves have the same trend, and the details are quite different. After the nonlinear time history occurs at the maximum response point, the overall peak point of the structure decreases slowly. The overall response of the structure decays fast after the maximum value of the linear structure.
Through the comparison of the above nonlinear and linear time history responses, it can be seen that under the three seismic waves, the internal force responses of linear and nonlinear time history are significantly different. This indicates that the pier has entered a nonlinear state, and the linear analysis cannot accurately reflect the actual stress state of the structure.
Table 4Maximum internal force response of the pier under earthquake
Seismic waves | Axial force of the pier base (kN) | Shear of the pier base (kN) | Bending moment of the pier base (kN·m) | |
EL wave | Linear | 8023.88 | 455.46 | 3452.62 |
Nonlinear | 6440.67 | 494.54 | 3755.40 | |
HW wave | Linear | 6464.81 | 431.20 | 3225.18 |
Nonlinear | 6382.86 | 555.48 | 3759.21 | |
LZ wave | Linear | 5435.78 | 353.16 | 2618.93 |
Nonlinear | 4830.19 | 412.70 | 3126.79 | |
Fig. 3Time history curve of the bending moment at the base of the pier under the three waves
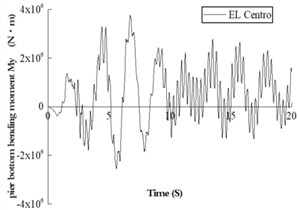
a) Nonlinear time history
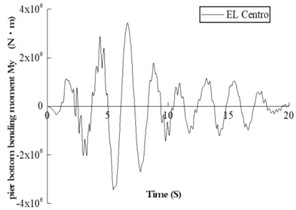
b) Linear time history
3.4. Plastic damage
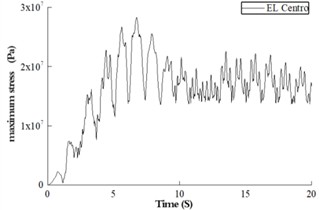
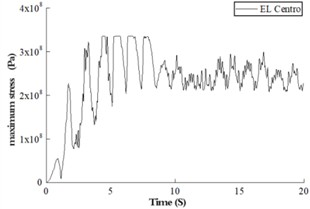
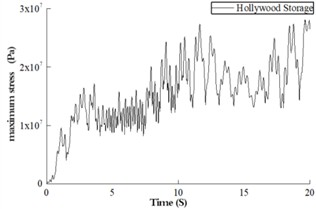
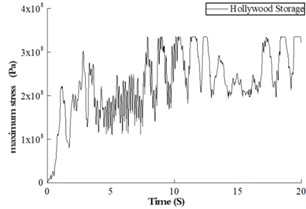
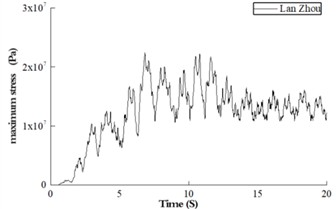
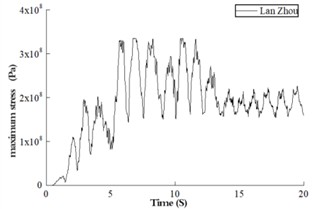
From the above pier linear and nonlinear time history results, it can be seen that under the seismic load level set in this paper, the CFST pier has entered the plastic state. Fig. 5 is the variation curve of the overall maximum stress of steel tube and concrete materials of pier structure with time during the application of seismic load.
Fig. 4Stress versus time curve
a) Maximum stress of concrete
b) Maximum stress of steel tube
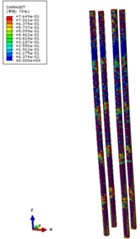
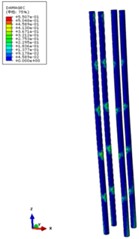
It can be seen from Fig. 4 that under the three seismic wave loads, the concrete stress has exceeded the elastic limit, and the steel tube stress has reached the proportional limit stress of Q345 steel. This indicates that both materials have entered a plastic state. For concrete materials, when the structural deformation exceeds its elastic range, the seismic vibration continues to load. The structure yields more times during the vibration process, and the plastic failure accumulates more. Fig. 5 shows the failure of concrete and the equivalent plastic development of steel tubes. Fig. 5(a) is the tensile damage of concrete; Fig. 5(b) is the compression damage of concrete, and Fig. 5(c) is the equivalent plastic strain of steel tube. From the plastic accumulation of concrete, it can be seen that under the three seismic waves, large tensile damage occurred in most areas of the concrete, while compression damage appeared in the area connected to the beam.
4. Conclusions
The maximum displacement of the pier top is relatively small, and the overall safety of the structure under the design earthquake is relatively safe.
1) There is little difference between the displacement results of linear time history and nonlinear time history. There are some differences in acceleration response results, and the internal force results are quite different. The design seismic grade is 8 degrees (0.2 g), the pier has entered a nonlinear state.
2) The natural frequency of the structure changes obviously, and the linear method based on mode superposition is no longer suitable. In order to calculate the seismic response of the structure more realistically, the nonlinear influence should be considered.
3) Both concrete and steel pipes have plastic deformation. The destruction of concrete consumes the energy input into the structure by the earthquake, while the steel pipe improves the overall stability and has a strong overall energy dissipation capacity.
Fig. 5Structural plastic properties
References
-
J. P. Chen, C. Zhang, and X. Q. Xu, “Research on bearing performance of concrete-filled steel tubular column under horizontal impact load,” (in Chinese), Shanxi Architecture, Vol. 38, pp. 30–31, 2012.
-
S. T. Zhong, W. F. Zhang, Y. Q. Tu, X. F. Wu, and J. H. Liang, “The research of seismic behaviors for concrete-filled steel tubular (CFST) structures,” Progress in Steel Building Structures, Vol. 2, pp. 3–15, 2002.
-
T. Usami, H. B. Ge, and K. Saizuka, “Behaviour of partially concrete-filled steel bridge piers under cyclic and dynamic loading,” Journal of Constructional Steel Research, Vol. 41, No. 2-3, pp. 121–136, Feb. 1997, https://doi.org/10.1016/s0143-974x(97)00007-2
-
J. F. Hajjar and B. C. Gourley, “A cyclic nonlinear model for concrete-filled tubes. I: formulation,” Journal of Structural Engineering, Vol. 123, No. 6, pp. 736–744, 1997, https://doi.org/10.1061/(asce)0733-9445(1997)
-
S. Yamazaki and S. Minami, “Experimental study on inelastic behavior of steel beam-columns subject to varying axial force and cyclic lateral load,” Journal of Structural and Construction Engineering, Vol. 64, No. 519, pp. 95–102, 1999.
-
C. H. Kang and T. S. Moon, “Behavior of concrete-filled steel tubular beam-column under combined axial and lateral forces,” in Proceedings of the Fifth Pacific Structural Steel Conference, pp. 961–966, 1998.
-
J. P. Liu, “Study on hysteretic behavior of high strength concrete filled square steel tubular compression bending members,” (in Chinese), Harbin Institute of Technology, 2003.
-
P. Sheng and X. Zhou, “Experimental study on the seismic behavior of CFRP-strengthened seismic-damaged recycled aggregate concrete-filled rectangular steel tube frame columns,” Journal of Building Engineering, Vol. 45, p. 10342, 2022.
-
Q. Liu et al., “Comparative analysis of BP neural network and RBF neural network in seismic performance evaluation of pier columns,” Mechanical Systems and Signal Processing, Vol. 141, p. 10670, 2020.
About this article
The authors have not disclosed any funding.
The datasets generated during and/or analyzed during the current study are available from the corresponding author on reasonable request.
The authors declare that they have no conflict of interest.
