Abstract
Geotube dams are constructed by stacking geotubes, which are non-homogeneous structures composed of geotextiles and filled sand. Therefore, studying the permeability characteristics of the geotextile-soil system is of great significance for seepage analysis in geotube dams. While the permeability characteristics of geotextiles and filled sand have been extensively studied individually, there has been relatively little research on the permeability characteristics of the geotextile-soil system formed by the combination of geotextiles and soil. In this study, a self-designed permeameter was used to investigate the permeability characteristics of the geotextile-soil system under different sand filling heights. The test results indicate that the permeability coefficient of the geotextile-soil system decreases continuously with the increase in permeation time and eventually stabilizes. The permeability coefficient of the geotextile-soil system increases with the sand-filling height and finally approaches but remains slightly smaller than that of pure sand with the same gradation. The influence of geotextiles on the permeability of the geotextile-soil system is significant within the range of 0 to 5 cm. Additionally, the water permeability of geotextiles affects the permeability performance of the geotextile-soil system. Specifically, a larger porosity corresponds to higher water permeability, and a greater permeability coefficient of the geotextile leads to a higher permeability coefficient of the geotextile-soil system.
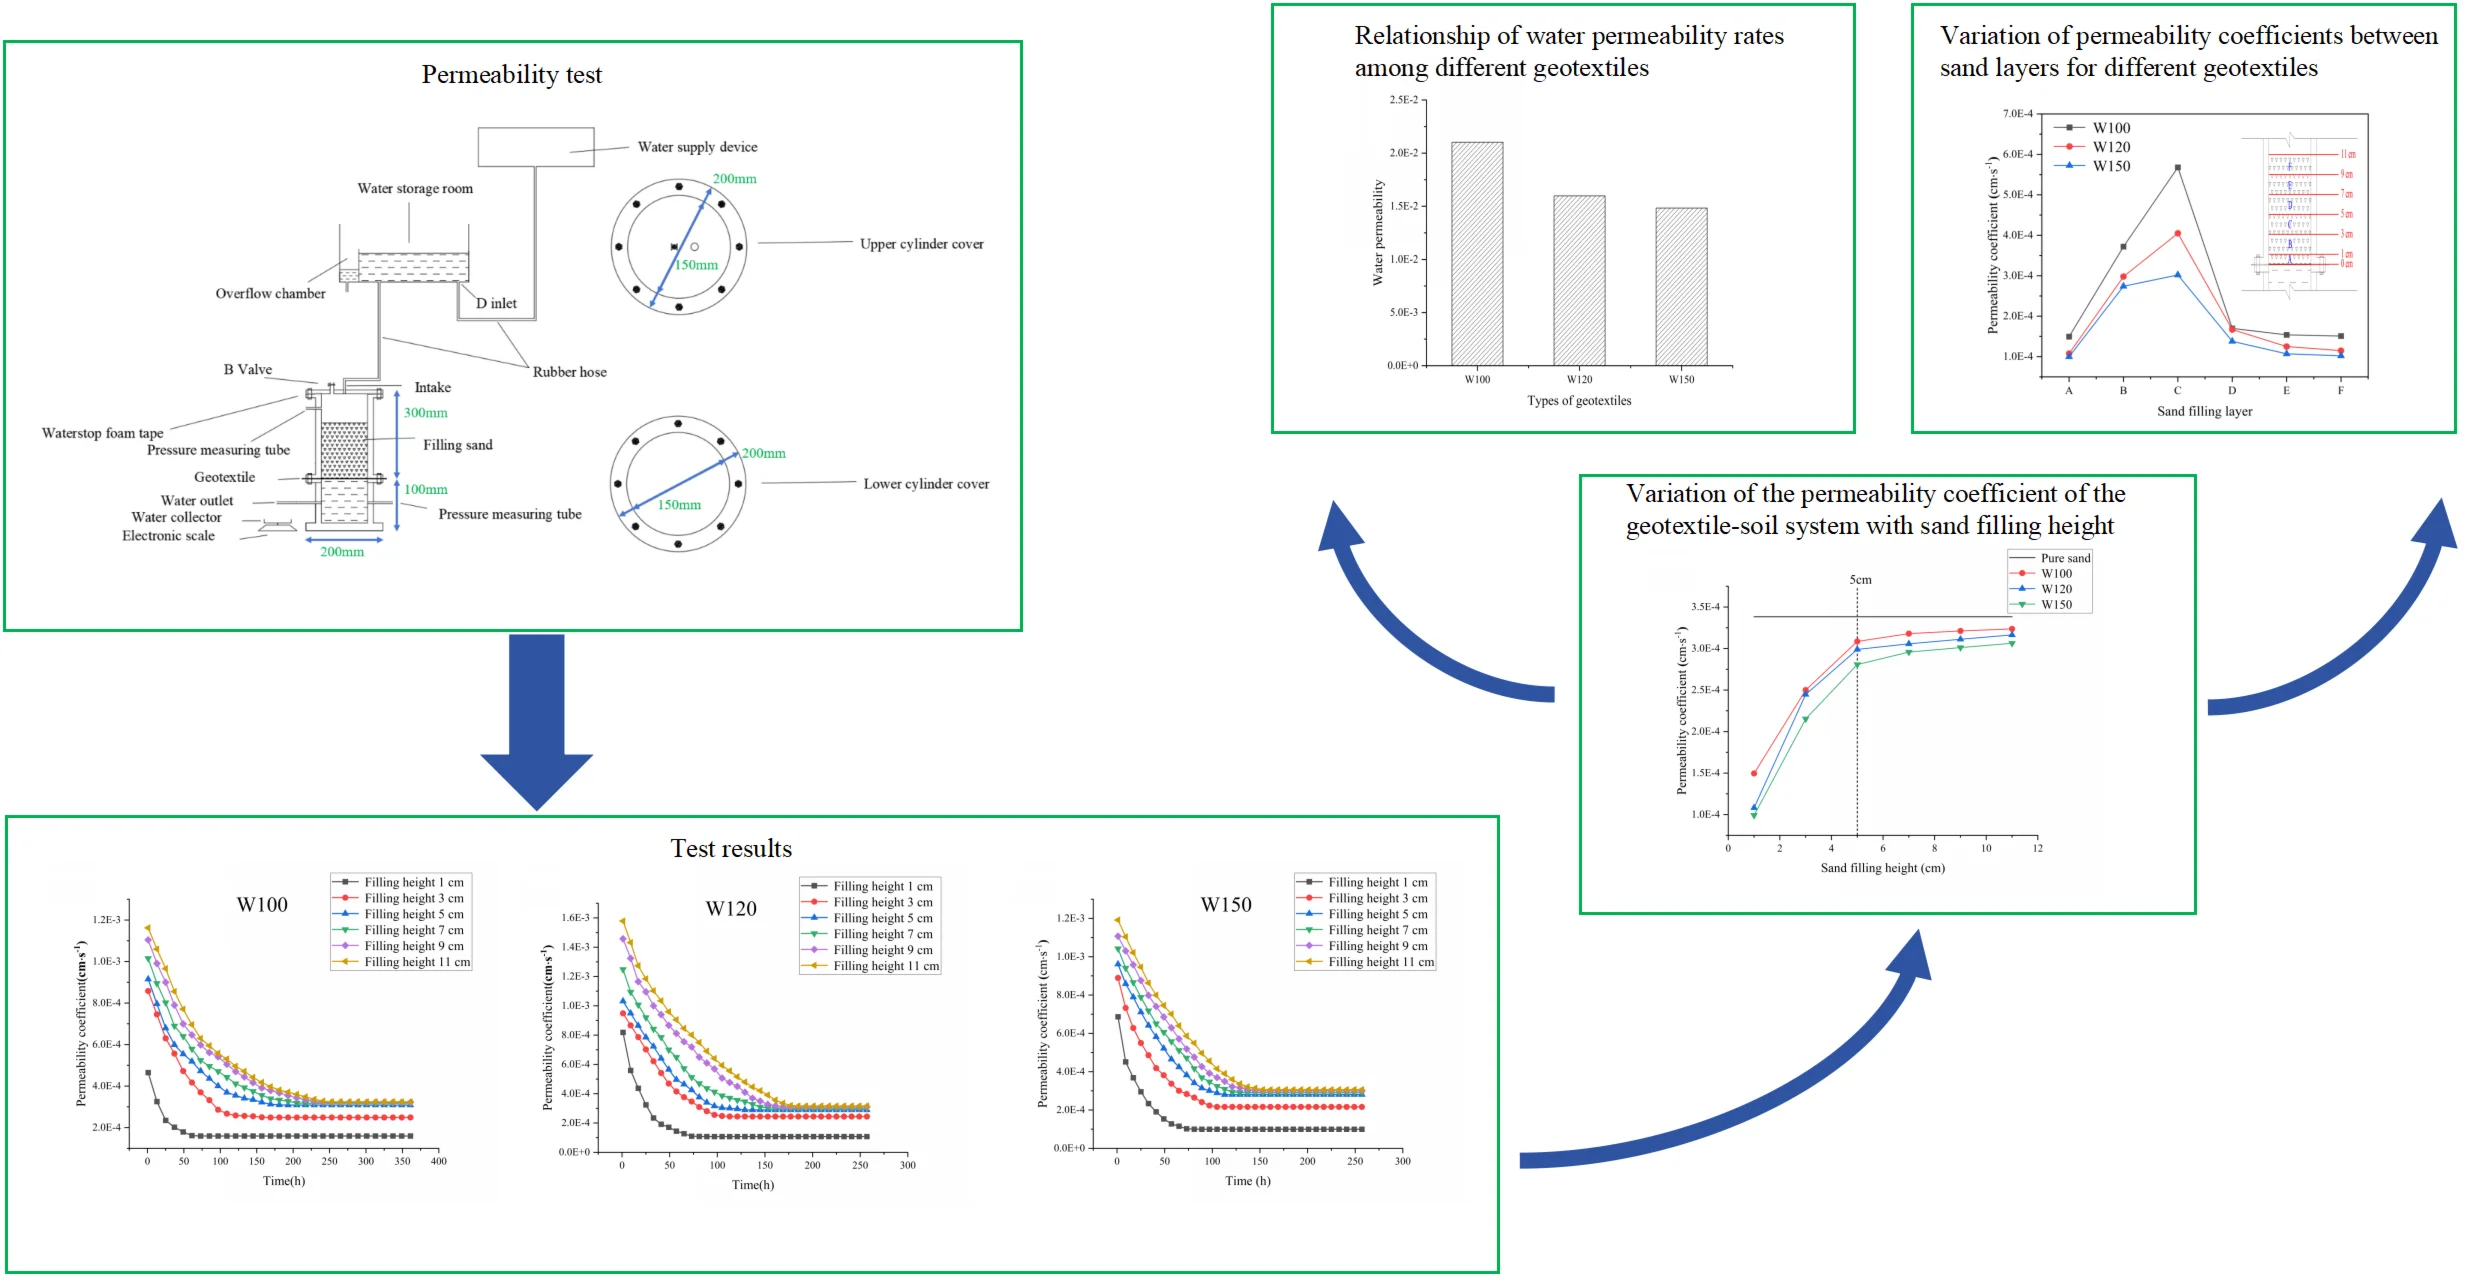
Highlights
- Tests were conducted using a self-made permeameter to systematically investigate the permeability characteristics of the geotextile-soil system under different sand filling heights.
- The influence of sand filling height on the permeability coefficient was revealed, and the variation trend of permeability performance under different heights was clarified.
- The influence range and extent of geotextiles on the system’s permeability were quantified, and their mechanism of action under different sand filling heights was elucidated.
1. Introduction
The geotube-filling technique originated in the 1950s and was first applied in coastal protection engineering abroad [1-3]. Compared to traditional earth-rock dam construction methods, the modern techniques are characterized by significant advantages, including being more environmentally friendly with low carbon emissions, having simplified processes, demonstrating high technological maturity, achieving notable cost-effectiveness, and enabling precise management of construction schedules [4]. Since its introduction to China in 1985, the geotube-filling technique has been widely promoted and applied in various infrastructure projects due to its advantages. These applications include the construction of freshwater reservoirs in estuaries, the regulation of deep-water channels, the installation of offshore transportation facilities, and the remediation of inland water environments [5-6]. Geotube dams are constructed from stacked geotubes, which are non-homogeneous structures composed of geotextiles and filled sand. Since the permeability characteristics of the geotextile-soil system are critical for analyzing the seepage properties of geotube dams, related research holds significant scientific importance. At present, the permeability characteristics of geotextiles and filled sand have been relatively well-studied individually, but further in-depth research is still needed on the permeability performance of the geotextile-soil system formed by their combined interaction.
Extensive experimental research on the permeability characteristics of filled sand has been conducted by scholars both domestically and internationally. Following H. Darcy’s foundational work on permeability theory, many outstanding researchers have contributed models and formulas for calculating the permeability coefficient k. For example, Hazen and his team [7], through extensive data analysis, concluded that the soil permeability coefficient k of soil is significantly positively correlated with d210. However, Kozeny and others [8] held a different perspective, believing that the permeability coefficient k is mainly limited by the porosity and the particle size characteristic d9. Yang Bing’s team [9] employed the constant head permeability test method to meticulously examine the combined effects of the soil's non-uniformity coefficient, curvature coefficient, and mean particle size on the permeability coefficient. Their findings revealed that the permeability coefficient increases with the curvature coefficient, decreases inversely with the non-uniformity coefficient, and exhibits an approximately linear positive correlation with the mean particle size. This discovery provides an important basis for predicting and optimizing the permeability performance of sandy soils. Su Lijun and other scholars [10] focused on sandy soils, systematically analyzing the influence of porosity on the permeability coefficient of sand with the same particle size grade. They also revealed how variations in particle size grade under different porosity conditions affect the permeability coefficient and ultimately summarized an empirical formula for the permeability coefficient, enriching research on sandy soil permeability. Zhu Chonghui and others [11] conducted an in-depth investigation into the permeability characteristics of coarse-grained soils, explicitly pointing out the close correlation between the permeability coefficient and both the non-uniformity coefficient and curvature coefficient. By modifying the Terzaghi formula, they established a bridge between the permeability coefficient of coarse-grained soil and their gradation characteristics, providing a new tool for understanding the permeability mechanism of coarse-grained soils.
Researchers on the permeability characteristics of geotextiles has been conducted through experimental studies and theoretical analyses under both non-strained and strained conditions. Wu Gang et al. [12] conducted permeability tests using a multifunctional permeameter in a soil-covering environment with woven geotextiles. The study revealed that it have an inhibitory effect on soil seepage. Pang Xiaochao et al. [13] analyzed the clogging behavior of geotextiles using a gradient ratio permeameter they independently modified. Bai Jianying et al. [14] investigated the vertical permeability coefficient of geotextiles clarified the permeability mechanisms and microstructures of various geotextiles. Iryo et al. [15] analyzed published data on the hydraulic properties of unsaturated geotextiles, highlighting their unique hydraulic characteristics. Qiu Changlin and his team [16] studied the stress characteristics of large-scale geotube-filling systems by establishing mechanical property formulas. They discovered that, under the same filling pressure, the circumferential tensile strain in large-scale geotubes is significantly greater than that in small-scale geotubes. Ren Zhizhong et al. [17] conducted experimental research on the water permeability of geotextiles with different specifications under varying pressures, showing that water permeability changes with applied pressure. Wu et al. [18] explored the effects of unidirectional tensile strain on the pore size distribution and filtration characteristics of geotextiles. Using a self-designed device, they conducted flow rate and gradient ratio tests and compared results under strained and non-strained conditions, finding that increased strain leads to a higher gradient ratio. Tang Lin et al. [19] tested the changes in filtration parameters of four types of geotextiles under different tensile strain conditions using a gradient ratio permeameter. Their findings showed contrasting results for woven and nonwoven geotextiles: for nonwoven geotextiles, increased tensile strain enhanced soil retention while reducing permeability and anti-clogging performance. Using a soil tensile testing devices, Wu Di and other researchers [20] tested the tensile properties of five different geotextiles. The results confirmed that greater elongation of geotextiles enhances their lateral effects in soil-like materials. GHAFFARI et al. [21] studied the bearing capacity of slopes with shell-based foundations by comparing 3D numerical simulations with experimental results, illustrating the relationship between slope distance and bearing capacity. Chen Lun et al. [22] analyzed clogging in geotextile systems using a geotextile tensile device and a gradient ratio permeameter. The results indicated that clogging becomes more severe with increasing tensile strain in the geotextile.
The aforementioned studies primarily focused on the permeability characteristics of either filled sand or geotextiles individually. In recent years, research on the permeability characteristics of geotextile-soil systems has been increasing. Some studies have adopted continuous drainage boundary conditions to establish models and theoretically analyze the permeability characteristics of geotextile-soil systems. For instance, a one-dimensional consolidation model based on continuous drainage boundary conditions was used to study the estimation of interface parameters and their effects on consolidation behavior during soil consolidation [23]. Furthermore, by introducing threshold hydraulic gradients and multi-stage loading conditions, the one-dimensional rheological consolidation problem of cohesive soils has been systematically investigated. Analytical solutions were proposed, revealing the consolidation behavior under multi-stage loading conditions [24]. Wang Hanyue et al. [25] conducted experiments using a self-designed gradient ratio permeameter to explore the impact of tensile strain on the permeability characteristics of the geotextile-soil systems. The results indicated that when geotextiles were subjected to transverse tensile strain, their porosity increased, leading to greater sand loss and seepage velocity, whereas longitudinal tensile strain had the opposite effect. Man Xiaolei et al. [26] conducted experiments to study filled sand materials with different particle ratios under sand-covered conditions and explained the effects of particle ratios on the permeability coefficient of geotextile-soil cover systems. The results indicated that the content of fine, medium, and powdery particles was negatively correlated with the permeability coefficient, while the content of coarse particles was positively correlated. However, in practical engineering applications, geotextile-soil cover systems are subject to the scouring action of water flow. Therefore, it is important to study the permeability characteristics of geotextile-soil cover systems under different water flow conditions. Rong Mengyu et al. [27] investigated this issue revealing that unidirectional water flow and reciprocating water flow affect the permeability characteristics of geotextile-soil systems differently, with the latter having a significantly greater effect. Wu Gang et al. [28] performed permeability tests using a multifunctional permeameter in a sand-covered environment with woven geotextiles and found that woven geotextiles inhibit soil seepage. Miszkowska et al. [29] conducted experiments using geotextiles and silt, demonstrating that the permeability characteristics of geotextiles were significantly reduced under the combined effects of sand covering and cyclic water flow. However, the specific range and extent of the effects of sand covering on the permeability characteristics of geotextiles have not been discussed in the aforementioned studies. To address this gap, this paper conducts permeability experiments on geotextile-soil systems under varying sand-filling heights to investigate the influence of sand-filling height on the permeability characteristics of geotextile-soil systems. Additionally, the specific range and extent of the effects of sand covering on the permeability characteristics of geotextiles are revealed.
2. Test method
2.1. Test device
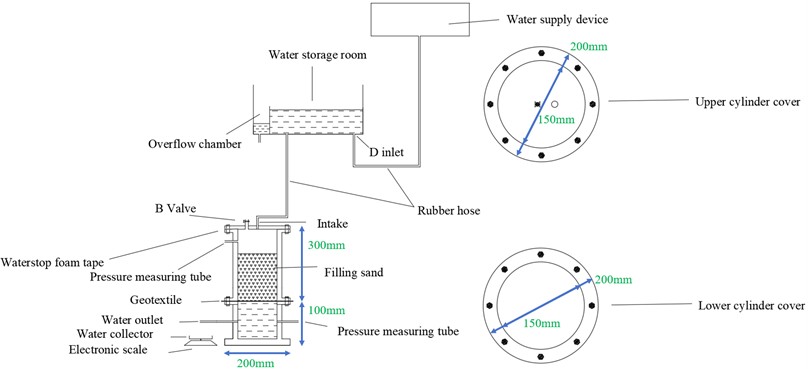
In this test, a self-made permeameter was used to investigate the changes in the permeability characteristics of geotextile-soil systems under different sand-filling heights by varying the sand-filling height. The actual device and schematic diagram of the test setup are shown in Fig. 1 and Fig. 2, respectively. The device is a constant-head permeameter capable of providing unidirectional water flow and consists primarily of a permeameter and a water head supply system. The permeameter is composed of two cylindrical tubes: the upper tube has a diameter of 200 mm and a height of 300 mm, while the lower tube has a diameter of 200 mm and a height of 100 mm. The upper tube and lower tube are connected using a flanges and screws. Foam adhesive tape is applied at the flange connection to ensure tight contact between the fabric and the cylinder, preventing air ingress and water leakage at the device's connection points. The water head supply system consists of a water storage chamber and an overflow chamber to ensure the proper operation of the constant-head test.
Fig. 1Physical drawing of test device
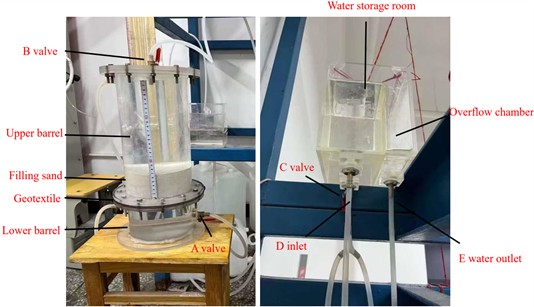
Fig. 2Diagram of test device
2.2. Test materials
2.2.1. Geotextile
The woven geotextiles used in the test were polypropylene slit-film woven fabrics, designated as W100, W120, and W150. Their specific parameters are detailed in Table 1.
Table 1Geotextile specification parameters
Project | Indicator | ||
Geotextile specifications / (g∙m-2) | W100 | W120 | W150 |
Mass per unit area / g | 100 | 120 | 150 |
Mass per unit area deviation / % | 5 | –2 | 4 |
Equivalent opening size / mm | 0.10 | 0.08 | 0.07 |
Thickness / mm | 0.90 | 1.25 | 1.30 |
Width deviation / % | 0.50 | 0.50 | 0.50 |
Tensile breaking strength in the transverse and longitudinal directions / (N∙mm-1) | ≥ 15 | ≥ 20 | ≥ 25 |
Transverse and longitudinal puncture resistance strength / (N∙mm-1) | ≥ 300 | ≥ 300 | ≥ 300 |
2.2.2. Soil sample
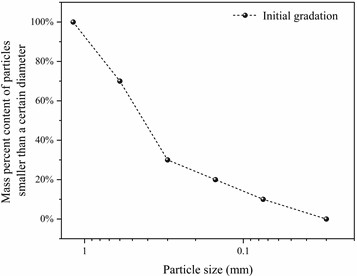
The soil sample used in this test was quartz sand. The mass distribution ratios of particles with various grain sizes are detailed in Table 2, and the corresponding particle size distribution curve is shown in Fig. 3.
Table 2Mass proportion of particles with different grain sizes
Particle size / mm | ≤ 0.03 | 0.03-0.075 | 0.075-0.15 | 0.15-0.3 | 0.3-0.6 | 0.6-1.18 |
Mass proportion | 0 % | 10 % | 10 % | 10 % | 40 % | 30 % |
Fig. 3Grain size distribution curve of the filling sand
2.3. Test process
The test apparatus and materials were prepared to conduct a constant head permeability test using a unidirectional head permeability apparatus, ensuring that the water head height remains constant. The specific steps of the test are as follows:
(1) The geotextile was cut into a diameter of 200 mm using a soldering iron (compared to traditional cutting machines, the soldering iron provides smooth cuts and minimizes damage to the geotextile).
(2) The cylinders were wiped with alcohol and then cleaned with a dry, clean cloth.
(3) Foam tape was applied to the top and bottom edges of the upper cylinder, and screws were used to connect the upper and lower cylinders while fixing the geotextile between them.
(4) The pre-weighed sand was poured into the upper cylinder and gently leveled with a brush. The inlet valve was then opened slightly to allow a small flow of water into the apparatus until the required water level was reached. The glass cover was placed on top, and the two side holes were connected to the pressure measurement tubes using soft pipes.
(5) The apparatus, which had been soaked for 24 hours, was manually deaerated to remove air bubbles. Valve B was connected to the water head supply device via a rubber tube, while inlet D was connected to the water supply system. A constant water flow was maintained, and water exiting the outlet was collected in a bucket. The flow rate over two minutes was recorded, and the readings from the pressure tubes were noted until the flow rate stabilized. The permeability coefficient corresponding to each time interval was calculated;
(6) Different geotextiles were replaced, or the sand fill height was adjusted, and the above test steps were repeated.
3. Test results and analysis
3.1. Test result
Derivation of the formula for the permeability coefficient k:
According to Darcy’s law:
where v represents the water flow velocity.
Where the hydraulic gradient is:
where H represents the hydraulic head difference, and L represents the seepage path.
From Eqs. (1) and (2), we get:
Under constant head conditions, tests were conducted on three types of geotextiles with different mass per unit area to investigate the effect of different sand filling heights (specific parameters are shown in Table 3) on the permeability coefficient k of each geotextile.
Table 3Mass of sand at different filling heights
Sand fill height / cm | 1 | 3 | 5 | 7 | 9 | 11 |
Mass / g | 320 | 960 | 1600 | 2240 | 2880 | 3520 |
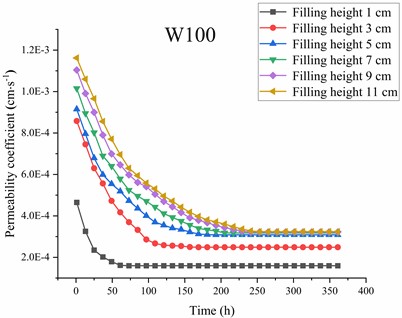
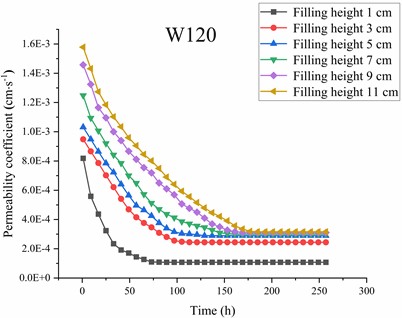
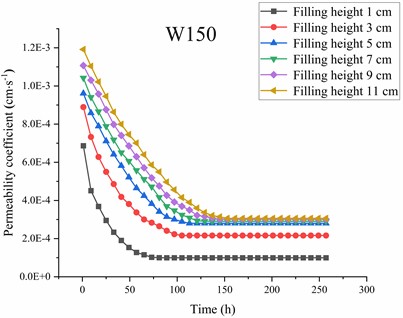
Fig. 4Variation of the permeability coefficient with time for each geotextile-soil system at different sand filling heights
a) W100
b) W120
c) W150
Fig. 4 shows the variation of the permeability coefficient over time for the W100, W120, and W150 geotextile-soil systems. As shown in Fig. 4(a), under different sand filling heights, the permeability coefficient of the W100 geotextile-soil system exhibits a consistent trend over time, initially decreasing and then stabilizing. This phenomenon can be attributed to the following: under the scouring action of unidirectional water flow, fine particles in the quartz sand migrate downward. However, some fine particles that would otherwise be lost are intercepted by the geotextile, gradually leading to clogging above the geotextile and the formation of a structurally stable filtration system, eventually resulting in a stable permeability coefficient. It can also be observed that once the permeability coefficient of the W100 geotextile-soil system stabilizes, its stable value increases with the height of the sand filling. Since the permeability coefficient of the geotextile-soil system is determined by both the geotextile and the quartz sand, and the geotextile specifications and the grain size distribution of the quartz sand remain constant, the only factor influencing the permeability coefficient of the W100 geotextile-soil system is the sand filling height. The trends shown in Figs. 4(b) and 4(c) are consistent with those in Fig. 4(a). Therefore, the following analysis focuses on the impact of sand filling height on the permeability characteristics of the geotextile-soil system.
3.2. The influence of sand filling height on the permeability characteristics of geotextile-soil systems
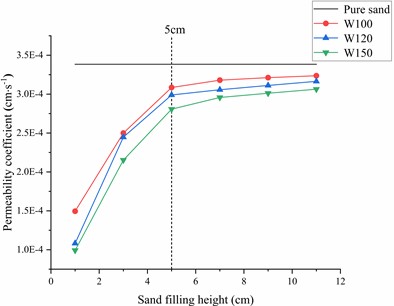
Fig. 5 presents the relationship between sand filling height and the permeability coefficient of the geotextile-soil system. It can be observed from the figure that as the sand filling height increases, the permeability coefficients of the three geotextile-soil systems also increase. However, the rate of increase gradually slows down, specifically showing a larger rate of increase when the sand filling height is less than 5 cm and a smaller rate of increase when it exceeds 5 cm. In comparison to the permeability characteristics of pure sand, the permeability coefficient curves of the geotextile-soil systems approach the straight-line permeability coefficient of the pure sand system from below as the sand filling height increases. This phenomenon can be preliminarily explained as follows: under the action of unidirectional water flow, the geotextile obstructs the movement of sand particles, thereby influencing the permeability performance of the filled sand. The interaction between the geotextile and the sand forms a filtration structure, ultimately resulting in the permeability coefficient of the geotextile-soil system being lower than that of pure sand. However, since the geotextile has a limited ability to affect the permeability performance of pure sand, its influence is more pronounced on the sand within 5 cm above the geotextile, while the effect on sand beyond 5 cm is relatively smaller.
Fig. 5Variation of the permeability coefficient of the geotextile-soil system with sand filling height
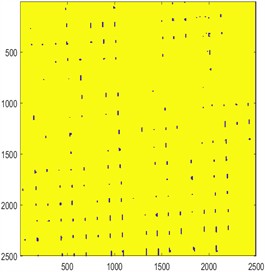
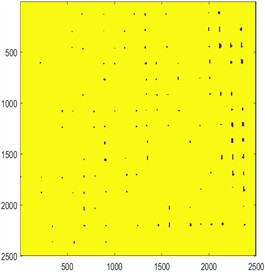
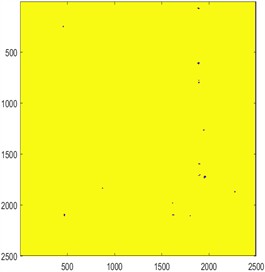
To explore the reasons behind the reduction in the permeability of the geotextile-soil system caused by an increase in the unit mass of geotextiles, a hypothesis was proposed: the water permeability of geotextiles may significantly influence their permeability characteristics, and water permeability is closely related to porosity and permeability rate [30-31]. To verify this hypothesis, Matlab software was used to perform image processing on W100, W120, and W150 geotextiles, each with dimensions of 250 cm×250 cm, for a qualitative analysis of their water permeability. The results are shown in Fig. 6.
From Fig. 6, it can be observed that the pore distribution of geotextiles exhibits significant non-uniformity, with some areas appearing dense and completely pore-free. This phenomenon is primarily attributed to two factors: first, limitations in production processes affecting the uniformity of pore distribution in the fabric; second, compression that may occur during transportation and storage, causing non-directional displacement of woven threads, which further exacerbates the non-uniformity of pore distribution. When the image resolution was set to 2500×2500 pixels and the corresponding program was executed, the results indicated that the porosity of the geotextiles decreased as their unit mass increased. Based on this, it can be inferred that the greater the unit mass of the geotextile, the lower its porosity, and consequently, its water permeability diminishes.
Fig. 6Geotextile samples of different specifications
a) W100Geotextile sample
b) W120Geotextile sample
c) W150Geotextile sample
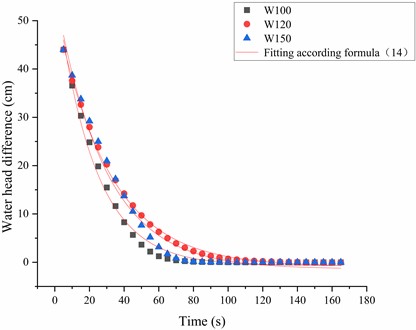
To further verify the above inference, a variable head permeability test was conducted. By measuring the variation of the water head difference over time, the relationship curves shown in Fig. 7 were obtained, which were used to perform a quantitative analysis of the water permeability of the geotextiles. This experiment provided more compelling evidence for studying the permeability characteristics of geotextiles by quantifying their water permeability.
Fig. 7Fitted curve of the head difference versus time according to Eq. (14)
According to Darcy’s law:
where the hydraulic gradient is:
It can be obtained:
Decree:
where, φ is the water permeability.
Obtained:
From the integral relationship:
where:
Substituting into Eq. (8) obtained:
Integrating Eq. (11) obtained:
Eliminating the constant of integration obtained:
Simplifying obtained:
where:
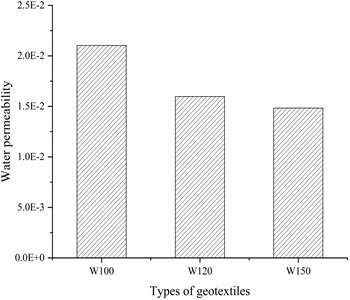
Subsequently, the data in Fig. 7 were fitted using Eq. (14), resulting in the permeability rate relationship graph for the three geotextiles shown in Fig. 8. The results indicate that the permeability rate of W100 is significantly higher than that of W120, while the permeability rate of W120 is higher than that of W150. This trend clearly demonstrates that, under a constant sand fill height, the lower the unit mass of the geotextile, the higher its porosity and permeability rate, leading to better permeability performance and stronger seepage characteristics. Therefore, it can be concluded that the pore structure of the geotextile plays a crucial role in its own permeability and the permeability of the geotextile-soil system. These research results validate, both qualitatively and quantitatively, that the water permeability of the geotextile has a significant impact on the permeability of both the geotextile itself and the geotextile-soil system.
Fig. 8Permeability relationship diagram for each geotextile
3.3. Research on the influence of geotextiles on the permeability characteristics of geotextile-soil systems
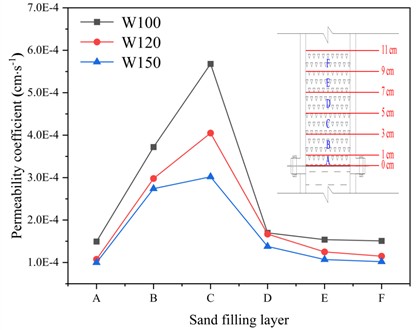
Considering that the movement of sand particles under the action of water flow can affect the permeability coefficient k, further investigation into the movement pattern of sand particles was conducted. A formula was derived, and the permeability coefficient of each sand layer was calculated (Fig. 9). The layers are defined as follows: from bottom to top, the ranges 0-1 cm, 1-3 cm, 3-5 cm, 5-7 cm, 7-9 cm, and 9-11 cm are designated as layers A, B, C, D, E, and F, respectively.
Derivation of the permeability coefficient formula for each sand layer.
According to Darcy’s law:
where v1 represents the flow velocity corresponding to the water passing through layer A; kA represents the permeability coefficient of layer A; j1 represents the hydraulic gradient corresponding to layer A:
where v2 represents the flow velocity corresponding to the water passing through layer B; kB represents the permeability coefficient of layer B; j2 represents the hydraulic gradient corresponding to layer B.
Where the hydraulic gradient is:
where H1 represents the head difference corresponding to layer A; L1 represents the seepage path corresponding to layer A:
where H2 represents the head difference corresponding to layer B; L2 represents the seepage path corresponding to layer B.
Because:
From Eqs. (16) and (18), we get:
Additionally, since:
Substituting Eqs. (19), (22), (23), and (24) into Eq. (17) yields:
Similarly, the permeability coefficients of layers C, D, E, and F can also be determined.
Fig. 9 shows the relationship between the permeability coefficients of the sand-filled layers for each geotextile. It can be observed from the figure that the permeability coefficients of the sand-filled layers initially increase, then decrease, and eventually stabilize. The permeability coefficient reaches its maximum in layer C, while the coefficients in layers A, B, D, E, and F are relatively smaller. The occurrence of this phenomenon can be explained as follows: Under the influence of water flow, the sand samples near the geotextile (layer A) are affected by the presence of geotextile pores. The fine particles in layer A are subjected to a downward net force, causing the fine particles to either pass through the geotextile or become trapped in its pores. Once a certain amount of fine particles in layer A are lost, a channel of fine particles gradually forms in this layer, leading to the migration of fine particles from layer B into layer A under the influence of water flow. These fine particles further clog the fine particle channels in layer A and the pores of the geotextile. When the fine particles in layer B are lost to a certain extent and form a similar particle channel to that in layer A, the fine particles in layer C begin to move downward. These particles also block the fine particle channels in layers B and A, as well as the geotextile pores. As the degree of particle clogging increases, the flow velocity of water gradually decreases, reducing the force exerted by the water flow on the fine particles. When the downward movement of fine particles in layer C reaches a certain stage, the force of the water flow is insufficient to mobilize the fine particles in layer D downward, resulting in the inability of layer D’s fine particles to fill the fine particle channels in layer C. At this stage, the movement of fine particles within the sand samples tends to reach equilibrium. Fine particle loss from layers D, E, and F is minimal. The fine particle channels in layer A and the pores of the geotextile are filled with fine particles from layers B and C, which results in layer A having the smallest permeability coefficient, while layer C has the largest permeability coefficient, and layer B’s coefficient lies in between. In contrast, the fine particle loss in layers D, E, and F is relatively minor, leading to permeability coefficients in these layers being lower than those of layers A and B but higher than that of layer C. However, under the influence of water flow, a small amount of fine particles in layers D, E, and F inevitably begins to migrate downward, starting from layer D. As the number of layers increases, the amount of fine particle loss decreases progressively, causing the permeability coefficients of layers D, E, and F to decrease. This leads to the observed pattern where the permeability coefficient initially increases, then decreases, and finally stabilizes.
Fig. 9Permeability relationship diagram for each geotextile
3.4. The migration pattern of particles within the apparatus
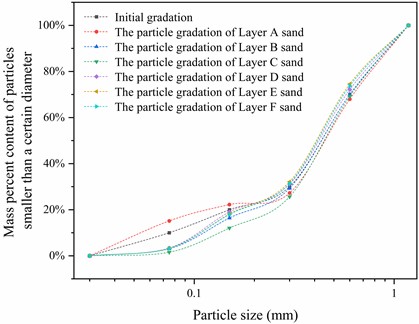
To investigate the changes in permeability coefficients of each sand layer, W120 was taken as an example. The sand from each layer was extracted and tested for its gradation after the test, following the specific testing process below: After completing the permeability test, the water in the apparatus was drained completely, and the setup was left to stand for 12 hours, allowing the sand to settle. The height of the sand layer was measured using a right-angle ruler, and sand samples were extracted proportionally based on the measured layer heights. During the layering process, the right-angle ruler was consistently used to ensure that the height of each layer was measured with millimeter-level precision. For sampling, ring knives of consistent diameter were used to take three-point samples from each sand layer, ensuring that the sampling locations were evenly and reasonably distributed. After sampling, the samples were labeled and placed in an oven for drying. Once dried, the samples were weighed to determine their mass. Subsequently, sieves with different mesh sizes were used to separate the sand particles by size range. For particles trapped in the sieve mesh, a soft brush was used to gently remove them, and they were placed in the corresponding location. After sieving, the sand samples were weighed again, and the gradation of each layer was calculated based on the weighing results. During the sieving process, operations were conducted as slowly as possible, and the sieve cover was kept tightly sealed to prevent fine particles from escaping and affecting the accuracy of the experimental results. A high-precision electronic balance was used for weighing to ensure the reliability and accuracy of the data. The test results are shown in Fig. 10, which shows the particle size distribution curves of sand layers from A to F. From the figure, observed that after the test, fine sand particles in each layer moved downward, while the proportion of coarse sand remained largely unchanged. Compared to the initial gradation, the proportion of fine sand was the lowest and that of coarse sand was the highest in layer C, resulting in the highest permeability coefficient for layer C. In contrast, layer A had the highest proportion of fine sand, leading to clogging and thus the lowest permeability coefficient. The proportion of fine sand in layer B was slightly lower than that in layer A. For layers D, E, and F, a proportion of the fine sand was lost compared to the initial gradation, but the amount of loss was less than that of layer C, while the proportions of other sand sizes remained largely unchanged. Therefore, the results align with the reasoning proposed by the author.
Fig. 10Permeability relationship diagram for each geotextile
A series of empirical formulas for the permeability coefficient k have been derived based on previous research, including the Hazen formula [7] k=Cd210 (where C is a dimensionless coefficient), the Zhu Chonghui formula [11] k=ReCuCcd210 (where Re is a dimensionless coefficient), and the Man Xiaolei formula [24]k=Pd250Cc/Cu (where P is a dimensionless coefficient). These formulas were used for theoretical calculations (specific parameters are shown in Table 4 and Table 5), and the resulting empirical values were compared with experimental values in the curve shown in Fig. 11. As observed in the figure, regardless of which formula was used, the results exhibited a trend of initially increasing and then decreasing, which aligns closely with the experimental results. This consistency also verifies the accuracy of the testing method.
Fig. 11Comparison of permeability coefficient test values and empirical values for each sand layer
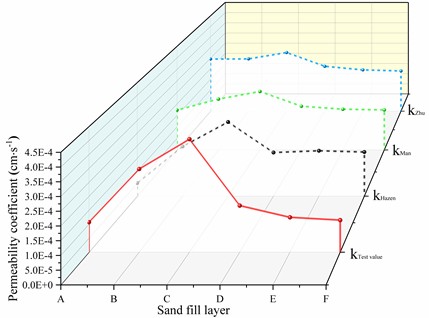
Table 4Sand sample parameter table
Sand fill layer | Effective particle size d10 / mm | Boundary particle size d30 / mm | Average particle size d50 / mm | Limiting particle size d60 / mm | Uniformity coefficient Cu | Coefficient of curvature Cc |
A | 0.055 | 0.303 | 0.410 | 0.549 | 9.992 | 3.045 |
B | 0.108 | 0.304 | 0.427 | 0.506 | 4.705 | 1.694 |
C | 0.131 | 0.322 | 0.442 | 0.518 | 3.951 | 1.521 |
D | 0.101 | 0.281 | 0.413 | 0.489 | 4.862 | 1.611 |
E | 0.103 | 0.270 | 0.402 | 0.473 | 4.608 | 1.503 |
F | 0.075 | 0.267 | 0.400 | 0.470 | 4.635 | 1.493 |
Table 5Sand sample parameter table
Sand fill layer | kTestvalue (×10-4) | kHazen (×10-4) | kMan (×10-4) | kZhu (×10-4) |
A | 2.96 | 0.52 | 1.73 | 2.46 |
B | 4.03 | 1.97 | 2.21 | 2.47 |
C | 1.60 | 2.94 | 2.54 | 2.77 |
D | 1.22 | 1.73 | 1.90 | 2.12 |
E | 1.15 | 1.80 | 1.77 | 1.95 |
F | 1.08 | 1.75 | 1.74 | 1.90 |
4. Conclusions
1) The permeability coefficients of all geotextile-soil systems were observed to decrease over time and eventually reached a stable seepage state.
2) In this test, the relationship between the permeability coefficient of the geotextile-soil system and the sand-filling height was established. For the permeability coefficient of the geotextile-soil system, the geotextile was found to have a significant impact when the sand-filling height was less than 5 cm. However, when the sand-filling height exceeded 5 cm, the influence of the geotextile diminished and could be approximated as the permeability coefficient of pure sand. This indicates that the permeability coefficient of the geotextile-soil system tends to stabilize when the sand-filling height exceeds 5 cm.
3) The water permeability of geotextiles significantly affects their permeability performance, specifically manifested as follows: the larger the porosity, the higher the water permeability; the greater the permeability coefficient of the geotextile, the greater the overall permeability coefficient of the geotextile-soil system.
4) The spatial distribution of sand particles within the apparatus: compared to the initial gradation, the proportion of fine sand in layer A is relatively higher, while the proportion of coarse sand is relatively lower; in layer C, the proportion of coarse sand is relatively higher, and the proportion of fine sand is relatively lower.
References
-
E. C. Lee and R. S. Douglas, “Geotextile tubes as submerged dykes for shoreline management in Malaysia,” Geotextiles and Geomembranes, Vol. 30, pp. 8–15, Feb. 2012, https://doi.org/10.1016/j.geotexmem.2011.01.003
-
L. Martinelli, B. Zanuttigh, N. de Nigris, and M. Preti, “Sand bag barriers for coastal protection along the Emilia Romagna littoral, Northern Adriatic Sea, Italy,” Geotextiles and Geomembranes, Vol. 29, No. 4, pp. 370–380, Aug. 2011, https://doi.org/10.1016/j.geotexmem.2010.11.010
-
I. E. Alvarez, R. Rubio, and H. Ricalde, “Beach restoration with geotextile tubes as submerged breakwaters in Yucatan, Mexico,” Geotextiles and Geomembranes, Vol. 25, No. 4-5, pp. 233–241, Aug. 2007, https://doi.org/10.1016/j.geotexmem.2007.02.005
-
Y. Shu, “Progress in the engineering technology of fabric-bag dams in China,” (in Chinese), Advances in Science and Technology of Water Resources, Vol. 38, No. 1, p. 12, Jan. 2018.
-
W. Shan and C. Xu, “Application of geotextile tube dewatering technology for silt solidification in town dredging projects,” (in Chinese), Yellow River, Vol. 2020, No. S1, pp. 11–13, Jan. 2020.
-
Z. Lu, “Application of geosynthetics in reservoir construction in tidal estuary areas,” (in Chinese), Advances in Science and Technology of Water Resources, Vol. 2009, No. 6, Jun. 2009, https://doi.org/journalarticle/5af50712c095d718d820781f
-
H. Winter and M. Goldscheider, “Discussion of “Air diffusion through membranes in triaxial tests”,” Journal of the Geotechnical Engineering Division, Vol. 104, No. 9, pp. 1209–1211, Sep. 1978, https://doi.org/10.1061/ajgeb6.0000693
-
J. K. Mitchell, Principles of Soil Behavior in Geotechnical Engineering. (in Chinese), Nanjing Institute of Technology Press, 1988.
-
Yang Bing et al., “Experimental study on the influence of gradation characteristics on the permeability coefficient of sandy soils,” (in Chinese), Journal of Southwest Jiaotong University, Vol. 51, No. 5, pp. 855–861, 2016, https://doi.org/10.3969/j.issn.0258-2724.2016.05.006
-
L. Su, Y. Zhang, and T. Wang, “Experimental study on the permeability characteristics of sandy soils with different grain sizes,” (in Chinese), Rock and Soil Mechanics, Vol. 35, No. 5, 2014, https://doi.org/cnki:sun:ytlx.0.2014-05-011
-
C. Zhu, “Research on the permeability characteristics of coarse-grained soil,” (in Chinese), Ph.D. thesis, Northwest A&F University, 2006.
-
G. Duan, S. Zhang, and Y. Jie, “Analysis of the influence of filter mesh size and layers on the soil retention effect of filter materials,” (in Chinese), Water Resources and Hydropower Engineering, Vol. 51, No. 1, 2020, https://doi.org/10.13928/j.cnki.wrahe.2020.01.005
-
X. Pang, J. Zhu, and X. Zhou, “Research on the improvement of test devices and methods for geotextile clogging,” (in Chinese), Journal of Yangtze River Scientific Research Institute, Vol. 36, No. 3, 2019, https://doi.org/cnki:sun:cjkb.0.2019-03-015
-
J. Bai and Q. Xia, “Research on testing technology for the vertical permeability coefficient of geotextiles,” (in Chinese), Technical Textiles, Vol. 25, No. 3, 2007, https://doi.org/10.3969/j.issn.1004-7093.2007.03.008
-
T. Iryo and R. K. Rowe, “On the hydraulic behavior of unsaturated nonwoven geotextiles,” Geotextiles and Geomembranes, Vol. 21, No. 6, pp. 381–404, Dec. 2003, https://doi.org/10.1016/s0266-1144(03)00046-3
-
C. Qiu and S. Yan, “Analysis of the stress characteristics of large-scale geotextile-filled bags,” (in Chinese), Engineering Mechanics, Vol. 26, No. 1, pp. 92–97, Jan. 2009.
-
Z. Ren and X. Li, “Research on the water permeability of geotextiles,” (in Chinese), Northwest Water Resources and Water Engineering, Vol. 8, No. 4, Apr. 1997, https://doi.org/cnki:sun:xbsz.0.1997-04-003
-
C.-S. Wu, Y.-S. Hong, and R.-H. Wang, “The influence of uniaxial tensile strain on the pore size and filtration characteristics of geotextiles,” Geotextiles and Geomembranes, Vol. 26, No. 3, pp. 250–262, Jun. 2008, https://doi.org/10.1016/j.geotexmem.2007.09.004
-
L. Tang et al., “Experimental study on the influence of uniaxial tension on the filtration performance of geotextiles,” (in Chinese), Chinese Journal of Geotechnical Engineering, Vol. 35, No. 4, Apr. 2013, https://doi.org/cnki:sun:ytgc.0.2013-04-028
-
D. Wu et al., “Experimental study on the tensile properties of geosynthetics in soil,” (in Chinese), Northwestern Seismological Journal, Jan. 2011.
-
S. A. Ghaffari, E. Sattari, and A. Hamidi, “Study on the bearing capacity of foundations with strip shells near geotextile-reinforced slopes,” Journal of Central South University: English Edition, Vol. 28, No. 8, p. 17, 2021.
-
L. Chen and Z. Tong, “The influence of tensile strain on the clogging characteristics of geotextiles with discontinuous graded soils,” (in Chinese), Journal of Hydroelectric Engineering, Vol. 2003, No. 2, pp. 97–102, 2003, https://doi.org/10.3969/j.issn.1003-1243.2003.02.014
-
G. Mei, J. Feng, M. Xu, and P. Ni, “Estimation of interface parameter for one-dimensional consolidation with continuous drainage boundary conditions,” International Journal of Geomechanics, Vol. 22, No. 3, Mar. 2022, https://doi.org/10.1061/(asce)gm.1943-5622.0002300
-
C. Li, M. Lu, and H. Ma, “Solutions for one-dimensional rheological consolidation of a clay layer with threshold hydraulic gradient under multistage loading,” International Journal of Geomechanics, Vol. 20, No. 11, Nov. 2020, https://doi.org/10.1061/(asce)gm.1943-5622.0001846
-
H. Wang et al., “The influence of tension on the permeability characteristics of geotextile-sand systems,” (in Chinese), Journal of Xiangnan University, Vol. 44, No. 2, pp. 115–120, 2023, https://doi.org/10.3969/j.issn.1672-8173.2023.02.019
-
X. Man, Y. Bao, and H. Wu, “The influence of sand particle gradation on the permeability characteristics of geotextile-sand systems,” (in Chinese), China Rural Water and Hydropower, Vol. 2022, No. 7, Jul. 2022.
-
M. Rong, X. Man, and Y. Wu, “The influence of different water flow conditions on the permeability performance of uniaxially stretched woven fabric-sand systems,” (in Chinese), Journal of Changzhou Institute of Technology, Vol. 36, No. 6, pp. 1–6, 2023.
-
G. Wu, G. Lei, and H. Jiang, “Experimental study on the permeability characteristics of woven geotextiles under soil cover conditions,” (in Chinese), in Proceedings of the 27th National Geotechnical Testing Symposium, 2016.
-
A. Miszkowska, S. Lenart, and E. Koda, “Changes of permeability of nonwoven geotextiles due to clogging and cyclic water flow in laboratory conditions,” Water, Vol. 9, No. 9, p. 660, Sep. 2017, https://doi.org/10.3390/w9090660
-
J. L. Wang and Y. Ma, “Experimental study on the permeability characteristics of geotextiles,” (in Chinese), China Soil and Water Conservation, Vol. 2007, No. 8, pp. 27–28, 2007, https://doi.org/10.3969/j.issn.1000-0941.2007.08.010
-
“Test procedures of geosynthetics for highway engineering,” (in Chinese), People’s Transportation Press, Beijing, Ministry of Transport Highway Research Institute, Jun. 2006.
About this article
This study was funded by the Key Project of Natural Science Research Program for Universities in Anhui Province (KJ2021A1099), the Science and Technology Program for Housing and Urban-Rural Development in Anhui Province (2022-YF061), and the National Innovation and Entrepreneurship Training Program for College Students (2024CXXL147).
The datasets generated during and/or analyzed during the current study are available from the corresponding author on reasonable request.
Xiaolei Man: conceptualization, methodology, resources, validation, writing-review and editing, supervision, project administration, funding acquisition. Hongqi Zhou: methodology, software, validation, formal analysis, writing-original draft preparation, writing-review and editing, visualization. Xueli Liu: conceptualization, data curation, project administration. Yun Chen: software, supervision, funding acquisition. Hao Qu: validation, investigation, data curation.
The authors declare that they have no conflict of interest.

