Abstract
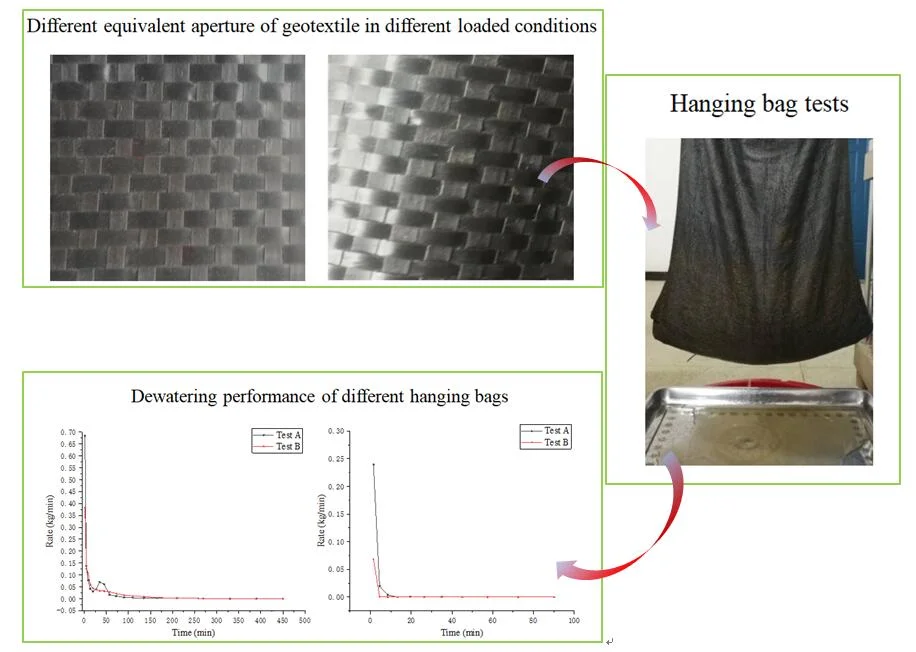
Geotubes are made by sewing geotextiles together and geotextiles are woven with warp and weft threads of different mechanical properties. This research explores effect of geotextile sewing method on dewatering performance of geotubes using a hanging bag test. Two types of hanging bags are made by different geotextile sewing methods: horizontal bag with the warp threads along its circular direction and vertical bag with the warp threads along its axial direction. The test results show that the dewatering performance of the bag is better if its weft stress is greater than warp stress. Combined with the stress analysis of a simplified geotube, the effect of geotextile sewing method on dewatering performance of geotubes is obtained: when the circumferential direction of geotubes is consistent with the weft threads, dewatering performance of geotubes will be better. This finding has the potential to act as a guideline for construction of geotubes in engineering.
Highlights
- The effect of geotextile sewing method on dewatering performance of geotubes was considered.
- Two types of hanging bags were used in hanging bag tests to explore their dewatering performance.
- The effect of geotextile sewing method on dewatering performance of geotubes was analysed with the test dates and the stress analysis of a simplified geotube.
1. Introduction
Geotube dams have been widely used in coastal port wharf, sea dam, and other estuary and coastal engineering due to high adaptability to foundation deformation, fast construction speed and low cost [1]. They are generally made up of several layers of geotubes. Each layer of geotube is constructed by hydraulic grouting, filling and dewatering consolidation. The construction period of the geotube dam is closely related to the dewatering performance of geotubes. Thus, dewatering performance of geotubes has been a research focus in recent decades [2, 3].
Cantré et al. [4, 5] carried out theoretical research on the geotube’s characteristics under certain strain conditions using photogrammetry. Jin et al. [6] conducted an experimental study on the deformation of a geotube in different directions during the filling process, and the results showed that the point with the smallest deformation was at the maximum width of the geotube. Chen et al. [7] studied the effect of tensile strain on the permeability of the geotextiles and found that the tensile strain would make the geotextiles silted up, and the degree of silting up would increase with the increase of tensile strain. Wu et al. [8] tested the permeability of the geotextile after applying unidirectional tensile force along the weft direction. The results showed that the equivalent pore diameter and permeability coefficient of the geotextile would increase when subjected to unidirectional tensile force. Fourie et al. [9] carried out single and two-way tensile tests on the geotextiles of different thickness. The results showed that the equivalent pore diameter of the geotextiles would change with the change of tensile force no matter in one-way or two-way tensile. Wang et al. [10] studied the relationship between the permeability coefficient of the geotexiles and normal pressure by placing porous pressure plates on the top and bottom of the geotexiles, and then applying pressure to measure the permeability coefficient of geotextiles under the current pressure. The results showed that with the increase of normal pressure, the permeability coefficient of the geotextiles decreased significantly. Hong et al. [11] studied the change of permeability coefficient of the geotextile under different types of load. The results showed that the overall permeability coefficient of the geotextile system increased with the increase of load. Bai et al. [12] summarized the microstructure and permeability principle of the geotextile through qualitative analysis. Lei et al. [13] carried out the permeability test of the geotextile under both biaxial tension and no tension states. The results showed that the permeability under biaxial tension and no tension states was significantly different, and the overall permeability coefficient of the system under biaxial tension first decreased and then increased.
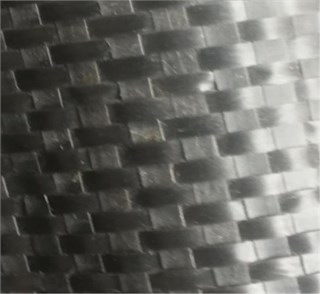
Geotubes are made by sewing geotextiles together and geotextiles are woven by warp and weft threads (Fig. 1). Under no stress state, the weft thread has no deformation (Fig. 1(b)), while the warp thread is wavy (Fig. 1(a)). Therefore, it is necessary to investigate the effect of geotextile sewing method on dewatering performance of geotubes. Methods for evaluating the dewatering performance of geotubes include hanging bag test [14-17], pressure filtration test [18], pillow-shaped filling bag test [19] and field filling test [20, 21]. In the hanging bag test, a piece of geotextile is sewn into a cylinder-like bag, with the top open and fixed on a bracket, and a container is placed under the bag to collect the water and soil discharged during the test. The dewatering performance of the hanged bag is obtained by analyzing the collected water. Hanging bag test is easy to operate and flexible to control the longitudinal and latitudinal stress conditions and thus is adopted in this research.
Fig. 1a) Warp thread, b) weft thread

a)

b)
The remainder of the paper is organized as follows. Section 2 analyzes the stress characteristics of a simplified geotube. Section 3 presents the basic steps of the hanging bag test. Section 4 analyzes the hanging bag test results to compare the dewatering performance of hanging bags made by different sewing methods. Conclusions are given in Section 5.
2. Stress analysis of a simplified geotube
The geotube is simplified into a cylinder as shown in Fig. 2. Given that the mud is blown in from opening “a”, the geotube will be subject to certain pressure when it is filled with sufficient mud. Therefore, the axial and circumferential stresses in the geotube will be generated.
Fig. 2Simplified model of a geotube

2.1. Axial stress
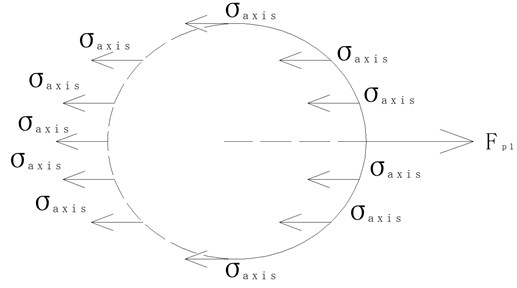
The right end of the model in Fig. 2 is taken as a research object, and its stress state is shown in Fig. 3. According to the stress balance, an equation is obtained:
with:
where Fp1 is the pressure of mud on the right end of the geotube, Faxis is the tension of geotextile on the right end of the geotube, p is the pressure inside the geotube, R is the radius of the cross section of the geotube, δ is the thickness of the geotextile, and σaxis is the axial stress.
From Eqs. (1)-(3), the following relation is obtained:
Fig. 3Stress state of the right end of the geotube
2.2. Circumferential stress
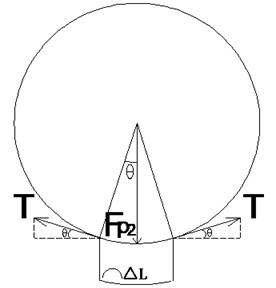
An infinitesimal arc segment with circumferential length ∆L is taken from the cross section of the geotube as a research object, and its stress state is shown in Fig. 4. According to the stress balance in the radial direction, an equation is obtained:
with:
where Fp2 is the pressure of mud on the side wall of the geotube, and T is the circumferential tension.
From Eqs. (5)-(7), the following relation is obtained:
The circumferential stress of the filling geotube is then calculated as:
where σcircum denotes the circumferential stress.
The following relation between axial stress and circumferential stress of the filling geotube can be deduced from Eqs. (4) and (9):
Fig. 4Stress state of an infinitesimal arc segment from the cross section of the geotube
3. Hanging bag test
3.1. Test materials
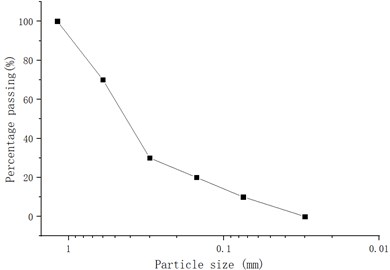
The sand soil is used in the hanging bag test to make a mud mixture and its grading curve is shown in Fig. 5. The geotextile used for the hanging bag is commonly used for geotube, with a surface density of 200 g/m2, a thickness of 0.67 mm, and an equivalent aperture of 0.08-0.5 mm. Two types of hanging bags with the diameter of 0.5 m and height of 1m are made by different geotextile sewing methods: horizontal bag with the warp threads along its circular direction and vertical bag with the warp threads along its axial direction.
Fig. 5The grading curve of the sand soil used in the hanging bag test
3.2. Test scheme
The process of hanging bag test is summarized as follows. Firstly, 10 kg of sand soil and 10 kg of water are mixed into a mud mixture. Secondly, the mud mixture is poured into the hanging bag at a uniform speed. Thirdly, a weighing plate is placed under the hanging bag to receive exudate, and the weighing plate should be replaced and weighed at regular intervals until there is no liquid exudation coming out of the hanging bag. Finally, the received exudate at each interval is weighed again after drying. The mass of soil loss and water loss in each period of time could be analyzed according to the mass of exudate weighed before and after drying. The test setup is shown in Fig. 6. The tests of the horizontal and vertical bags are recorded as Test A and Test B, respectively. The test data of Test A and Test B are recorded in Tables 1 and 2, respectively.
Table 1Recorded data of Test A
Interval No. | Time (min) | Mass of soil loss (kg) | Mass of water loss (kg) | Rate of soil loss (kg·min-1) | Rate of water loss (kg·min-1) |
1 | 3 | 0.718 | 2.051 | 0.2393 | 0.6837 |
2 | 3 | 0.059 | 0.413 | 0.0197 | 0.1377 |
3 | 5 | 0.02 | 0.39 | 0.004 | 0.078 |
4 | 5 | 0 | 0.21 | 0 | 0.042 |
5 | 7 | 0.007 | 0.216 | 0.001 | 0.0309 |
6 | 7 | 0 | 0.282 | 0 | 0.0403 |
7 | 10 | 0.002 | 0.699 | 0.0002 | 0.0699 |
8 | 10 | 0 | 0.6 | 0 | 0.06 |
9 | 15 | 0 | 0.247 | 0 | 0.0165 |
10 | 15 | 0 | 0.164 | 0 | 0.0109 |
11 | 20 | 0 | 0.12 | 0 | 0.006 |
12 | 20 | 0 | 0.079 | 0 | 0.004 |
13 | 30 | 0 | 0.1 | 0 | 0.0033 |
14 | 30 | 0 | 0.083 | 0 | 0.0028 |
15 | 60 | 0 | 0.128 | 0 | 0.0021 |
16 | 60 | 0 | 0.067 | 0 | 0.0011 |
17 | 60 | 0 | 0.03 | 0 | 0.0005 |
18 | 60 | 0 | 0.012 | 0 | 0.0002 |
19 | 60 | 0 | 0.003 | 0 | 0.0001 |
Table 2Recorded data of Test B
Interval No. | Time (min) | Mass of soil loss (kg) | Mass of water loss (kg) | Rate of soil loss (kg·min-1) | Rate of water loss (kg·min-1) |
1 | 3 | 0.206 | 1.149 | 0.0687 | 0.383 |
2 | 3 | 0.003 | 0.379 | 0.001 | 0.1263 |
3 | 5 | 0 | 0.55 | 0 | 0.11 |
4 | 5 | 0 | 0.298 | 0 | 0.0596 |
5 | 7 | 0 | 0.302 | 0 | 0.0431 |
6 | 7 | 0 | 0.269 | 0 | 0.0384 |
7 | 10 | 0 | 0.327 | 0 | 0.0327 |
8 | 10 | 0 | 0.32 | 0 | 0.032 |
9 | 15 | 0 | 0.421 | 0 | 0.0281 |
10 | 15 | 0 | 0.323 | 0 | 0.0215 |
11 | 20 | 0 | 0.307 | 0 | 0.0154 |
12 | 20 | 0 | 0.232 | 0 | 0.0116 |
13 | 30 | 0 | 0.271 | 0 | 0.009 |
14 | 30 | 0 | 0.14 | 0 | 0.0047 |
15 | 60 | 0 | 0.14 | 0 | 0.0023 |
16 | 60 | 0 | 0.05 | 0 | 0.0008 |
17 | 60 | 0 | 0.018 | 0 | 0.0003 |
18 | 60 | 0 | 0.005 | 0 | 0.0001 |
4. Test results
Figs. 7 and 8 present the rate curves of water loss and soil loss of Test A and Test B, respectively. It can be seen from these figures that the rates of water loss and soil loss in both Test A and Test B decrease rapidly in a short period of time and then gradually slow down. The rates of soil loss in the tests decrease faster than water loss and there is water seepage but no loss of soil particles in the later stage of the test.
Fig. 6Hanging bag test setup
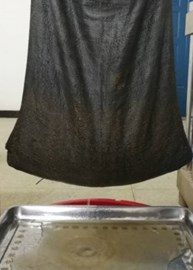
Fig. 9 compares the rates of soil loss in Test A and Test B. The trends in both Test A and Test B are similar, but the rate of soil loss in Test A is larger than that in Test B in the initial stage of the test. Fig. 10 shows a comparison of the cumulative quantity of soil loss in Test A and Test B. It is seen that the cumulative quantity of soil loss in Test A is greater than that in Test B. The cumulative quantity of soil loss during the whole test of Test A or Test B does not exceed 10 % of the total sand soil, meeting the requirement of the soil conservation criteria of geotubes.
Fig. 7Rates of water loss and soil loss in Test A
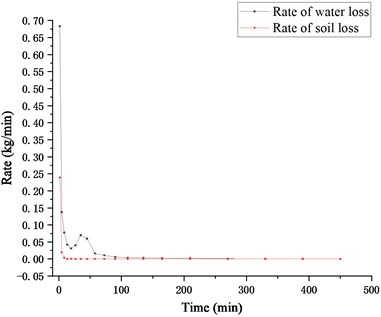
Fig. 8Rates of water loss and soil loss in Test B
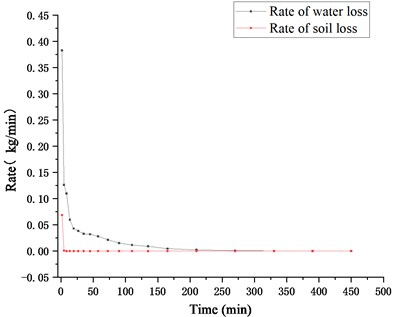
Fig. 9Rates of soil loss in Test A and Test B
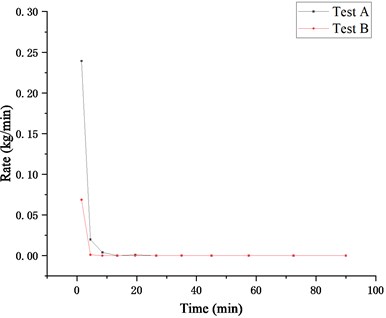
Fig. 10Cumulative quantity of soil loss in Test A and Test B
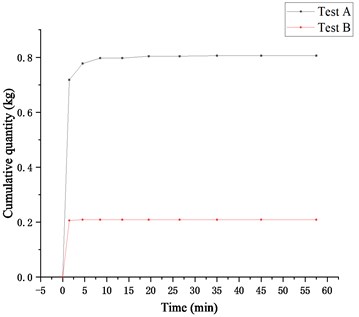
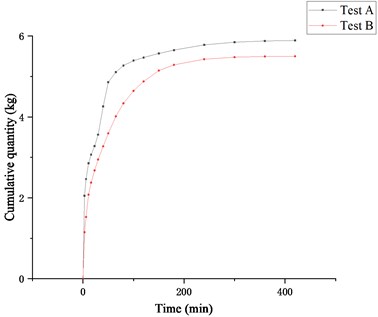
Fig. 11 compares the rates of water loss in Test A and Test B. It is seen that the rates of water loss in Test A and Test B are similar in the later stage of the test. But it is significantly different in the early stage. A fluctuation in the rate of water loss only occurs in Test A, which means that a brief and unstable anti-filtration structure maybe has formed in the horizontal bag in the early stage of Test A. Fig. 12 shows the cumulative quantity of water loss in both Test A and Test B. As seen from this figure, the cumulative quantity curve of water loss in Test A is always above the curve in Test B, indicating that the dewatering quantity of the horizontal bag is more than that of the vertical bag in the same test period, and the dewatering performance of the horizontal bag is better.
Fig. 11Rates of water loss in Test A and Test B
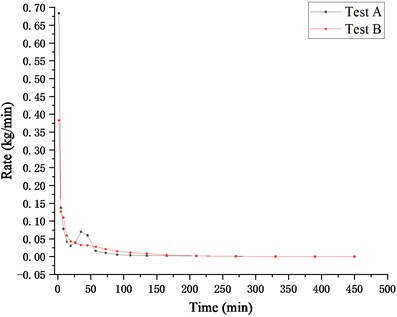
Fig. 12Cumulative quantity of water loss in Test A and Test B
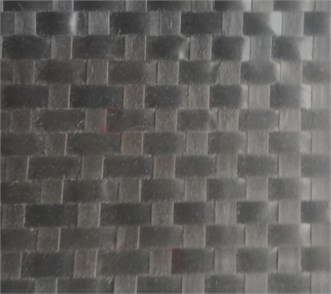
Due to the gravity, the stresses on the weft threads are greater than those on the warp threads for the horizontal bag, while the stresses on the warp threads are greater than those on the weft threads for the vertical bag. Through the uniaxial tensile test of geotextile, it is found that the pores of geotextile will become smaller when it is stretched along the warp thread direction (Fig. 13(a)), while the pores will become larger when it is stretched along the weft thread direction (Fig. 13(b)). This phenomenon explains the results of the hanging bag test that the dewatering performance of the horizontal bag is better than that of the vertical bag.
Fig. 13Deformation of geotextiles under stresses in different directions: a) warp thread direction; b) wept thread direction
a)
b)
5. Conclusions
The stress analysis of a simplified geotube indicates that the circumferential stress is greater than the axial stress in the filling process of a geotube. The hanging bag test shows that when the weft stress is greater than the warp stress, the dewatering performance of hanging bag is better. In conclusion, under the same filling pressure, if the weft direction of geotextile is consistent with the circular direction of the geotube, the dewatering performance of the geotube will be better.
However, the tensile strength of the warp and weft threads are generally different. If the tensile strength of the warp thread is greater than the weft thread, and the warp direction of the geotextile is consistent with the circular direction of the geotube, the geotube can bear greater punching filling pressure, so as to improve its dewatering rate. Thus, it is necessary to study the dewatering performance of geotubes considering coupling influences of filling pressure and geotextile sewing method in future work.
References
-
Man X. L., Shu Y. M., Yu C. L., et al. Effect of cyclic wave loading on scouring stability of geotube dams. Ocean Engineering, Vol. 152, 2018, p. 1-5.
-
Yan Yue, Yan Shuwang, Qiu Changlin, et al. Study on design calculation method of geotextile filling bag. Geotechnical Mechanics, Vol. 31, Issue 1, 2010, p. 327-330.
-
Malik J., Sysala S. Analysis of geosynthetic tubes filled with several liquids with different densities. Geotextiles and Geomembranes, Vol. 29, Issue 3, 2011, p. 249-256.
-
Cantré S., Saathoff F. Design method for geotextile tubes considering strain- Formulation and verification by laboratory tests using photogrammetry. Geotextiles and Geomembranes, Vol. 29, Issue 3, 2011, p. 201-210.
-
Thomas H., Cantré S. Applications of low-budget photogrammetry in the geotechnical laboratory. Photogrammetric Record, Vol. 24, Issue 128, 2010, p. 332-350.
-
Jin Xiangyu, Zhu Yuansheng, Wang Jun Study on the application of mud-filled geotube in the land reclamation projects in the sea. Journal of Textile, Vol. 21, Issue 5, 2000, p. 56-59.
-
Chen Lun, Tong Zhaoxia Effect of tensile strain on the geotextile and silting characteristics of discontinuous graded soil. Journal of Hydroelectric Power, Vol. 2, 2003, p. 97-102.
-
Wu C. S., Hong Y. S., Wang R. H. The influence of uniaxial tensile strain on the pore size and filtration characteristics of geotextiles. Geotextiles and Geomembranes, Vol. 26, Issue 3, 2008, p. 250-262.
-
Fourie A. B., Addis P. C. Changes in filtration opening size of woven geotextiles subjected to tensile loads. Geotextiles and Geomembranes, Vol. 17, Issues 5-6, 1999, p. 331-340.
-
Wang Baotian, Xu Zhiwei, Zhang Wenhui, et al. Study on manufacturing geotextile permeameter and test results. Hydropower and Pumped Energy Storage, Vol. 1, 1999, p. 37-39.
-
Hong Y. S., Wu C. S., Yang Z. Y., et al. The load type influence on the filtration behavior of soil-nonwoven geotextile composite. Tamkang Journal of Science and Engineering, Vol. 14, Issue 1, 2011, p. 15-24.
-
Bai Jianying, Xia Qixing Study on testing technology of vertical permeability coefficient of geotextile. Industrial Textiles, Vol. 25, Issue 3, 2007, p. 27-33.
-
Lei Guohui, Wu Gang, Jiang Hong, et al. Biaxially-stretchable multifunctional permeability test device for geotextiles. Journal of Geotechnical Engineering, Vol. 38, 2016, p. 119-124.
-
Koerner G. R., Koerner R. M. Geotextile tube evaluation by hanging bag and pressure filtration testing. Geosynthetics Research and Development in Progress, 2005, https://doi.org/10.1061/40782(161)47.
-
Koerner G. R., Koerner R. M. Geotextile tube assessment using a hanging bag test. Geotextiles & Geomembranes, Vol. 24, Issue 2, 2006, p. 129-137.
-
Chang Guangpin, Shu Yiming, Yin Jiachun, et al. Efficient dewatering method for filling geotube with high viscosity slurry. Science of Hydropower and Energy, Vol. 3, 2014, p. 129-133.
-
Wu Haimin, Shu Yiming, Chang Guangpin, et al. High efficient dewatering technology of filling geotube with soil material containing high viscosity clay (silt). Progress of Water Conservancy and Hydropower Science and Technology, Vol. 38, Issue 1, 2018, p. 19-27.
-
Moo Young H.-K., Gaffney D. A., Mo X. Testing procedures to assess the viability of dewatering with geotextile tubes. Geotextiles and Geomembranes, Vol. 20, Issue 5, 2002, p. 289-303.
-
Suits L. D., Sheahan T. C., Koerner R. M., et al. Performance tests for the selection of fabrics and additives when used as geotextile bags, containers, and tubes. Geotechnical Testing Journal, Vol. 33, Issue 3, 2010, p. 236-242.
-
Shin E. C., Oh Y. I. Consolidation process of geotextile tube filled with fine-grained materials. International Journal of Offshore and Polar Engineering, Vol. 14, Issue 2, 2004, p. 150.
-
Wu Haimin, Shu Yiming, Chang Guangpin, et al. Field model test of high efficiency dewatering process of filling geotube with soil materials containing high viscosity clay (silt). Journal of Geotechnical Engineering, Vol. 38, Issue 1, 2016, p. 209-215.
Cited by
About this article
This work was supported by the Key Research Project of Natural Science in Colleges and Universities of Anhui Province (KJ2019A0640), and the Scientific Research Foundation of Chuzhou University (2017qd03).

