Abstract
This paper explores the optimization of cutout schemes in tunnel excavation and blasting by introducing an improved segmented wedge-shaped blasting method, validated through both numerical simulations and field tests. The numerical simulations use the ANSYS/LS-DYNA fluid-solid coupling algorithm to analyze the damage effects, effective stress distribution, and vibration characteristics of surrounding rock for both the Conventional wedge cut and the segmented wedge cut methods. The results show that segmented wedge cutting significantly enhances the utilization rate of blast holes, reduces the formation of large gravel fragments, and effectively mitigates surrounding rock vibration velocities. In comparison to the Conventional method, the optimized undercut scheme not only increases blasting efficiency but also greatly enhances the rock fragmentation in the undercut area, thereby ensuring tunnel construction safety. The field test results validate the accuracy of the numerical simulations and show that the enhanced scheme holds significant potential for practical application in real-world projects.
Highlights
- A finite element model was developed based on an actual tunnel section.In contrast to traditional simplified models, this model's boundary conditions are precisely aligned with the actual tunnel's geometric characteristics and construction environment.
- The impact of two different cutting methods on the distribution of effective stress within the tunnel cavity was analyzed.The segmented wedge cutting method results in a more uniform distribution of effective stress across the entire cavity.
- The impact of traditional wedge cutting and segmented wedge cutting on the vibrations at various monitoring points within the tunnel was discussed.
1. Introduction
Urban rail transit tunnels represent a significant proportion of tunnel types [1-2]. Drilling and blasting are the predominant methods of tunneling and exhibit a positive growth trend [3]. Blasting in the cut area is a crucial step in tunnel excavation, directly impacting both construction efficiency and safety. While the Conventional wedge-shaped cut blasting scheme is commonly used, it has several practical limitations, including insufficient cut depth, uneven rock fragmentation, and excessive surrounding rock vibrations. Existing studies have mainly focused on the arrangement of blasting holes and delay times to address these issues. However, these studies have not adequately addressed the rock fragmentation effect in the cut area or the effective control of surrounding rock vibrations. As a result, there is still considerable potential for optimizing both the crushing and blasting effects of the current cut scheme.
Cardu et al. [4] compared the excavation efficiency of vertical and wedge cuts, concluding that parallel holes generate higher tensile stress, making them more suitable for small-section tunnel excavation. Zhang et al. [5] proposed a simplified diagram of rock mass stress for second-order, two-stage cut blasting, taking both temporal and spatial factors into account. They determined the stress distribution at the bottom of the cut hole through numerical simulations. To address the challenges of cut blasting under high ground stress, Ding et al. [6] summarized commonly used cut hole layout methods and developed a quasi-three-dimensional fluid-solid coupling model based on these methods. The pentagonal cut method was used as a benchmark to identify a more effective solution for deep rock blasting. Katsabanis [7] used numerical simulations and experimental methods to explore the relationship between rock particle size distribution and energy during explosions. Cheng and Gao et al. [8-9] examined the stress field intensity of large-diameter cut blasting using LS-DYNA numerical simulations. They then validated through field tests that large-diameter cut blasting significantly improves blasting footage and blasthole utilization. Wang et al. [10] proposed a theoretical model for rock crushing in cut blasting, considering both blasting stress waves and the effects of blasting gases. They offered a detailed explanation of the mechanism underlying blasting cavity formation. Based on the similarity theorem, Yang et al. [11] conducted model tests to examine the effects of five different cutting angles on blasthole utilization and post-blasting fragmentation. Their results indicated that the optimal cutting angle was 67°. Zhang et al. [12] introduced the CCFT cutting blasting method and used FEM-SPH coupled numerical simulations to evaluate its advantages over Conventional cutting blasting techniques. The method was then applied in two operational scenarios shaft cutting and tunnel cutting addressing the challenge of ejecting rocks from the bottom of the cut hole. Kumar et al. [13] developed a trenching method specifically designed for small- and medium-sized tunnels, validating its effectiveness through field tests. The results demonstrated satisfactory outcomes and a reduced excavation cycle. Wang et al. [14] used the AUTODYN method to preliminarily determine the optimal super-depth for deep-hole cutting blasting and later validated it through field tests. The results showed that a super-depth of 400 mm effectively ejected rocks and created a larger cut cavity. Li and Song et al. [15-16] studied the effects of varying empty hole diameters and the distance between empty and charging holes on the area of the cutting and crushing zone. Sun et al. [17] used the smoothed particle hydrodynamics (SPH) method to investigate how varying rock clamping coefficients and cutting hole configurations impact the excavation efficiency of blind shafts under high ground stress. Feng et al. [18] employed the continuous-discontinuous element method (CDEM) to study the effects of segmented cutting blasting. Cheng et al. [19] analyzed the segmented detonation of cutting holes and improved tunnel cycle footage and blasthole utilization rates by adjusting the spatial and temporal distribution of explosive energy. Bhagatet al. [20] employed three machine learning techniques to predict the impact of blasting vibrations on slope rockfall during tunnel excavation. Zhu et al. [21] proposed a method for predicting vibration velocity in layered rock masses subjected to multi-hole blasting, achieving prediction accuracies of 93 % and 94 % in two separate peak vibration velocity experiments. Gao et al. [22] investigated the maximum vibration velocity at model monitoring points of cut holes under different delay times using numerical simulations. The results indicated that with a delay time of 10 ms, blasting vibrations were reduced by 18 % compared to simultaneous detonation. Xue et al. [23] analyzed the energy and velocity characteristics of blasting vibration signals to address safety concerns in basements storing highly radioactive materials. They derived a formula for predicting blasting vibration frequency and peak values using equivalent elastic boundary theory and achieved accurate predictions. A review of existing literature reveals that current research on cut blasting mainly focuses on either blasting efficiency or blasting vibration, with no studies addressing both blasting effects and vibration peak values simultaneously. However, improving construction efficiency while maintaining safe vibration levels remains a key challenge in tunnel excavation.
To address this research gap, the present study proposes an improved segmented wedge cut blasting scheme based on a specific engineering tunnel and compares the Conventional wedge cut and segmented wedge blasting methods using ANSYS-LSDYNA fluid-structure coupling numerical simulations. The performance differences in undercut blasting are analyzed. Compared to Conventional methods, the innovations of this study are as follows: first, blasting efficiency and rock fragmentation are significantly enhanced through optimized blast hole layout; second, surrounding rock vibration is effectively reduced, thereby enhancing construction safety. Specifically, this research not only addresses the gaps in rock fragmentation and vibration control in Conventional wedge cutting methods, but also provides a more efficient and safer blasting solution for practical tunnel blasting.
2. Project overview
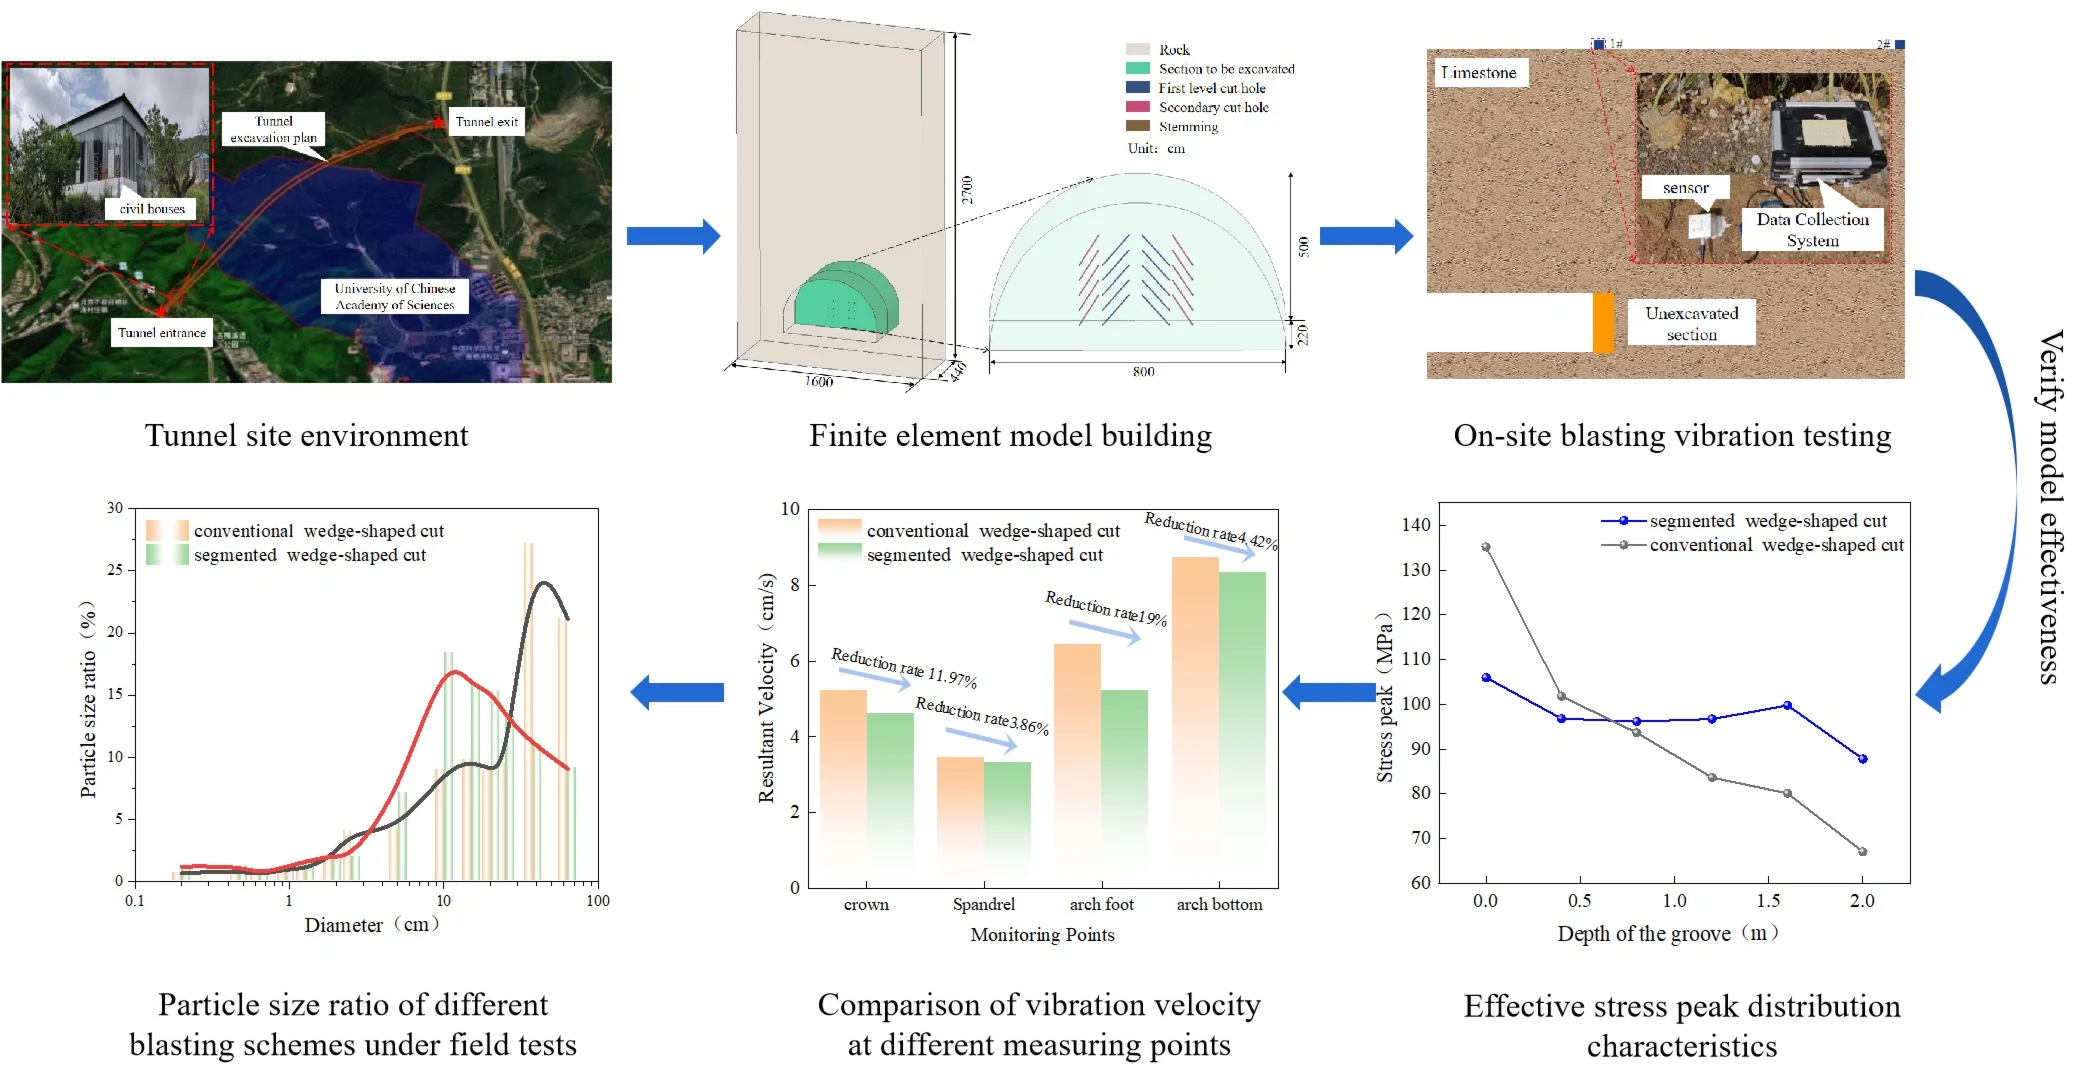
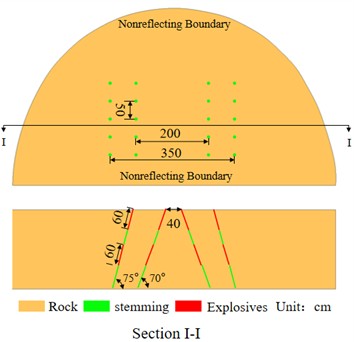
The geographical location of the tunnel and the schematic diagram of the surrounding environment are shown in Fig. 1. The Camel Mountain Tunnel is located on the west side of the G111 National Highway, south of Hefangkou Village, Huaibei Town, Huairou District. The planned elevation of the tunnel ranges from 102.1 to 116.4 meters, with a total length of 1,840 meters. The strata primarily consist of strongly to moderately weathered materials, with no significant geological structures, such as weak zones. The surrounding rock of the tunnel is classified as Class IV. The construction plan employs the sequential excavation method. Given the poor quality of the surrounding rock, the advance per cycle is controlled at approximately 2.0 meters, with a blasthole diameter of 42 mm, a charge roll diameter of 32 mm, and cut holes arranged in a compound wedge configuration. The first-level wedge-shaped cut holes are inclined at 70° relative to the tunnel face, while the second-level wedge-shaped cut holes are inclined at 75°. The cut holes utilize a continuous coupling charging method, with a maximum single-stage detonating charge of 13 kg. Additionally, the nearest residential building is located just 20 meters above the tunnel entrance, requiring strict control over blasting vibration velocity during drilling and blasting operations.
Two prominent issues are identified in the original blasting design. First, the peak vibration velocity in the cut blasting area is excessively high, approaching the maximum safety threshold of 1.5 cm·s-1 specified for residential buildings, presenting a significant safety risk. Second, the average cycle advance is only 1.6 meters, with a blasthole utilization rate of about 80 %, resulting in the presence of many large fragments post-blasting. The poor blasting performance can be attributed to the following reasons: the cutting parameters are not well optimized, causing the cutting area to become the peak vibration zone in the entire blasting process, which requires strict control over the maximum charge per shot. Additionally, the charge is concentrated at the bottom of the cut holes, leaving the upper rock mass (the non-charged section) insufficiently fractured, resulting in a higher proportion of large fragments after blasting.
Fig. 1Geographical location diagram for tunnel
3. Numerical simulation study
3.1. Finite element model establishment
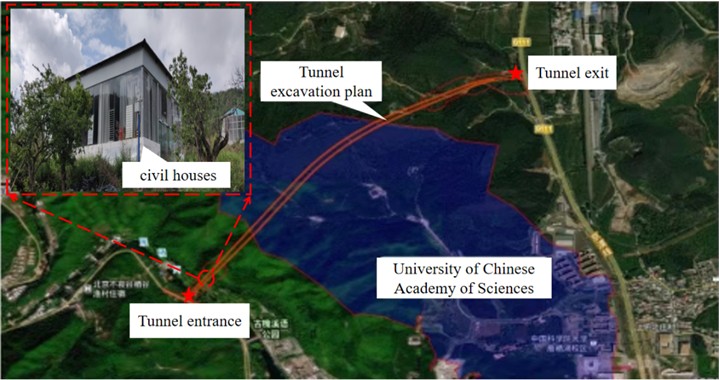
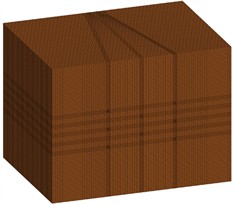
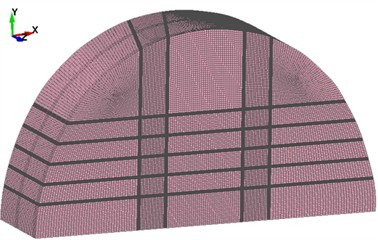
Based on the actual site conditions of the project, the overall model was established using ANSYS finite element software, as shown in Fig. 2. The model calculation uses the ALE fluid-solid coupling algorithm, which consists of two parts: the solid domain (rock) and the fluid domain (air, explosives, and stemming materials). The Lagrangian algorithm is applied to the solid domain, while the Euler algorithm is used for the fluid domain. The coupling between the solid and fluid domains is achieved using the keyword *CONSTRAINED_LAGRANGE_IN_SOLID. Additionally, to prevent boundary reflection conditions from adversely affecting the numerical accuracy of the simulation results, a non-reflecting boundary is set around the tunnel model using the keyword *BOUNDARY_NON_REFLECTING. The model uses the 3D SOLID 164 element type. The overall model is divided using mapped meshing, and the mesh around the blasthole is refined.
Fig. 2Schematic diagram of the numerical model
3.2. Constitutive model and material parameters
3.2.1. Rock material
LS-DYNA software offers several established constitutive models for simulating rock materials, including the HJC model, K&C model, CSCM model, and RHT model [24-25]. The RHT model incorporates the third invariant of the deviator stress tensor and introduces three pressure-dependent limit surfaces, building upon the HJC model. It employs the elastic limit surface, failure surface, and residual strength surface to characterize the evolution of the material's initial yield strength and failure strength. The RHT model effectively simulates the dynamic response and damage distribution of rock subjected to explosive loads. It offers advantages in modeling rock destruction under blasting conditions and is widely utilized in various engineering blasting simulations [26-27].
Elastic Limit Surface equation: The equivalent stress of the elastic limit surface for the original material is derived from the equivalent stress of the failure surface, as indicated by Eqs. (1) and (2):
where: Felastic denotes the elastic scaling coefficient, Fcap represents the “capping” function, and Ps,el=Ps/Felastic denotes the quasi-static elastic limit pressure:
where: g*c and g*t are parameters of the compressive yield surface; fc and ft represent the uniaxial compressive and tensile elastic limit stresses, respectively.
Linear Hardening Segment equation: The linear hardening elastic limit lies between the initial elastic limit surface and the final failure surface. When the equivalent stress remains below this linear hardening elastic limit, the material undergoes elastic deformation. Once this limit is exceeded, plastic deformation initiates, leading to the accumulation of plastic strain:
where: G represents the shear modulus, εp denotes the cumulative plastic equivalent strain during the linear hardening phase, and ξ is the shear modulus reduction coefficient.
Failure Surface equation: The failure surface stress σf under quasi-static loading can be determined through triaxial testing. However, the calculation model for failure surface stress incorporates both quasi-static and dynamic loading conditions. The stress intensity under dynamic loading is derived from its quasi-static counterpart, as shown in Eq. (4):
where: σ*T(Ps) is the equivalent stress strength of the quasi-static failure surface compression meridian; R3(θ) is the Rhodes angle factor; Frate(˙ε) is the strain rate dynamic enhancement factor; Ps is the quasi-static pressure.
The specific parameters of RHT are shown in Table 1.
Table 1RHT model parameters of an undisturbed Limestone rock mass
Parameter | Value | Parameter | Value |
Mass density R0 | 2700 kg/m3 | Reference compressive strain rate E0C | 3.0×10⁻⁶ |
Elastic shear modulus SHEAR | 17.5 GPa | Reference tensile strain rate E0T | 3.0×10⁻⁵ |
Eroding plastic strain EPSF | 2.0 | Break tensile strain rate ET | 3.0×1025 |
Parameter for polynomial EOSB0 | 1.22 | Break compressive strain rate EC | 3.0×1025 |
Parameter for polynomial EOSB1 | 1.22 | Compressive strain rate-dependence exponent BETAC | 0.025 |
Parameter for polynomial EOST1 | 46.17GPa | Tensile strain rate dependence exponent BETAT | 0.045 |
Parameter for polynomial EOST2 | 0 | Pressure influence on plastic flow in tension PTF | 0.001 |
Failure surface parameter A | 2.50 | Compressive yield surface parameter GC* | 0.85 |
Failure surface parameter N | 0.85 | Tensile yield surface parameter GT* | 0.4 |
Compressive strength Fc | 150 MPa | Shear modulus reduction factor XI | 0.25 |
Relative shear strength FS* | 0.07 | Damage parameter D1 | 0.025 |
Relative tensile strength FT* | 0.05 | Damage parameter D2 | 1.0 |
Lode angle dependence factor Q0 | 0.72 | Minimum damaged residual strain EPMP | 0.01 |
Lode angle dependence factor B | 0.01 | Residual surface parameter AF | 2.5 |
Hugoniot polynomial coefficient A1 | 43.87 GPa | Residual surface parameter AN | 0.85 |
Hugoniot polynomial coefficient A2 | 49.40 GPa | Grunnisen gamma GAMMA | 0 |
Hugoniot polynomial coefficient A3 | 11.62 GPa | Crush pressure PEL | 113 MPa |
Compaction pressure PCO | 6 GPa | Porosity exponent N | 3 |
Initial porosity ALPHA | 1.0 |
3.2.2. Explosive materials
The explosive model is represented by *MAT_HIGH_EXPLOSIVE_BURN, which includes several parameters such as explosive density, detonation velocity and detonation pressure. At the same time, the Jones-Wilkins-Lee (JWL) state equation is used to calculate the expansion pressure and volume change of the detonation products. The JWL state equation is shown in Eq. (5):
where: P is the pressure of detonation products; A, B, R1, R2, ω are all material parameters; E0 is the initial internal energy; V is the volume.
The explosive and state equation parameters are shown in Table 2.
Table 2Parameters of explosive
Density (kg/m3) | Detonation velocity (m/s) | A(GPa) | B(GPa) | R1 | R2 | ω | E0 (Gpa) |
1100 | 3400 | 214.4 | 0.182 | 4.2 | 0.9 | 0.15 | 4.192 |
3.2.3. Air material
The air model is defined using the *MAT_NULL keyword. This model material allows the state equation to be considered without calculating the deviatoric stress. Its state equation (*EOS_LINEAR_POLYNOMIAL) is represented by a linear polynomial Eq. (6):
where: C0-C6 are the coefficients of each polynomial, μ is the volume ratio, V0 is the relative volume, and E is the ratio of internal energy to initial volume.
The state equation describes the relationship between pressure and volumetric strain to ensure the accuracy of the simulation. The air parameters are shown in Table 3.
Table 3Parameters of air
Density (kg/m3) | C0 | C1 | C2 | C3 | C4 | C5 | C6 | V0 | E (J/m3) |
1.25 | 0 | 0 | 0 | 0 | 0.4 | 0.4 | 0 | 1 | 2.5*10-6 |
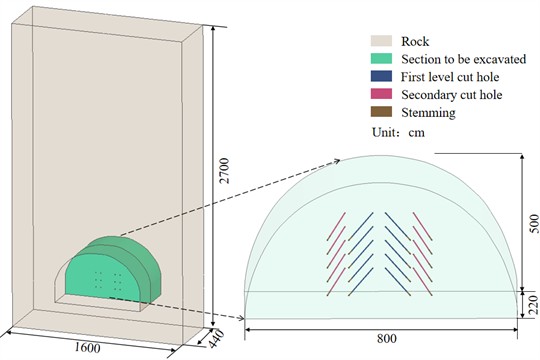
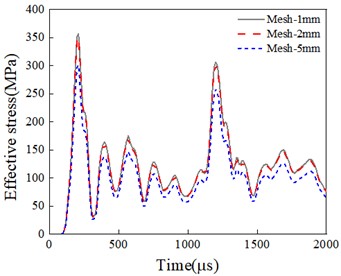
3.3. Grid independence verification
Previous studies [28-29] have indicated that the accuracy and reliability of simulation results are significantly influenced by the grid unit size. Consequently, evaluating grid accuracy prior to formal calculations is essential. Given the large scale of the model, the numerical model is meshed using three grid sizes: 10 cm, 5 cm, and 1 cm, as shown in Fig. 3(a). The peak stress at a fixed position within the unit is used as the evaluation criterion for the simulation results. The results indicate that varying grid sizes significantly affect the numerical calculation outcomes. The effective stress peak for the numerical model with a 10 cm grid size is 8.6 % lower than that for the 5 cm grid size, whereas the stress peak for the 1 cm grid size is 2.1 % higher than that for the 5 cm grid size. Considering both calculation accuracy and computational cost, the 5 cm grid size is chosen to discretize the model.
3.4. Model validity verification
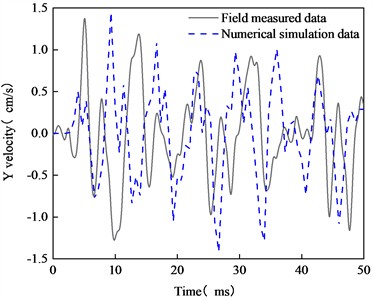
Fig. 4 is a schematic diagram of the arrangement of vibration monitoring points directly above the tunnel excavation section. The vibration data acquisition equipment used is the TC-4850, which has a sampling frequency range of 5 to 300 Hz, a measurement range from 0.001 to 35 cm/s, and a measurement accuracy of 0.01 cm/s. Fig. 5 presents a comparison of vibration waveforms between field measurements and numerical simulation results. The comparison reveals that the peak vibration velocity and its occurrence time obtained from field measurements closely align with those from numerical simulations. The peak vibration velocity from the numerical simulation is 1.45 cm/s, compared to 1.38 cm/s from field measurements, resulting in a relative error of 4.83 %. The slightly lower actual monitoring vibration data is attributed to the assumption of a homogeneous rock mass in the numerical simulation. The presence of joints and fissures in the actual rock layer causes refraction and reflection of the blasting vibration waves, leading to attenuation. The comparison with field data confirms the reliability of the model.
Fig. 3Effective stress time history diagram for different mesh sizes
a) Numerical models with different mesh sizes
b) Effective stress time history curve
Fig. 4On-site monitoring diagram
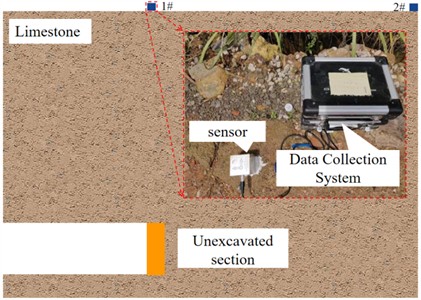
Fig. 5Comparison of on-site and numerical simulation vibration velocity
4. Optimization of cutting scheme and numerical calculation results
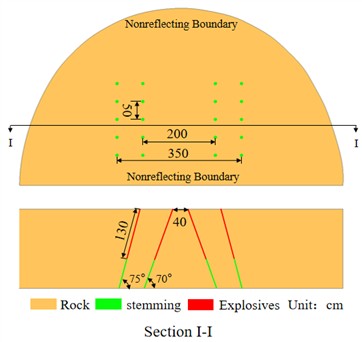
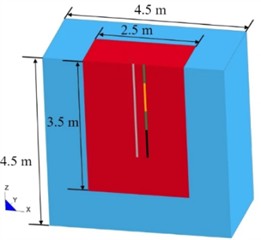
To address the shortcomings of the original cut blasting scheme, an improved scheme is proposed, as illustrated in Fig. 6(b), with the original scheme depicted in Fig. 6(a). The finite element models for both scenarios have identical dimensions: 800 cm in length, 220 cm in width, and 500 cm in height. The first-level cut holes consist of 10 blast holes arranged symmetrically at an angle of 70°, with a bottom distance of 40 cm, a mouth distance of 200 cm, and a row spacing of 50 cm. The second-level cut holes consist of 10 blast holes arranged symmetrically at an angle of 75°, with a bottom distance of 230 cm, a mouth distance of 350 cm, and a row spacing of 50 cm. The primary differences between the two finite element models are the charge structure and the delay in detonation time. For conventional wedge cut blasting, the charge configuration involves a continuous coupled charge with a 130 cm long charge roll, and the detonation delay between the first and second cut holes is set to 1 ms. For segmented wedge-shaped cut blasting, the charge structure is divided into upper and lower sections. The upper charge length is 60 cm, as is the length of the lower charge section. The delay time for the explosives is controlled using the keyword *INITIAL_DETONATION, with a delay of 1 ms for both sections of the charge.
Fig. 6Schematic diagram of improved charging scheme
a) Conventional compound wedge-shaped cut
b) Segmented compound wedge-shaped cut
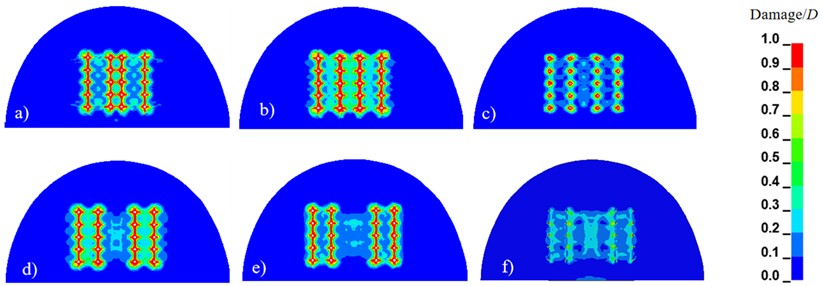
4.1. Damage analysis
Fig. 7 and 8 illustrate the damage within the cut cavity resulting from two different cutting blasting methods. The cut cavity is divided along the Z-direction (tunnel excavation direction), where Z = 0 m corresponds to the bottom of the hole and Z = 2 m corresponds to the mouth of the hole. According to existing theoretical analyses, the crushing zone within the blasting damage range typically extends from 2 to 5 times the charge radius, while the crack zone extends from 10 to 15 times the charge radius [30-31]. Referring to the damage scale D, the red areas in the damage cloud map represent the crushing zone, while the green areas indicate the crack zone, thereby validating the effectiveness and appropriateness of the selected numerical simulation parameters. In the case of the conventional wedge-shaped cut, the rocks in the cut area shown in Fig. 7(a) to 7(d) are effectively crushed. In contrast, in Fig. 7(e) to 7(f), the degree of rock damage in the cut range from Z = 1.6 m to 2.0 m decreases sharply, indicating that the rock in this region tends to produce large fragments, which adversely affects the overall crushing efficiency. In contrast, the extent of rock damage in the segmented wedge cuts, as shown in Fig. 8(e) to 8(f), is significantly greater than that observed in the conventional wedge cuts. Based on the previous discussion, the relatively low stress intensity in the conventional wedge-shaped cutting method results in inadequate fragmentation of the upper rock mass. In contrast, the relatively high stress intensity in the segmented wedge-shaped cutting method causes the rock mass at the initial detonation point to be completely fragmented into small blocks, thus forming a cavity. Subsequently, the rock mass at the bottom of the cut cavity is easily destroyed and completely removed, resulting in a cutting cavity that reaches the required depth.
If the rock mass in the blocked section of the borehole is not sufficiently fractured, the formation of the cavity will be restricted. Typically, in a wedge-shaped cut, blasting should fracture the rock mass to create a continuous cavity or notch, allowing subsequent operations, such as additional blasting, excavation, or support, to proceed smoothly. When the rock mass in the tunnel entrance area is inadequately fractured, the cracks and fractured zones generated by blasting fail to propagate effectively, resulting in an irregular or incomplete cavity, which severely hinders the subsequent tunnel construction.
Fig. 7Damage cloud diagram of conventional compound wedge-shaped cut blasting: a) Z = 0 m; b) Z = 0.4 m; c) Z = 0.8 m; d) Z = 1.2 m; e) Z = 1.6 m; f) Z = 2.0 m
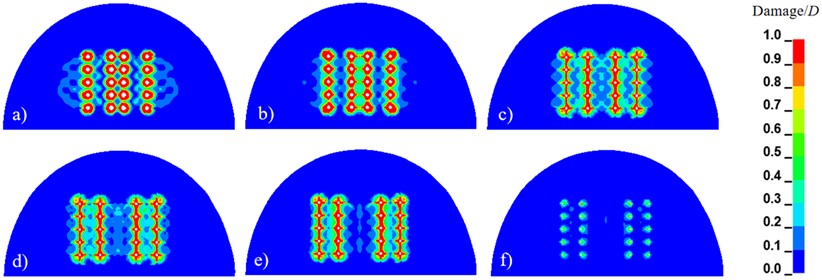
Fig. 8Damage cloud diagram of segmented wedge-shaped cut blasting: a) Z = 0 m; b) Z = 0.4 m; c) Z = 0.8 m; d) Z = 1.2 m; e) Z = 1.6 m; f) Z = 2.0 m
4.2. Effective stress distribution characteristics
Utilize LS-PREPOST to examine the post-processing results of the solved numerical model, where the effective stress value progressively transitions from red to blue. Fig. 9 illustrates the propagation process of the effective stress distribution in the segmented wedge-shaped cut. At t= 169 μs, the detonation reaction in the segmented wedge-shaped cutout initiates from the upper charge, with detonation occurring at the bottom of the hole. The generated energy immediately propagates a stress wave through the rock mass, radiating outward in the form of a cylindrical wavefront. As the explosion progresses, the stress wave continues to propagate along the tunnel face. Concurrently, at t = 289 μs, the stress waves generated between different cut holes overlap. At t = 679 μs, the reflected tensile wave generated by the wavefront reaching the tunnel face intersects with the stress wave, causing significant stress concentration at the tunnel face. The non-reflective boundaries implemented around the tunnel numerical model represent real-world engineering conditions, ensuring the accuracy of the numerical simulation results. At t = 1089 μs, the bottom charge begins detonation, following the hole bottom detonation method. At t = 1389 μs, the intersection of stress waves intensifies the degree of rock crushing between the cut holes. At t = 1739 μs, the stress waves from the bottom and upper explosives converge at the tunnel face. The effective stress value at the tunnel face increases significantly, ensuring effective rock crushing at the hole mouth.
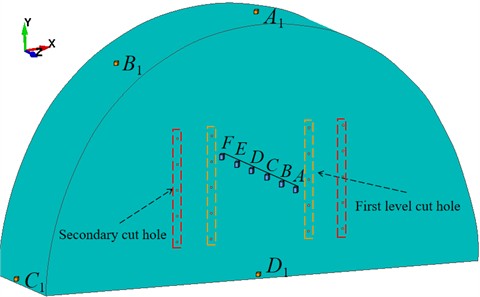
To investigate the effective stress distribution of segmented wedge cut blasting versus conventional wedge cut blasting, and to assess the vibration of the tunnel surrounding rock, monitoring points for effective stress and peak vibration velocity are positioned as depicted in Fig. 10. Points A through F represent effective stress monitoring locations, while vibration velocity monitoring points A1, B1, C1, and D1 are positioned at the crown, spandrel, arch foot, and the midpoint of the arch bottom of the excavation face, respectively.
Fig. 9Cloud diagram of effective stress propagation in segmented wedge-shaped cut blasting
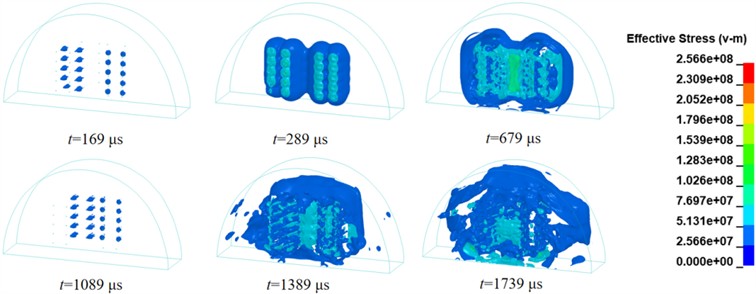
Fig. 10Schematic diagram of effective stress and peak vibration velocity measurement points
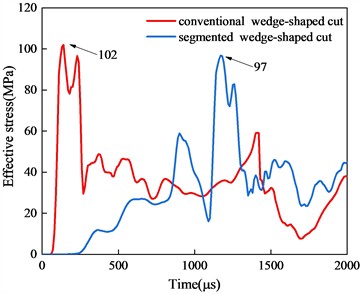
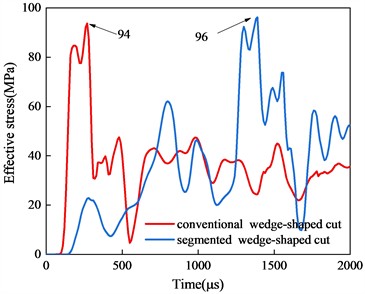
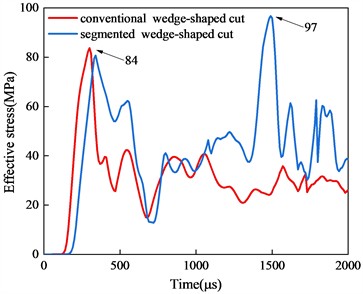
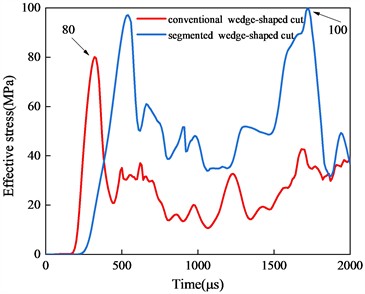
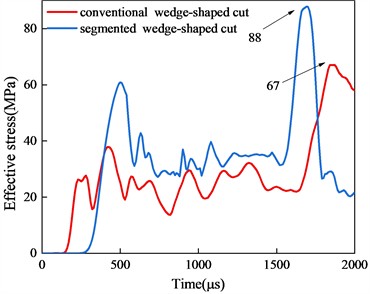
To further elucidate the stress distribution characteristics within the entire cut cavity, stress-time history curves for various depths are plotted, as shown in Fig. 11. In the conventional wedge cut model, the maximum peak stress occurs at Z= 0 m, i.e., at the bottom of the hole, reaching 135 MPa. Due to the maximum explosive charge, the segmented wedge cut model achieves a maximum peak stress of 116 MPa at the bottom of the hole. As the measurement point progresses toward the tunnel face, the inter-hole stress of the conventional wedge cut gradually decreases to 102 MPa atZ = 0.4 m, slightly higher than that of the segmented wedge cut. At Z = 0.8 m, the inter-hole stress of the conventional wedge cut continues to decrease, while that of the segmented wedge cut remains nearly constant. Additionally, the stress distribution of the segmented wedge cut exhibits two distinct peaks over time, positively contributing to rock crushing and ejection within the cut cavity. Within the cut cavity from Z = 1.2 m to Z = 2.0 m, the segmented wedge cut maintained two distinct stress peaks with minimal fluctuations, whereas the conventional wedge cut displayed only one prominent peak throughout the detonation process, with values continuously decreasing. It can be anticipated that the segmented wedge cut method can create new free surfaces in a timely manner, reducing the clamping effect of rock blasting within the hole. Simultaneously, the delayed detonation method effectively expels the gravel from the hole, achieving an efficient cut blasting result.
The primary advantage of the segmented charging method lies in its ability to release energy in stages, progressively forming a more uniform stress field. The conventional wedge-shaped cut charging method typically involves a single explosion, with the blast-induced stress concentrated at the bottom of the hole, resulting in a rapid decay of stress near the tunnel entrance. In contrast, segmented charging combines delayed blasting with staged energy release, gradually releasing energy at different depths, leading to a more uniform stress distribution throughout the blasting process. Another key feature of segmented charging is delayed blasting, which effectively delays the release of stress waves to different time points, ensuring a more uniform stress distribution on the rock mass within the cavity.
Fig. 11Comparison of stress time history curves at typical measurement points
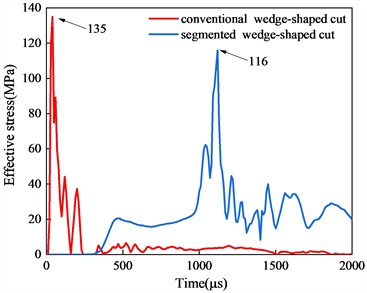
a)Z = 0 m
b)Z = 0.4 m
c)Z= 0.8 m
d)Z = 1.2 m
e)Z = 1.6 m
f)Z = 2.0 m
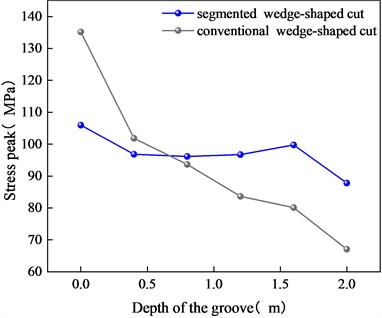
To further investigate the stress distribution trend within the cut cavity of the two wedge-shaped cutting methods, stress peak values at each section are plotted in a stress trend diagram, as shown in Fig. 12. In the conventional wedge-shaped cutting method, as the stress peak values decrease from the bottom of the hole to the hole mouth, excessive rock crushing at the bottom and the formation of large fragments at the hole mouth are likely to occur. The presence of large fragments impedes the ejection of rock from the bottom of the hole, thereby impacting the blasting effectiveness of the entire section. In contrast, the stress distribution in the segmented wedge-shaped cutting method is relatively uniform throughout the cut cavity, maintaining approximately 100 MPa, which is crucial for achieving uniform rock crushing within the cavity. Additionally, as the upper charge is detonated first, it timely creates a free surface, facilitating the ejection of bottom rock fragments, forming an ideal cutting cavity, and providing ample space for the blasting of subsequent blastholes.
Fig. 12Variation of peak stress at typical measurement points with groove depth
4.3. Surrounding rock velocity analysis
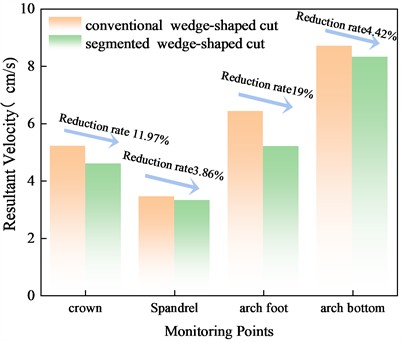
Peak vibration velocity effectively reflects the damage to the surrounding rock [32-33]. Fig. 13 illustrates the time history curves of vibration velocity for each monitoring point under different cut blasting methods. At the arch top position, the peak vibration velocity of 5.22 cm·s-1 was recorded at t= 630 μs for conventional cut blasting, while segmented cut blasting produced two velocity peaks at t = 940 μs andt = 1780 μs. Considering the combined velocity peaks at each measurement point, the arch bottom point D, being closest to the cut blasting area, recorded the first blasting vibration velocity and exhibited the highest peak value of 8.11 cm·s-1. Segmented wedge cut blasting tends to generate two or more peaks, but these peaks are lower in value compared to the velocity peak from conventional wedge cut blasting. This is attributed to the maximum explosive charge per section and the detonation delay. Overall, segmented cut blasting offers advantages in controlling the maximum safe vibration velocity.
Fig. 14 illustrates a comparison of the combined vibration velocity at each monitoring point for the two cutting blasting methods. As can be seen from Fig. 14, the combined vibration velocity at the arch bottom monitoring point is the highest, with the segmented wedge-shaped cutting being 4.42 % lower than the conventional wedge-shaped cutting. The combined vibration velocities at the arch foot, arch top, and arch shoulder monitoring points are 19 %, 11.97 %, and 3.86 % lower than those from the conventional wedge-shaped cutting, respectively. The combined vibration velocities at the four monitoring points are all lower than those observed with conventional cutting blasting, indicating that the segmented wedge-shaped cutting blasting method effectively reduces the impact on the surrounding tunnel rock.
Segmented charging utilizes delayed blasting and a gradual release of energy, whereas conventional wedge-shaped cut blasting typically releases all explosive energy in a single burst, resulting in intense blasting vibrations. This concentrated energy release generates a high peak vibration velocity instantaneously. In contrast, segmented charging uses staged detonation to distribute the total energy across multiple time points. As a result, the energy release at each point is smaller, leading to smoother and more controlled vibrations. Moreover, segmented charging releases energy at different intervals, creating new free faces as needed. This mitigates the confinement effect, ensures a more uniform stress distribution within the rock mass, reduces the likelihood of surrounding rock instability due to vibrations, and contributes to maintaining the overall stability of the surrounding rock.
Fig. 13Vibration velocity time history curve of monitoring point
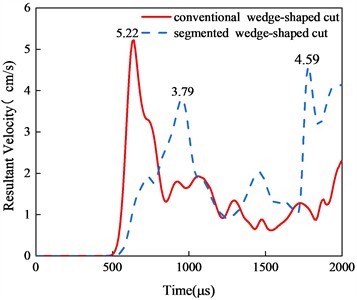
a) Crowm
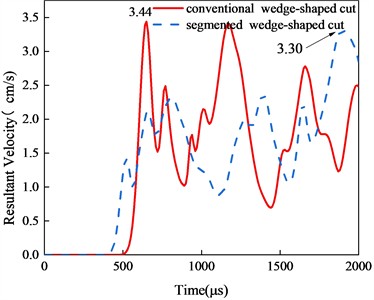
b) Spandrel
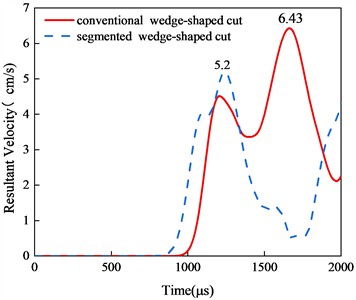
c) Arch foot
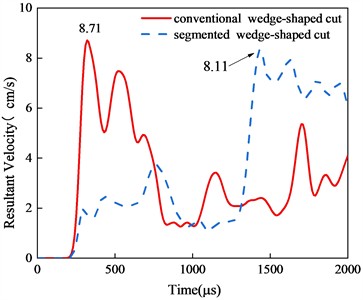
d) Arch bottom
Fig. 14Comparison of peak vibration velocity of different trenching schemes
5. Field test research
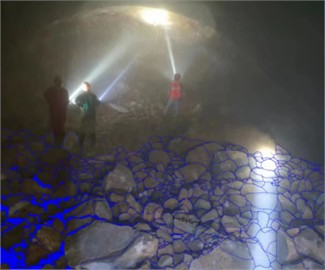
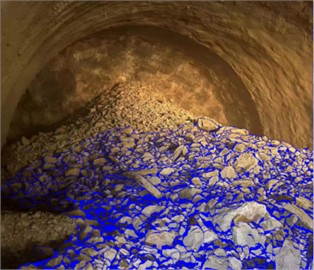
To compare and analyze the application of the segmented wedge-shaped cut model in actual tunnel construction, the on-site blasting design was modified, with the blasthole diameter in the field test set at 42 mm. Fig. 15(a) shows the post-blasting effect before the optimization of the blasting scheme, with uneven rock block sizes, most of which are large. Combining the numerical simulation results, it is evident that the effective stress from the blocked section to the tunnel face in the conventional wedge-shaped cut is lower than the rock crushing strength, resulting in ineffective crushing of the blocked section rock and difficulty in ejecting it from the tunnel face. Furthermore, the lack of a free surface and compensation space for subsequent auxiliary hole blasting results in suboptimal blasting effects across the entire tunnel section, with a low blasthole utilization rate, ultimately delaying construction progress. Fig. 15(b) shows the post-blasting effect after optimizing the cutting scheme, with no large blocks and uniformly sized rock fragments. Based on the rock internal damage analysis results presented in Section 4.1, the entire cut cavity in the segmented wedge-shaped cut is extensively fractured and interconnected. The favorable blasting effect in the cut area enhances the conditions for subsequent auxiliary hole blasting.
Fig. 15Schematic diagram of blasting comparison before and after blasting scheme optimization
a) Blasting effect before scheme optimization
b) Blasting effect after scheme optimization
Split-Desk 4.0 software was used to analyze the distribution of blast pile fragmentation. Fragmentation analysis was conducted on representative blast pile patterns corresponding to various cutting schemes, and the results are shown in Fig. 16. Fig. 16 shows that in the conventional wedge-shaped cutting scheme, the distribution of crushed stone particle sizes is primarily concentrated between 10 cm and 63 cm, with 48.31 % of the crushed stone particles being larger than 38 cm. In the segmented wedge-shaped cutting scheme, the particle size range of crushed stone spans from 5 cm to 25 cm, accounting for 69.74 %, with only 20.16 % of the crushed stone exceeding 38 cm in size. This effectively reduces the occurrence of large blocks after blasting.
Fig. 16Rock particle size ratio after blasting in different cutting schemes
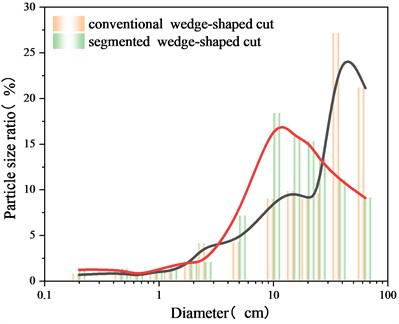
Table 4 presents a comparison of the main parameters and technical and economic indicators before and after the optimization of the tunnel blasting scheme. The tunnel is designed to advance 2.0 meters per cycle. The table indicates that the segmented wedge-shaped cut effectively enhances the blasthole utilization rate and blasting footage while reducing the charge amount in the cut hole, and it effectively controls the generation of large blocks.
Table 4Main blasting parameters and technical and economic indicators of the schemes before and after optimization
Scheme | Charge amount (Kg) | Average blasting footage (m) | Blast hole utilization (%) | Explosive consumption per cycle (Kg) | Large block rate (%) |
Segmented cutting | 24 | 1.9 | 95 | 84 | 20.16 % |
Conventional cutting | 26 | 1.6 | 80 | 86 | 48.31 % |
6. Discussions
Fig. 17 presents the numerical models for cut blasting developed in recent years. CHENG et al. [19] proposed a wedge-shaped cut blasting method involving delayed in-hole excavation and developed a cubic finite element mesh model using ANSYS. GAO et al. [22] developed a cubic finite element mesh model for a 6-hole wedge-shaped cut and examined the impact of different delay times on vibration velocity. Although the cubic model is useful for preliminary research, its application is limited, making it difficult to address complex engineering challenges. Furthermore, the finite element mesh method (FEM) is susceptible to large deformations and premature termination of calculations when applied to explosive problems, underscoring the importance of selecting an appropriate mesh size. The smoothed particle hydrodynamics (SPH) method offers distinct advantages in addressing problems involving material fragmentation, large deformations, and particle motion. However, the pure SPH method comes with significant computational costs. Reference [34] employs the FEM-SPH method, effectively combining the strengths of both techniques. This hybrid approach represents an advanced numerical simulation methodology.
Fig. 17Common numerical modeling methods for cut blasting
a) FEM model [19]
b) FEM model [22]
c) FEM-SPH model [34]
d) FEM model (Ours)
The novelty of this paper lies in utilizing real tunnel sections as the basis for numerical simulation modeling. Unlike previous models, the boundary conditions in the real tunnel section model match those of the actual engineering site, allowing for a more accurate representation of stress wave propagation during cut blasting. Additionally, the cut area experiences the highest intensity of blasting vibrations throughout the entire tunnel section. The tunnel numerical model, based on real tunnel sections, accounts for the peak vibration velocity induced by cut blasting in different parts of the tunnel, providing valuable insights for engineering construction.
While the FEM method can efficiently capture the mechanical response of the overall model under blasting load at a low computational cost, the FEM-SPH coupled numerical method should be employed for high-precision analysis of large deformations in the rock mass of the cutout area. Additionally, real tunnel construction sites often feature well-developed joints, fissures, and heterogeneous geological conditions. Future research should address the heterogeneity of the rock mass, including layered structures, and the impact of joints and fissures on blasting effects in numerical simulations.
7. Conclusions
This study examines the effects of Conventional wedge cutting and segmented wedge cutting methods in tunnel blasting through a comparative analysis of numerical simulations and field tests. The simulation results demonstrate that the optimized segmented wedge cutting method provides substantial benefits in terms of damage extent, effective stress distribution, and vibration velocity in the surrounding rock, emphasizing the shortcomings of the Conventional method. Additionally, the alignment between actual blasting outcomes and numerical simulations further supports the conclusion that the optimized method can significantly improve tunnel blasting efficiency while minimizing the impact on surrounding rock. By integrating numerical simulations with field test data, the following conclusions are drawn:
1) The numerical simulation results, based on the ANSYS-LSDYNA fluid-solid coupling algorithm, align well with the on-site blasting vibration test results. This validates the rationality and effectiveness of the numerical model, demonstrating that this approach can effectively address cut blasting challenges in practical engineering.
2) The damage cloud map shows that the numerical simulation results clearly illustrate the blasting process for two distinct cutting methods. The damage extent in the stemming section of the conventional compound wedge-shaped cutting is notably lower than that of the segmented wedge-shaped cutting. This is mainly due to the significantly lower effective stress in the stemming section compared to the dynamic failure strength of the rock mass. In the improved charging method, the effective stress is uniformly distributed throughout the entire cut cavity, ensuring more uniform fragmentation of the rock mass.
3) Monitoring the blasting vibration velocities for the two cutting and charging schemes showed that the maximum vibration peak occurred at the arch bottom, with the greatest reduction in vibration velocity observed at the arch foot (19 %) and a reduction of 11.97 % at the arch top. The improved cutting and charging blasting scheme met the minimum safe vibration velocity requirements for the surrounding structures.
4) The geological conditions of the actual tunnel are complex. The blasting plan should be formulated based on comprehensive on-site vibration monitoring data and blasting effect evaluations, with the charging plan adjusted promptly in response to changes in tunnel conditions, aiming to optimize blasting efficiency while minimizing vibration intensity.
References
-
Y. Zhang, Y. Zhang, Z. Song, and H. Pan, “A LFPP-FAHP based evaluation model of blasting scheme for tunnel undercrossing existing buildings,” Tunnelling and Underground Space Technology, Vol. 153, p. 105937, Nov. 2024, https://doi.org/10.1016/j.tust.2024.105937
-
Y. Li, Z. Wang, Q. Luo, and T. Wu, “Stability analysis of civil air defense tunnel under blasting vibration,” Journal of Vibroengineering, Vol. 26, No. 4, pp. 892–903, Jun. 2024, https://doi.org/10.21595/jve.2024.23892
-
B. Zhao, N. Jiang, C. Zhou, Y. Yao, W. Zhou, and Z. Cai, “Safety assessment for a ballast railway induced by underground subway tunnel blasting: A case study,” International Journal of Protective Structures, Vol. 15, No. 1, pp. 166–191, Jan. 2023, https://doi.org/10.1177/20414196221150661
-
M. Cardu and J. Seccatore, “Quantifying the difficulty of tunnelling by drilling and blasting,” Tunnelling and Underground Space Technology, Vol. 60, pp. 178–182, Nov. 2016, https://doi.org/10.1016/j.tust.2016.08.010
-
R. Zhang, “Experiment study on rock breaking mechanisms of two-step cutting technology in rock roadways,” (in Chinese), Chinese Journal of Rock Mechanics and Engineering, Vol. 39, No. 1, pp. 93–104, 2020.
-
J. Ding, J. Yang, Z. Ye, Z. Leng, C. Yao, and C. Zhou, “Cut-blasting method selection and parameter optimization for rock masses under high in situ stress,” International Journal of Geomechanics, Vol. 23, No. 12, p. 04023, Dec. 2023, https://doi.org/10.1061/ijgnai.gmeng-8802
-
P. D. Katsabanis, “Analysis of the effects of blasting on comminution using experimental results and numerical modelling,” Rock Mechanics and Rock Engineering, Vol. 53, No. 7, pp. 3093–3109, Apr. 2020, https://doi.org/10.1007/s00603-020-02093-4
-
B. Cheng et al., “A study on cut blasting with large diameter charges in hard rock roadways,” Advances in Civil Engineering, Vol. 2020, No. 1, p. 88734, Sep. 2020, https://doi.org/10.1155/2020/8873412
-
P. Gao, Q. Zong, B. Cheng, H. Wang, Y. Xu, and B. Zhang, “Investigation on cutting blasting efficiency of hard rock tunnels under different charge diameters,” Applied Sciences, Vol. 12, No. 19, p. 9906, Oct. 2022, https://doi.org/10.3390/app12199906
-
Z. Wang, X. Gu, W. Zhang, Q. Xie, X. Xu, and Q. Wang, “Analysis of the cavity formation mechanism of wedge cut blasting in hard rock,” Shock and Vibration, Vol. 2019, No. 1, p. 18283, May 2019, https://doi.org/10.1155/2019/1828313
-
D. Yang, X. Wang, Y. Wang, H. An, and Z. Lei, “Experiment and analysis of wedge cutting angle on cutting effect,” Advances in Civil Engineering, Vol. 2020, No. 1, p. 51267, May 2020, https://doi.org/10.1155/2020/5126790
-
H. Zhang, T. Li, Y. Du, Q. Zhu, and X. Zhang, “Theoretical and numerical investigation of deep-hole cut blasting based on cavity cutting and fragment throwing,” Tunnelling and Underground Space Technology, Vol. 111, p. 103854, May 2021, https://doi.org/10.1016/j.tust.2021.103854
-
P. Kumar, H. Mohammadi, R. Chopra, S. Kumar Tyagi, and S. Kumar Pandey, “A newly developed blasting cut in tunnels; application of “combined method” in small to medium-sized tunnels,” Tunnelling and Underground Space Technology, Vol. 142, p. 105426, Dec. 2023, https://doi.org/10.1016/j.tust.2023.105426
-
Y. Wang, W. Kong, G. Wang, P. Xie, Z. Peng, and W. Zhang, “Mechanism of rock breaking by deep hole ultra-deep cut blasting and the optimum ultra-deep value determination,” (in Chinese), Journal of Mining and Safety Engineering, Vol. 40, No. 6, pp. 1210–1218, 2023.
-
X. Li, Q. Li, J. Wang, Z. Wang, H. Wang, and Z. Tao, “Influence of hole arrangement on the section of cavity formed by cutting blast,” Geofluids, Vol. 2021, pp. 1–12, Nov. 2021, https://doi.org/10.1155/2021/9080560
-
S. Song, R. Huo, Y. Liang, Z. Miao, J. Jie, and Z. Song, “Numerical simulation and application research of straight-hole cut blasting with empty holes in railway tunnels,” International Journal of Geomechanics, Vol. 24, No. 4, p. 04024, Apr. 2024, https://doi.org/10.1061/ijgnai.gmeng-9183
-
B. Sun, Z. Zhang, J. Meng, Y. Huang, H. Li, and J. Wang, “Research on deep-hole cutting blasting efficiency in blind shafting with high in-situ stress environment using the method of SPH,” Mathematics, Vol. 9, No. 24, p. 3242, Dec. 2021, https://doi.org/10.3390/math9243242
-
P. Feng, Y. Li, X. Wang, C. Feng, and Y. Zhang, “Numerical analysis on two-layer bundle-hole cut blasting with continuous-discontinuous elements,” Geotechnical and Geological Engineering, Vol. 40, No. 10, pp. 5045–5054, Jul. 2022, https://doi.org/10.1007/s10706-022-02198-3
-
B. Cheng, Q. Wang, H. Wang, Q. Zong, and P. Gao, “Research on the mechanism and application of wedge cutting blasting with hole-inner delay,” Scientific Reports, Vol. 14, No. 1, p. 11383, May 2024, https://doi.org/10.1038/s41598-024-62318-2
-
N. Kumar Bhagat, A. K. Mishra, R. K. Singh, C. Sawmliana, and P. K. Singh, “Application of logistic regression, CART and random forest techniques in prediction of blast-induced slope failure during reconstruction of railway rock-cut slopes,” Engineering Failure Analysis, Vol. 137, p. 106230, Jul. 2022, https://doi.org/10.1016/j.engfailanal.2022.106230
-
J. Zhu, H. Wei, X. Yang, and H. Chu, “Prediction of blasting vibration velocity of layered rock mass under multihole cut blasting,” Shock and Vibration, Vol. 2021, No. 1, p. 55111, Apr. 2021, https://doi.org/10.1155/2021/5511190
-
W. Gao, Z. Liu, Y. Wang, Z. Yan, and Z. Zhang, “Study on optimization of delay method of wedge cut blasting in tunnel,” Shock and Vibration, Vol. 2021, No. 1, p. 16762, Nov. 2021, https://doi.org/10.1155/2021/1676269
-
K. Xue et al., “Analysis of blasting vibration responses in the ramp section of the Beishan Underground Research Laboratory,” Tunnelling and Underground Space Technology, Vol. 153, p. 105999, Nov. 2024, https://doi.org/10.1016/j.tust.2024.105999
-
M. Kucewicz, P. Baranowski, L. Mazurkiewicz, and J. Małachowski, “Comparison of selected blasting constitutive models for reproducing the dynamic fragmentation of rock,” International Journal of Impact Engineering, Vol. 173, p. 104484, Mar. 2023, https://doi.org/10.1016/j.ijimpeng.2022.104484
-
X. Yin, Q. Li, X. Xu, B. Chen, K. Guo, and S. Xu, “Investigation of continuous surface cap model (CSCM) for numerical simulation of strain-hardening fibre-reinforced cementitious composites against low-velocity impacts,” Composite Structures, Vol. 304, p. 116424, Jan. 2023, https://doi.org/10.1016/j.compstruct.2022.116424
-
Z. Li et al., “Study on cyclic blasting failure characteristics and cumulative damage evolution law of tunnel rock mass under initial in-situ stress,” Engineering Failure Analysis, Vol. 150, p. 107310, Aug. 2023, https://doi.org/10.1016/j.engfailanal.2023.107310
-
S. Li et al., “Determination of rock mass parameters for the RHT model based on the Hoek-brown criterion,” Rock Mechanics and Rock Engineering, Vol. 56, No. 4, pp. 2861–2877, Jan. 2023, https://doi.org/10.1007/s00603-022-03189-9
-
Q. Wang, S. Liu, and H. Lou, “Calibration of numerical simulation methods for underwater explosion with centrifugal tests,” Shock and Vibration, Vol. 2019, No. 1, p. 26708, May 2019, https://doi.org/10.1155/2019/2670836
-
C. Li and H. Aoude, “Blast retrofit of shear-deficient high-strength concrete beams with ultra-high performance concrete,” Engineering Structures, Vol. 304, p. 117619, Apr. 2024, https://doi.org/10.1016/j.engstruct.2024.117619
-
Z. Leng, W. Lu, M. Chen, P. Yan, and Y. Hu, “Improved calculation model for the size of crushed zone around blasthole,” (in Chinese), Explosion and Shock Waves, Vol. 35, No. 1, pp. 101–107, Jan. 2015.
-
A. Juneja and P. Pinaki, “A numerical study on extent of crushed zone around blasthole in basalt rock,” Geotechnical and Geological Engineering, Vol. 37, No. 3, pp. 1283–1296, Aug. 2018, https://doi.org/10.1007/s10706-018-0685-6
-
J. U. Rehman, D. Park, and J.-K. Ahn, “Predicting blast-induced damage and dynamic response of drill-and-blast tunnel using three-dimensional finite element analysis,” Applied Sciences, Vol. 14, No. 14, p. 6152, Jul. 2024, https://doi.org/10.3390/app14146152
-
X. Wu, M. Gong, H. Wu, G. Hu, and S. Wang, “Vibration reduction technology and the mechanisms of surrounding rock damage from blasting in neighborhood tunnels with small clearance,” International Journal of Mining Science and Technology, Vol. 33, No. 5, pp. 625–637, May 2023, https://doi.org/10.1016/j.ijmst.2022.10.009
-
C. Li, R. Yang, Y. Wang, Y. Kang, Y. Zhang, and P. Xie, “Theoretical and numerical simulation investigation of deep hole dispersed charge cut blasting,” International Journal of Coal Science and Technology, Vol. 10, No. 1, p. 15, Mar. 2023, https://doi.org/10.1007/s40789-023-00571-y
About this article

The study was sponsored by the National Natural Science Foundation of China (Grant No. 52064025).
The datasets generated during and/or analyzed during the current study are available from the corresponding author on reasonable request.
Haoshan Liu: conceptualization, software, writing-original draft preparation. Yonghui Huang: conceptualization, project administration. Zhiyu Zhang: methodology, project administration, finding acquisition. Yongkang Song: software, validation, writing-review and editing.
The authors declare that they have no conflict of interest.
