Abstract
Due to their distinct geotechnical and structural features, soft rock tunnels pose serious issues because of their seismic sensitivity. These tunnels, often constructed in formations with lower shear strength and higher deformability, are particularly susceptible to damage during earthquakes. Fragility curves, which graphically represent the probability that a structure may sustain damage up to or beyond a particular threshold as a function of seismic intensity, are essential tools for evaluating the seismic resilience of these infrastructures. This research looks closely at the use of fragility curves to assess the seismic vulnerability of soft rock tunnels. Exploring the fundamental concepts and methodologies involved in constructing fragility curves, including seismic hazard analysis, structural modeling, damage state definition, data collection and statistical analysis is looked at first. The review highlighted the integration of soft rock characteristics such as strength and deformation properties into the fragility assessment process. Key developments in the topic are covered such as how machine learning and Bayesian inference might improve the precision and usefulness of fragility curves. The paper identified key findings such as the high sensitivity of fragility curves to geotechnical properties and seismic intensity levels and emphasized the importance of accurate data collection and model calibration. Important gaps in seismic risk evaluations are filled by integrating cutting-edge methodologies, such as Bayesian inference and real-time machine learning models that clarify the seismic behaviour of soft rock tunnels in the real world. For the purpose of strengthening earthquake-resistant infrastructure in earthquake-prone areas, engineers, scholars and policymakers are given practical insights.
Highlights
- Seismic Vulnerability of Soft Rock Tunnels. Soft rock tunnels are highly susceptible to seismic activity due to their low shear strength and high deformability. Ground motion amplification in soft rock formations increases the likelihood of tunnel deformation and damage.
- Use of Fragility Curves for Seismic Assessment. Fragility curves quantify the probability of damage at different seismic intensity levels. Developed using seismic hazard analysis and structural modeling. Bayesian inference and machine learning enhance the accuracy of fragility assessments.
- Key Factors Influencing Seismic Response. Geotechnical properties such as shear strength and stiffness impact fragility curves. Soil-structure interaction plays a crucial role in tunnel seismic behavior. Tunnel geometry and construction quality affect resilience against seismic loads
- Advancements in Seismic Risk Assessment. New statistical methods, including Bayesian updating and machine learning, improve fragility curve accuracy. Real-time seismic monitoring enables dynamic risk assessments. Copula models help analyze dependencies between multiple seismic factors.
- Engineering Applications and Risk Mitigation. They guide the design and retrofitting of tunnels for improved seismic resilience. Support performance-based seismic design to meet operational and safety objectives. Fragility assessments inform emergency planning and policy development.
1. Introduction
The functionality of soft rock tunnels is essential for infrastructure and transportation networks in seismically active areas. These tunnels provide special difficulties for their design, operation, and maintenance since they are built in geologically weak rocks that range in strength from low to medium. These tunnels are typically characterized by high deformability and lower load-bearing capacities compared to those built in hard rock or engineered soils. These characteristics make soft rock tunnels more susceptible to seismic-induced deformations and damage [1]. Designing and maintaining infrastructure in earthquake-prone areas requires an understanding of the seismic susceptibility of such tunnels. As a result of its geological and geotechnical characteristics, soft rock tunnels are especially vulnerable to seismic disturbances. Key characteristics include:
A. Soft rocks, such as siltstones, clay shales and weak sandstones are quickly weathered, have a high deformability and low shear strength. These characteristics set them apart from more durable rock formations after they are developed and significantly impact how well they function under seismic pressures. Under seismic stress, it causes more deformation [2].
B. Generally speaking, soft rock formations are more capable of reducing ground motion during an earthquake than hard rock due to their reduced rigidity. This amplification raises the likelihood of deformation and damage to tunnel structures [3].
Fig. 1Diagram illustrating the red-bed soft rock and its properties in multi-scale [4]
![Diagram illustrating the red-bed soft rock and its properties in multi-scale [4]](https://static-01.extrica.com/articles/24596/24596-img1.jpg)
a) Engineering scale
![Diagram illustrating the red-bed soft rock and its properties in multi-scale [4]](https://static-01.extrica.com/articles/24596/24596-img2.jpg)
b) Grain scale
![Diagram illustrating the red-bed soft rock and its properties in multi-scale [4]](https://static-01.extrica.com/articles/24596/24596-img3.jpg)
c) Laboratory scale
![Diagram illustrating the red-bed soft rock and its properties in multi-scale [4]](https://static-01.extrica.com/articles/24596/24596-img4.jpg)
d) Meso-structure scale
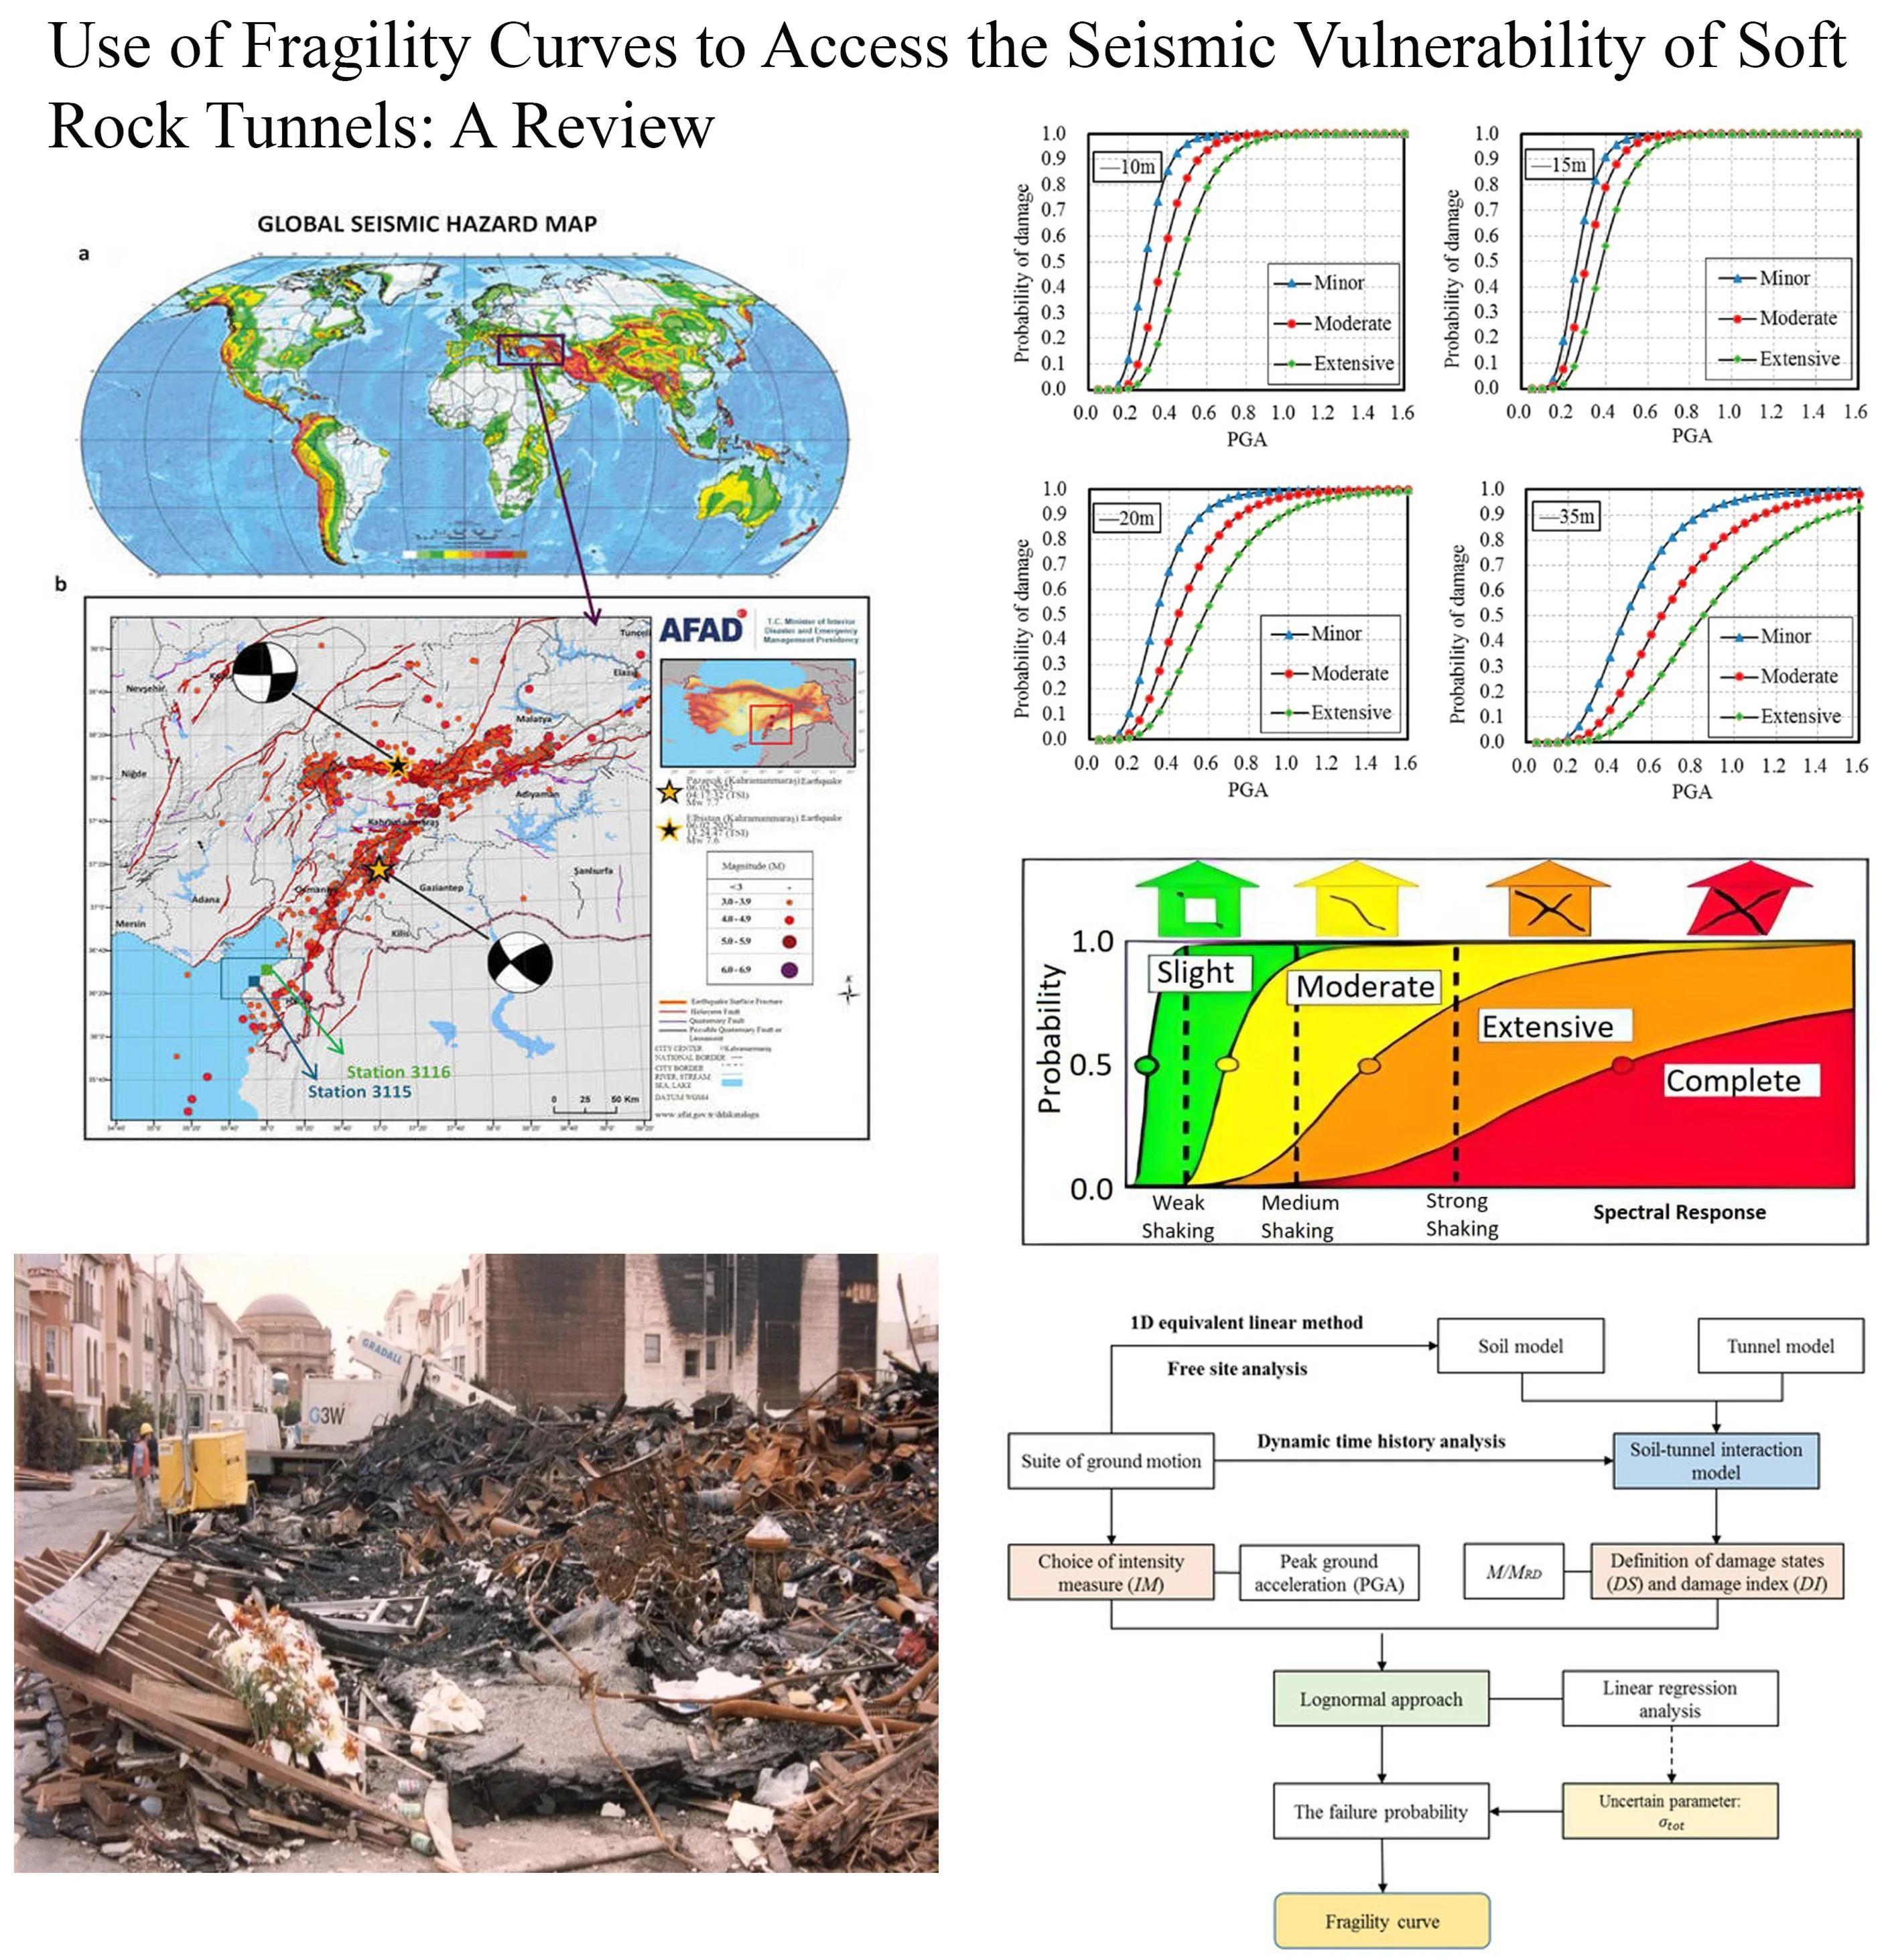
A large number of urban, as well as urban and intercity tunnels worldwide traverse soft rock formations. The Eastside Tunnel’s performance during the Loma Prieta earthquake in 1989 in the San Francisco Bay Area serves as a noteworthy illustration. The tunnel which was constructed in a zone of soft rock, experienced substantial damage including lining deformation and ground settlement, highlighting the vulnerabilities of such structures [5]. The seismic performance of soft rock tunnels is becoming more crucial for sustainable development as urbanization spreads into geologically difficult places.
Fig. 2Damage observed in the Eastside Tunnel post – 1989 Loma Prieta Earthquake [6]
![Damage observed in the Eastside Tunnel post – 1989 Loma Prieta Earthquake [6]](https://static-01.extrica.com/articles/24596/24596-img5.jpg)
A number of geological and structural variables make soft rock tunnels especially susceptible to seismic effects:
A. Low Shear Strength: Soft rocks display low cohesion and friction angle at which they tend to fail under the seismic loads. However, this characteristic makes lining deformation, ground settlement, even tunnel collapse more likely.
B. High Deformation Potential: Soft rocks display high compressibility and plasticity, leading to large ground movements during earthquakes that further damage tunnel linings and joints [7].
C. Effects of Soil-Structure Interaction (SSI): It is clear that the interaction between the tunnel structure and the nearby soft rock has a significant influence on the seismic response [8]. SSI that is poorly designed exacerbates damage; the seismic forces are unevenly distributed across the tunnel lining [9].
Soft rock tunnels, among other infrastructure, can be accessed through use of its fragility curves [10]. A probabilistic framework can be used to estimate the likelihood at which certain damage states can be reached under different levels of seismic intensity [11]. Fragility curves are graphical depictions that are used to calculate the likelihood that a structure may sustain damage to differing degrees under certain seismic intensities. According to Mackie and Stojadinovic (2004) [12], they established a vital connection between seismic danger levels and structural performance, enabling engineers to calculate the likelihood of damage and devise suitable mitigation strategies. Using seismic hazard analysis, structural modeling and statistical evaluation, fragility curves are developed. Key applications include:
A. Risk Assessment: Quantifying damage probabilities for specific seismic events for the purpose of estimating potential losses.
B. Design Optimization: Members of the team have informed the design of tunnels for improved seismic resilience.
C. Policy Development: Based on which to support building codes and standards to address seismic risks [13].
A typical fragility curve for a particular damage scenario can be represented by a cumulative distribution function (CDF) [14]. One often used logistic function is Eq. (1):
where: P(D≥d|S) is the probability of reaching or exceeding damage state, d given a seismic intensity S, β0 and β1 are parameters estimated from data, S represents the seismic intensity measure, such as Peak Ground Acceleration (PGA) or Spectral Acceleration (SA) [15].
Current fragility curves are mostly restricted to hard rock or artificial soil conditions, despite significant advancements in seismic risk assessment. However, soft rock formations have not received much attention as a special problem. The purpose of this study is to close this gap by:
A. Describe development of fragility curves for soft rock tunnels using a comprehensive review of available methodologies.
B. Illustrating recent progress that improves fragility assessments including, machine learning, Bayesian inference and others, which increase accuracy and applicability.
C. It provides practical insights for engineers, policymakers and researchers working to develop improved seismic risk management strategies.
2. Methodologies for constructing fragility curves
The development of fragility curves is a crucial step in assessing a structure’s seismic susceptibility [16]. These curves offer a probabilistic framework for assessing the possibility of distinct damage states at varying seismic intensity levels, according to Werner et al. (2009) [17]. Understanding and accurately constructing these curves are essential for effective seismic risk management and infrastructure resilience.
Fragility curves are derived through a combination of seismic hazard analysis, structural modeling and statistical evaluation [18]. The process involves several key steps: defining damage states, determining seismic hazard levels, modeling structural response and analyzing damage data. According to Naseem et al. (2023) [19], every stage is essential to ensuring that the fragility curves appropriately depict the structure's susceptibility to seismic stress.
2.1. Development of fragility curves
A key step in evaluating seismic vulnerability of structures including soft rock tunnels is the development of fragility curves [19]. As a function of seismic intensity measurements (IMs), these curves offer quantitative interpretations of the likelihood that a structure may reach or surpass certain damage stages. The multiple disciplines involved in this process include seismic hazard analysis, structural modeling, statistical analysis and data integration [20]. The process of developing fragility curves involves several key steps:
A. By measuring the possible ground shaking at a location, known as Peak Ground Acceleration (PGA) and Spectral Acceleration (SA), seismic danger is identified [21]. Seismic hazard curves are developed to illustrate the probability of different levels of ground shaking over a certain time period, and ground motion parameters are evaluated as part of this [22]. The parameters generated in these ways serve as the basis for the quantification of dynamic intensity.
B. Building a soft rock tunnel structural model to mimic how it would react to seismic loads. This model incorporates factors such as tunnel geometry, material properties and interaction with surrounding soft rock [23].
C. Creating distinct damage states that classify the degree of harm, from moderate to severe. They are defined using measurable performance criteria, i.e. deformation thresholds or lining crack widths [24]. Typically, damage states are determined by structural performance standards like deformation thresholds or displacement limitations [25].
D. Past seismic events, experimental studies and numerical simulations are used to gather data. Critical validation data for fragility curves is provided by field observations of damage during actual earthquakes. This data is used to derive the fragility parameters through statistical analysis [26].
Fig. 3Flowchart of steps to develop fragility curves
E. Developing the fragility curves with the use of statistical techniques. Typical approaches include logistic regression, which calculates the probability of damage as a function of seismic intensity and Bayesian methods, which include historical data and update fragility curves when new information becomes available [27]. A fragility curve's general form may be written as Eq. (2):
where: P(D≥d|IM) is the probability of reaching or exceeding damage state, d given the Intensity Measure (IM), μd is the mean of the damage threshold for state d, σd is the standard deviation of the damage threshold, ϕ is the cumulative distribution function of the standard normal distribution [12].
2.2. Development process
2.2.1. Seismic hazard analysis
Since seismic hazard analysis measures the possible frequency and severity of ground shaking at a certain location, fragility curves are created using this data [28]. The results from this analysis lay the foundation for determining the potential ground shaking and associated structure response in the form of soft rock tunnels. Recent advancements have enhanced seismic hazard analysis by incorporating a broader range of ground motion parameters and probabilistic models. According to Boore et al (2014) [29], these enhancements offer a more thorough evaluation of seismic threats and their possible consequences on structures. A critical aspect of all such modeling processes is the selection and characterization of suites of input parameters that accurately model the seismic behavior of soft rock tunnels and lead to robust fragility curves.
Key Components:
1. Ground motion parameters defining shaking severity are regarded as seismic hazard. Peak ground acceleration (PGA), spectral acceleration (SA) and duration of ground motion (DGM) are a few examples of ground motion parameters. Seismic analyses are sensible and reliable when input motions are properly selected, according to regional seismic response spectra and site specific conditions. Each parameter influences the level of shaking experienced by a structure.
A. The greatest acceleration to the ground experienced after an earthquake is known as Peak Ground Acceleration (PGA). When developing fragility curves, the IM is frequently utilized.
B. The reaction of a structure to seismic waves at certain vibrating frequencies is recorded by Spectral Acceleration (SA). The unique nature of tunnels makes spectral acceleration particularly important.
C. Duration of Ground Motion(DGM): It accounts for the length of time seismic shaking lasts, which may affect cumulative damage in soft rock tunnels.
D. Peak Ground Velocity (PGV): Ground motion velocity that is reached by the earthquake usually expressed in cm/s. It is the equivalent of structural deformation and damage, and is of particular relevance for soft rocks susceptible to accumulation of strain.
2. The likelihood of surpassing ground motion levels of varying intensities over a specified period of time is connected by the seismic hazard curve. Probabilistic seismic hazard analysis (PSHA), which integrates ground motion intensity characteristics with seismic event likelihood, is used to create the curves [30].
3. Probabilistic seismic hazard models predict the likelihood that certain seismic intensity levels will occur at a location during a specific period of time [31]. Advances in these models incorporate site-specific geological and seismic data for more accurate predictions [32]. The probabilistic seismic hazard can be estimated using Eq. (3):
where λ(I) is the annual rate of exceedance for intensity level I, p(I|Mj) is the probability of intensity I given magnitude Mj and f(Mj) is the frequency distribution of magnitudes [32].
4. Development has recently improved hazard predictions with site-specific geological and geotechnical data implied. As an example, by replacing ad hoc assumptions of ground motion amplification with local soil conditions and fault rupture dynamics, we are able to more realistically model ground motion amplification in the soft rock environment.
5. Soil amplification and directivity effects as well as many other parameters that were not accounted for before in Ground Motion Prediction Equations (GMPEs) have improved the accuracy of seismic hazard analysis in modern GMPEs [33].
2.2.2. Structural modeling
A crucial structural modeling phase that initially predicts how a structure, such a soft rock tunnel, would respond to seismic pressures is the creation of fragility curves. Making a thorough depiction of the tunnel's structure and how it interacts with the nearby soft rock is known as structural modeling. Replicating the structure's response to seismic loads is the aim of this model. Structural models simulate the interaction of the tunnel with surrounding geological medium and yield insight into stress distribution, deformation and failure mechanisms under varied seismic intensity. High-resolution finite element models that accurately depict the intricate interactions between the tunnel and soft rock are among the most recent advancements in structural modeling, along with the application of sophisticated simulation techniques [23].
Understanding the realistic seismic intensity is crucial because material nonlinearity has a significant impact on the seismic response of a tunnel in a soft rock formation. However, strain-softening, stress relaxation and hysteresis significantly affect tunnel stability and performance under seismic loading. Reliable fragility assessment and improved resilience are achieved through accurate modeling of these properties using advanced materials for tunnel linings.
Key Components:
1. The structural model incorporates the physical dimensions and design of the tunnel, including: tunnel shape, lining thickness and material properties, construction type (single vs. double lined). For instance, a different stress analysis is needed for a circular tunnel with a 4 m diameter and a concrete lining that is 0.3 m thick than for a rectangular tunnel with the same cross sectional area.
2. Finite element analysis, or FEA, is used to predict the tunnel’s structural response to seismic loads. This technique divides the structure into small elements and calculates the response based on material properties and boundary conditions [34].
Fig. 4Depicts the deformation patterns under seismic stress in a soft rock tunnel using a finite element model [35]
![Depicts the deformation patterns under seismic stress in a soft rock tunnel using a finite element model [35]](https://static-01.extrica.com/articles/24596/24596-img7.jpg)
3. To predict the seismic behavior, correct representation of the material properties are required. These include:
A. Lining Materials: Concrete, steel and composite linings with their elastic modulus, tensile strength and ductility.
B. Soft Rock Properties: Cohesion, internal friction angle, shear modulus and deformation characteristics of surrounding rock [7].
If the lining is to withstand amplified seismic forces, then soft rock with low shear strength (e.g. claystone) will require special attention.
4. According to Yang et al. (2022) [8], boundary conditions explain how the tunnel interacts with the surrounding earth and external operating demands on the system. For static models, fixed boundaries are used for seismic simulations. Ground shaking due to an active fault zone is known to require dynamic boundary conditions in a soft rock tunnel at least near the fault zone.
5. Nonlinear Structural Response incorporates nonlinear behavior into the model which is essential for accurate predictions. Soft rock tunnels often exhibit nonlinear response characteristics under high seismic loading, which must be accounted for in the model [26]. The nonlinear response can be represented by Eq. (4):
where: α stands for the nonlinear coefficient, σ for stress, E for elastic modulus and ϵ for strain [26].
2.2.3. Damage state
Damage states are critical in the development of the fragility curve, in order to define how much structural damage there will be for a given seismic intensity. Damage states are categorizations of how much damage a structure (such as a soft rock tunnel) can incur under seismic loading. This classification helps in linking seismic intensity to specific damage outcomes. Recent studies have refined the definition of damage states by incorporating more detailed criteria and using advanced monitoring techniques to assess damage levels [24]. These definitions allow a consistent quantification and comparison of seismic vulnerabilities between structures and sites.
Key Components:
1. Damage states are categorized as discrete levels from minor to complete structural failure. By associating these levels with specific performance criteria, such as deformation thresholds, stress limits or functional impacts, these levels become a well defined ordering. The common damage state categories are:
A. Slight Damage: Cosmetic cracks of a minor nature causing no capacity (functional) impact on the structure.
B. Moderate Damage: Visible cracks that may impair a structure's structural performance but do not always result in the structure collapsing.
C. Severe Damage: Structural failure that is significant, namely, large deformations, partial collapse or a loss of functionality.
Table 1Example of damage states for a soft rock tunnel
Damage State | Description | Performance Criteria |
Slight | Minor cracks, no deformation | Crack width < 2 mm; No displacement |
Moderate | Significant damage, deformity | Crack width 2-5 mm; Displacement < 10 mm |
Severe | Major damage, loss of function | Crack width > 5 mm; Displacement > 10 mm |
2. Thresholds to each damage state are defined in terms of quantifiable parameters, such as maximum allowable displacements or crack widths.
3. The precision of damage estimates has increased because to sophisticated monitoring methods including real-time sensors and remote sensing. These technologies provide detailed information on structural changes and damage progression [36].
2.2.4. Failure index relationship
The Failure Index (FI) is a quantitative tool for evaluating the structural damage progression of soft rock tunnels subjected to seismic loading. It gives a method by which to systematize the relationship of observed or predicted damage states with underlying seismic intensities. These relationships help establish these relationships to increase fragility curve accuracy and improve the accuracy of risk assessments and resilience plans.
2.2.4.1. Definition of failure index (FI)
This measure, termed the Failure Index (FI) represents the level of structural degradation compared to the tunnel capacity to mitigate seismic stresses. It may be stated as follows and is computed using a normalized scale that normally ranges from 0 (no damage) to 1 (total failure), Eq. (5):
where: Structural Demand: Seismic loading imposed on the tunnel resulting in stress, strain, or deformation Structural Capacity: Maximum allowable stress, strain or deformation without tunnel failure.
Fig. 5Fragility curves of different damage levels [37]
![Fragility curves of different damage levels [37]](https://static-01.extrica.com/articles/24596/24596-img8.jpg)
2.2.4.2. Linking FI to damage states
Damage states are directly correlated with the failure index and higher values of FIcorrespond with higher structural degradation. The relationship between the Failure Index and damage states can be mapped as shown in Table 2 [38].
Table 2Relationship between Failure Index and damage state
Damage State | Failure Index (FI) | Description |
No Damage | FI ≤ 0.1 | Elastic behavior, no visible damage. |
Slight Damage | 0.1 < FI ≤ 0.3 | Minor cracking or slight deformation. |
Moderate Damage | 0.3 < FI ≤ 0.6 | Noticeable cracking, localized yielding. |
Severe Damage | 0.6 < FI ≤ 0.9 | Significant deformation, structural distress. |
Collapse | FI > 0.9 | Structural failure, tunnel no longer functional. |
2.2.4.3. Relationship between FI and seismic intensity
A regression-based method is employed even if the Failure Index is connected to seismic intensity measurements (IM) like PGA, PGV or spectral acceleration. The general relationship can be expressed as Eq. (6):
where: IM: Seismic Intensity Measure (e.g. PGA, PGV), a, b: Empirical coefficients determined from numerical simulations, experiments or field data, FI: Failure Index.
Key Points:
a. A scaling factor which is the initial susceptibility of the tunnel.
b. An exponent linked to the rate at which damage increases as earthquake intensity increases [15].
Following the computation of the FI values, a lognormal cumulative distribution function is used to determine the likelihood of surpassing a specified damage state(d) as shown in Eq. (7):
where: P(D≥d|FI): Probability of exceeding damage state d given FI, Φ: Standard normal cumulative distribution function, μd: Median FI value for damage state d, σd: Logarithmic standard deviation for damage state d [39].
A typical plot of the Failure Index versus seismic intensity might exhibit the following characteristics:
1. FI is low at low seismic intensities, implying that the structures respond elastically.
2. FI increases rapidly, reflecting a transition from elastic to inelastic and failure states, with increasing seismic intensity.
2.2.5. Data collection and analysis
Data collecting includes field research, laboratory testing and empirical data on the performance and damage of structures from previous earthquakes. This data is crucial for developing and validating fragility curves. The integration of big data and advanced analytical techniques has revolutionized data collection and analysis. Real-time monitoring and high-resolution seismic data provide more detailed and accurate information for fragility assessments [26].
Key Components:
1. Data from previous seismic events including observed damage and structural response are used to estimate fragility parameters. This data is often obtained from post-earthquake inspections and structural damage reports. Empirical data on structural performance under real world seismic events is provided from post earthquake damage assessments. Damage data from the Eastside Tunnel under the 1989 Loma Prieta earthquake has proven crucial to our understanding of fragility in soft rock-induced liquefaction.
2. Laboratory scale experiments on soft rock specimens under controlled conditions replicate seismic loading and yield mechanical property (stiffness, strength) and damping characteristics data. Triaxial testing of clay shales can provide information on how soft rock responds to dynamic stresses allowing calibration of fragility models.
3. Since collected data is from multiple sources, such as ground motion parameters and damage states, data is normalized to ensure consistency across datasets. Data uncertainty is caused by measurement mistakes, missing data and ground motion record fluctuation. The uncertainties associated with these techniques are quantified and included into fragility models using Monte Carlo simulation and Bayesian inference.
4. The gathered data is analyzed using statistical techniques to produce fragility curves. The link between earthquake intensity and damage probability is modeled using methods like logistic regression and Bayesian inference [40].
Recent advancements in statistical analysis include the application of machine learning algorithms, which offer improved accuracy by analyzing large datasets and capturing complex relationships [26]. In order to find patterns and abnormalities in seismic response data, methods like support vector machines (SVMs) and clustering approaches are applied to big datasets. Fragility simulation improves in accuracy by machine learning finding hidden relationships between seismic intensity measures and observed damage states. The following is the logistic regression model for estimating fragility curves Eq. (8):
where β0 and β1 are the regression coefficients and IM is the intensity measure [12].
2.2.6. Statistical analysis and curve fitting
The model should be correct as the creation of fragility curves is predicated on statistical study of the correlation between seismic intensity and damage likelihood [41]. However, modern techniques deal with challenges like data variability, parameter estimation and sensitivity to outliers. To estimate parameters and describe the link between seismic intensity and damage likelihood, statistical analysis fits the fragility curve to the gathered data. The application of machine learning and Bayesian techniques in statistical modeling has improved the accuracy and adaptability of fragility curves. These methods allow for continuous updating and refinement of the curves as new data becomes available [42].
Key Components:
1. Curve Fitting Techniques: Parameters such the fragility curve's mean and standard deviation are calculated by curve fitting. Various techniques are used to fit fragility curves including logistic regression, Bayesian inference and machine learning algorithms. These techniques use the gathered data to estimate the fragility curve's parameters [43].
2. Structural behavior is incorporated in prior knowledge as used in the Bayesian methods and as new data becomes available, fragility estimates are updated. The posterior distribution is computed as Eq. (9):
where: P(θ|D) is the posterior, P(D|θ) is the likelihood and P(θ) is the prior.
Bayesian approaches are particularly amenable to hierarchical modeling (i.e., at different levels: site-specific vs. regional effects).
3. Validation and Calibration: Validating and calibrating fragility curves are essential to ensure their accuracy and reliability. The fragility curves are validated against past damage from observed seismic events. Predicted damage probabilities are discussed for soft rock tunnels and contrasted with post earthquake inspection data. Fragility parameters are calibrated against discrepancies between predicted damage and observed damage. For instance, fitted models are more dependable when methods like bootstrapping and cross validation are used [44]. This procedure entails comparing observed damage data with estimated damage probability and modifying the parameters as necessary.
2.2.7. Uncertainty analysis
Seismic vulnerability modeling includes an uncertainty analysis component that quantifies the varying and unknown inputs, processes and outputs into the fragility assessments. The accuracy and reliability of fragility curves involve a high level of uncertainty, which is extremely important in the soft rock tunnel context, to identify, analyze and resolve systematically, various sources of such uncertainty. Uncertainties in seismic vulnerability modeling can be broadly categorized into the following elements:
A. There are inherent spatial and temporal fluctuations in cohesion, friction angle, elastic modulus and uniaxial compressive strength (UCS). Mineral composition differences may result in UCS for claystone of 1 MPa to 10 MPa within a single tunnel section.
B. Developed rock strength and stiffness variability leads to different deformation and stress response modalities, which affects damage probabilities.
C. Small samples of rock masses often cannot adequately represent a heterogeneous rock mass leading to error in laboratory tests and field measurements.
D. Uncertainty in seismic response predictions is caused by errors in material property estimation that propagate through the model.
E. Wave propagation, fault dynamics and earthquake magnitude all contribute to the temporal and spatial variability of seismic intensity measurements (PGA, PGV and spectral acceleration).
F. Stress distribution and deformation patterns in the tunnel vary due to variations in the input motions.
2.3. Pushover analysis
Pushover analysis, a nonlinear static analysis technique frequently used to assess the seismic performance of structures, including tunnels, has a unique applicability in tunnel constructions [45]. Pushover analysis is especially important for soft rock tunnels where it offer vital insight into how seismic loads are distributed and resisted, and which structures are critical, deficient and fail. The likelihood of attaining or surpassing a certain damage state as a function of seismic integral measurements like Peak Ground Acceleration (PGA) or Peak Ground Velocity (PGV) is quantitatively represented by fragility curves obtained from pushover analysis [46].
2.3.1. Methodology for pushover analysis
2.3.1.1. Structural model development
1. Finite Element Model (FEM): Material characteristics, geometric configurations and boundary conditions are used to simulate the tunnel [47].
2. Material Properties: Soft rock and tunnel lining elastic modulus, Poisson’s ratio and strain hardening behavior.
3. Geometric Considerations: Thickness of linings and dimensions of the tunnel, cross sectional shape (e.g. circular horseshoe).
4. Boundary Conditions: Tunnel lining and surrounding rock interaction fixed or flexible support conditions [8].
2.3.1.2. Application of incremental loads
1. Apply lateral forces which simulate increasing seismic demand such as ground motion.
2. The load pattern may be predefined and distributed (triangular, uniform) or produced via seismic hazard analyses.
2.3.1.3. Tracking structural response
1. The recorded structures at each load step include stress distribution, deformation and crack propagation.
2. The damage thresholds are characterized by tracking key parameters (e.g. displacement) of critical locations (tunnel crown, walls).
2.3.1.4. Defining damage states
Engineering criteria are provided in terms of fracture widths, lining displacement or structural strain to designate damage states (e.g., minor, moderate, severe, collapse).
2.3.2. Fragility curve development
2.3.2.1. Calculation of failure probabilities
The failure probability P(D≥di|IM)for a given damage state di and intensity measure IM is calculated using Eq. (10):
where: Φ: cumulative distribution function (CDF) of the standard normal distribution, μdi: median intensity measure causing damage state di,σdi: logarithmic standard deviation of the intensity measure for damage state di.
2.3.2.2. Data fitting
1. Fulcrum for μdi and σdi from each damage state starts with results from the pushover analysis.
2. The relation between seismic intensity and failure probabilities is fitted by a lognormal distribution.
The development process of fragility curves involves a comprehensive approach that integrates seismic hazard analysis, structural modeling, damage state definition, data collection and statistical analysis among others. The precision and usefulness of fragility curves have been greatly enhanced by recent developments in these fields, allowing for more efficient risk assessment and mitigation techniques. By leveraging new data sources, advanced modeling techniques and sophisticated statistical methods, researchers and engineers can better understand and manage the seismic vulnerability of structures, including soft rock tunnels.
3. Risk assessment and management
3.1. Risk assessment
Assessing seismic risk is essential to controlling and reducing the danger of earthquakes, particularly in soft rock tunnels that house vital infrastructure. Successful risk assessment allows stakeholders to identify what forms of vulnerabilities are susceptible to vary different threats, calculate anticipated losses and adopt informed decision making measures to improve resilience and preparedness. Given certain seismic intensity values, fragility curves estimate the likelihood of varying degrees of damage, making them essential tools for assessing seismic risk. For calculating possible losses and comprehending the risk involved with infrastructure, this knowledge is essential.
Since they offer a probabilistic foundation for quantifying the likelihood that a structure would sustain varying degrees of damage under specific seismic intensities, fragility curves are effective instruments in seismic risk assessment [46]. These curves span the seismic hazard analysis to risk management transition bridging seismic demand to expected structural performance outcomes. For soft rock tunnels a comprehensive seismic risk assessment framework is developed that incorporates fragility curves along with economic loss analysis and recovery models, providing a holistic view of potential seismic impacts. Fragility curves, economic loss calculation and recovery models are all integrated into modern risk assessment models to give an all-encompassing picture of seismic risk.
Calculating the economic loss is part of seismic risk assessment, which aids in understanding the possible financial repercussions of damage caused by earthquakes. Fragility curves integrated with economic loss models significantly enhances the evaluation of the direct and indirect costs associated with seismic events.
This method provides a more thorough evaluation of possible effects by taking into account direct damage, repair expenses and business disruption [48]. Fragility curves complement recovery models by describing those processes and timelines necessary to recover tunnel functionality post earthquake. The integration of these models with fragility assessments provides an enhanced risk management framework by addressing not only the likelihood of damage, but also the recovery effort efficiency.
In order to analyze the cumulative effects of numerous calamities on infrastructure, fragility curves are being used more and more in multi-hazard risk assessments. These assessments integrate fragility curves with other hazard models, such as flood or wind hazard models [49].
3.2. Design and retrofit of infrastructure
An important component of earthquake engineering is design and retrofitting infrastructure in seismic events, such as soft rock tunnels [50]. Fragility curves are used in the design and retrofit of structures to improve their seismic resistance. Fragility curves are important in helping determine the level of probable damage to a new tunnel as well as how to retrofit an existing one for seismic purposes. Providing support to performance based seismic design (PBSD) and retrofitting optimization to enhance resilience under a cost constraint, this probabilistic framework extends to include requirements for post-seismic strengthening [51]. By understanding the damage probabilities associated with various seismic intensities, engineers can design structures to meet performance objectives and reduce vulnerability.
In order to achieve the expected performance in the face of expected seismic circumstances, a new contemporary seismic design method called Performance Based Seismic Design (PBSD) incorporates fragility functions into the design process [52].
Performance objectives are categorized based on the desired functionality of the tunnel post-earthquake:
1. Operational Level: Damage to the tunnel is slight cracking or deformation and the tunnel is fully functional.
2. Life Safety Level: Even if such severe damage causes collapse, structural integrity is maintained.
3. Collapse Prevention Level: It allows extreme seismic forces to pass without total structural failure and remains safe during evacuation.
Recent advancements in performance-based seismic design use fragility curves to define performance objectives and design criteria. This approach ensures that structures are designed to meet specific performance levels such as maintaining functionality or preventing collapse, under anticipated seismic loads [53].
This makes it possible to make focused enhancements that save expenses and increase structural resilience [54]. The goal of performance-based design might be stated as Eq. (11):
where: P(D≥d|IM) is the probability of reaching or exceeding damage state; d, α is the acceptable probability threshold, representing the desired level of safety or performance.
The findings showed that retrofitting is an affordable way to improve the soft rock tunnels' earthquake resistance [55]. Fragility curves define how weaknesses and the probability of damage should be factored during decision making on retrofitting. Fragility curves are employed to optimize retrofit strategies by evaluating the effectiveness of various retrofitting options. Vulnerabilities are identified in terms of:
1. Structural imperfection (i.e. thin or deteriorated linings).
2. It includes geotechnical challenge (weak or anisotropic soft rock).
An example is that a soft rock tunnel with a 40 % probability of severe damage at PGA=0.6 g may require retrofitting to reduce that probability below 10 %.
Fragility curves aid in prioritizing effort for retrofitting based on the most fragile parts of the tunnel. For example, segments with higher chances of damage in severe terms are prioritized. Structural models, and updated fragility curves, are iteratively tested on retrofitting measures. Using this approach we have accounted for the dynamic nature of seismic risks and evolving structural conditions.
The seismic performance of tunnel linings has been enhanced using high performance materials such as engineered cementitious composites (ECC) and ultra high performance concrete (UHPC). High tensile strength and ductility of ECCs decreases cracking under seismic loads.
3.3. Emergency planning and response
Soft rock tunnels require emergency planning and response as an important part of seismic risk management. Soft rock tunnels are highly susceptible to deformation and damage during seismic events hence it is desirable for emergency strategies of such tunnels to be well designed to minimize risk to human life, infrastructural functionality and economy. Fragility curves are used in emergency planning to prioritize resources and develop response strategies based on the predicted impact of seismic events. In this process, fragility curves make important contributions by providing probabilistic damage predictions upon which preparedness, real-time response and recovery efforts are based. They help in identifying vulnerable areas and planning effective emergency response and recovery operations.
Advances in real-time seismic monitoring and data integration allow for dynamic updating of fragility curves based on current seismic activity. This enables real-time risk assessment and response planning during earthquakes [36]. Real time data of seismic intensity and structural performance is provided by advanced monitoring systems such as accelerometers and strain gauges. The fragility curves are integrated with this data to perform dynamic risk assessment during seismic events.
Fragility curves are used to create spatial risk maps that highlight areas of high vulnerability and guide resource allocation for emergency response. These maps are valuable for decision-makers in coordinating evacuation, repair and recovery efforts [56]. Fragility curves are used to prioritize repairs for damaged elements and assess the extent of damage. In order to reduce downtime, resources are assigned. Fragility curves aid in prioritizing recovery and to assess the long term resilience.
3.4. Policy and regulatory framework
Policy and regulatory frameworks use fragility curves to inform building codes, standards and regulations. Soft rock tunnels are particularly vulnerable but need specific policies that address the peculiar seismic risk associated with the tunnels, while taking into account economic as well as practical limits. Science-led policymaking is supported by the use of fragility curves as quantitative indicators of the likelihood of structural damage in response to varying seismic intensity. Quantitative assessments of seismic risks provided as a foundation for evidence based policies. By incorporating fragility-based insights into these frameworks, policymakers can improve the resilience of new and existing structures.
Seismic design standards and construction codes are developed using fragility curves to direct the development of tunnels to meet minimum safety requirements under anticipated seismic conditions. New building codes are being developed based on fragility curve analysis, incorporating performance-based standards that reflect the probabilistic nature of earthquake damage [24].
Recent updates to seismic regulations emphasize the use of fragility curves for risk-based assessment and mitigation planning, ensuring that policies align with the latest advancements in seismic vulnerability assessment [57]. Seismic design for tunnels is based on policy which encourages performance based seismic design (PBSD), in which fragility curves are used to define performance objectives in response to different seismic scenarios.
The application of fragility curves extends across various domains, including seismic risk assessment, design and retrofit, emergency response and policy development. Recent advancements in data integration, modeling techniques and real-time assessments have enhanced the effectiveness of fragility curves in improving structural resilience and informing decision-making processes. Stakeholders may improve infrastructure safety and operation and control seismic risks more effectively by using these advancements.
4. Advances and novel approaches
The evaluation of seismic risk has seen substantial change in recent times due to technological breakthroughs, enhanced procedures and innovative methods. The development and use of fragility curves, which are crucial for evaluating the seismic resilience of structures such soft rock tunnels, have greatly benefited from these advancements [58].
4.1. Incorporation of soft rock characteristics
4.1.1. Characterization of soft rock properties
Characterization of soft rock properties is required for evaluating how tunnels behave under seismic loading. Soft rock includes sedimentary rocks such as claystones, siltstones and shales that have distinct mechanical properties compared to more competent rock types. Fragility models that characterize a soft rock tunnel accurately are important for the design optimization, risk assessment and resilience planning. Intermediate strength and stiffness provide the definition of soft rock materials which lie between hard rock and soil. The key characteristics of soft rock that influence seismic vulnerability include:
1. During an earthquake, soft rocks may be less able to withstand lateral stresses due to their decreased shear strength. Increased deformation and possible failure under seismic loads may result from this [59].
2. Due to their lower stiffness, soft rocks can undergo larger deformations, which can impact the structural integrity of tunnels and other underground structures [24].
More realistic depictions of soft rock behavior under seismic stresses may be found in more recent advancements in material models such as the Drucker-Prager and Modified Cam-Clay models. These models incorporate factors such as plasticity, anisotropy and strain-softening, which are crucial for realistic simulations [7].
4.1.2. Integration into structural models
Accurate seismic behavior and vulnerability prediction of tunnels requires the inclusion of soft rock properties into structural models. Incorporating soft rock characteristics into structural models involves adapting finite element analysis and other computational methods to account for the unique behavior of soft rock. Detailed geotechnical and mechanical characteristics of soft rock are incorporated by structural models, which can capture complex interactions between tunnel lining, surrounding rock mass and seismic forces [60]. This integration gives the basis for realistic stress distribution, deformation analysis and fragility curve development.
Key advancements include:
1. Tunnel behavior in soft rock is simulated using nonlinear finite element analysis (FEA) methods. These models incorporate soft rock properties such as low stiffness and high deformability to predict structural response more accurately [23].
2. The usage of coupled interaction models – which take into consideration the interaction between soft rock and tunnel linings – is growing. These models simulate the effects of rock-tunnel interface interactions and the potential for tunnel deformation and failure [61].
Advanced FEA techniques now include adaptive mesh refinement to capture localized effects of seismic loading on soft rock and tunnel linings. This approach improves the resolution of simulations in critical areas, enhancing the accuracy of fragility predictions [26].
4.1.3. Seismic response analysis
Seismic response analysis is a critical process for evaluating soft rock tunnels during seismic loading. Seismic response analysis for soft rock tunnels involves evaluating how seismic waves propagate through soft rock and how this affects tunnel stability. Seismic response analysis simulates interaction of seismic waves with tunnel structures and surrounding rock masses towards recognizing seismic failure mechanisms, stress redistribution and deformation patterns. Key factors include:
1. The propagation of seismic waves through soft rock is influenced by its low shear modulus and high damping capacity. This can result in amplified ground motion and increased deformation at the tunnel site [62].
2. Response spectrum analysis is used to assess the potential seismic reaction of tunnels based on expected ground motion characteristics. In order to produce precise seismic impact estimates, our technique takes into account the unique properties of soft rock [24].
Recent research has highlighted the importance of site effects in soft rock environments. Soft rock can significantly amplify seismic waves, leading to higher-than-expected ground motions at the site. This effect must be accounted for in fragility curve development [63]. These insights are critical to develop accurate fragility curves, suggesting retrofitting and enhancing the resilience of existing tunnels.
4.1.4. Recent innovations and future directions
Recent innovations in the incorporation of soft rock characteristics into fragility curves focus on improving the accuracy and adaptability of seismic vulnerability assessments. Future research aims to further refine these approaches and enhance their applicability.
1. The use of machine learning algorithms and data assimilation techniques is emerging as a novel approach to integrate soft rock characteristics into fragility models. These methods can analyze large datasets and identify patterns that improve the precision of fragility assessments [26].
2. Real-time adaptation of fragility curves based on live seismic data and structural monitoring is an area of active research. This approach allows for dynamic updates to fragility assessments as new information becomes available, improving the responsiveness of seismic risk management [36].
Table 3 highlights potential future research areas and innovations in incorporating soft rock characteristics into fragility curves.
Table 3Future research directions in fragility curve development
Research area | Description | Expected impact |
Machine learning integration | Using machine learning to refine fragility curves | Enhanced accuracy and adaptability |
Real-time fragility curve updates | Adapting fragility curves based on live data | Improved real-time risk management |
Advanced constitutive models | Developing new models for soft rock behavior | Better representation of complex interactions |
The incorporation of soft rock characteristics into fragility curves represents a critical advancement in seismic vulnerability assessment. Modern advancements in numerical simulations, real-time data integration and geotechnical modeling have greatly improved our capacity to precisely evaluate and control the seismic hazards related to soft rock tunnels. By leveraging these advancements, engineers and researchers can develop more reliable fragility curves that reflect the unique properties of soft rock environments, leading to improved safety and resilience in seismic design and planning.
4.2. Improved statistical methods
Statistical methods play a major role in the creation and improvement of fragility curves, which calculate the probability of structural damage at a specific seismic intensity level. Advances in statistical techniques have enhanced the accuracy and reliability of these curves, allowing for more precise assessments of seismic vulnerability.
4.2.1. Advanced regression techniques
To determine the correlation between seismic intensity measurements and damage probabilities, fragility curves for soft rock tunnels are created using sophisticated regression algorithms [10]. The capacity to simulate the association between seismic intensity measurements and damage states is improved by the use of advanced regression techniques. These methods do not only include simple linear models, but go beyond by allowing complex nonlinear behaviors, multi variable dependencies and uncertainty quantification. Traditional methods have been augmented with more sophisticated approaches that offer greater accuracy and flexibility. This application guarantees more accurate and reliable fragility curves worked on particular geotechnical and seismic conditions.
While traditional logistic regression models have been widely used, incorporating interaction terms between seismic intensity measures and structural variables can provide more nuanced insights. This method accounts for how different factors interact to influence the probability of damage [26].
Generalized Linear Models (GLMs) extend traditional logistic regression by allowing for a wider range of distributions and link functions. This flexibility is particularly useful for modeling complex damage patterns and varying damage thresholds [57]. Eq. (12) is an expression for the logistic regression model with interaction terms:
where: P(D≥d|IM,X) is the probability of reaching or exceeding damage state d, IM is the Intensity Measure, X is a structural variable, β0, β1, β2 and β3are regression coefficients [64].
A useful technique for analyzing the effects of seismic energy on various quantiles of the damage distribution is quantile regression. This method allows for the estimation of damage probabilities at various levels of severity, offering a more comprehensive view of structural vulnerability [65]. The fragility curve logistic regression model may be written as Eq. (13):
where: P(D≥d|IM) is the probability of reaching or exceeding damage state d, IM is the Intensity Measure, β0 and β1 are the regression coefficients [66].
4.2.2. Bayesian methods for fragility curve development
Bayesian methods provide a probabilistic framework for updating fragility curves as new data becomes available. Bayesian methods can be thought of as a kind of traditional regression, but Bayesian techniques estimate posterior distributions of model parameters, facilitating more complete forms of risk assessment and improved decision making under uncertainty. This approach incorporates prior knowledge and uncertainty into the modeling process, resulting in more robust and adaptive fragility curves.
Bayesian updating involves adjusting fragility curves based on observed data and prior distributions. This method allows for continuous refinement of models as more information is collected, improving the accuracy of damage predictions [24].
Hierarchical Bayesian models offer a multi-level approach that accounts for variability at different levels such as site-specific, structural and regional factors. This method enables better management of data variability and uncertainty and offers a more thorough knowledge of fragility [47]. Bayes’ theorem, which updates the probability of a hypothesis (θ) given observed data (D), is the foundation of Bayesian analysis. Eq. (14) is a representation of the Bayesian updating process:
where: P(θ|D) is the posterior distribution of the model parameters θ given the data D, P(D|θ) is the likelihood function, P(θ) is the prior distribution of θ, P(D) is the marginal likelihood [67].
Fragility curve development via integration of prior knowledge, observational data and uncertainty using Bayesian methods provides a powerful route. Due to their ability to handle limited data, quantify uncertainties and respond dynamically, they are well suited to seismic risk assessment of soft rock tunnels.
4.2.3. Machine learning approaches
Using a variety of complex data sources, machine learning (ML) has enabled the creation of fragility curves and the identification of non-linear correlations between material attributes, damage probabilities and seismic intensity measurements [68]. Fragility curve creation has lately benefited from the application of machine learning techniques, which provide strong tools for deciphering intricate datasets and seeing patterns that conventional approaches would overlook. Neural networks including deep learning models can capture non-linear relationships and interactions between seismic intensity measures and damage states. These models improve the precision of fragility curves by learning from large volumes of data [26].
To enhance prediction performance, ensemble techniques employ a variety of models, such as Random Forests and Gradient Boosting Machines. These techniques strengthen the resilience of fragility curves and lessen overfitting [57]. A neural network model's output for developing a fragility curve is represented as Eq. (15):
where: f(x) is the predicted probability of damage, W1 and b1 are the weights and biases of the network layers, σ is the activation function [69].
The precision, scalability and adaptability of fragility curve development can be improved by machine learning techniques that are particularly beneficial for soft rock tunnels where traditional approaches may have difficulties in handling data shortage or complexity.
4.2.4. Copula models for multivariate analysis
This advanced statistical tool, copula models, is used to analyze the relationship amongst several random variables at once. Copulas help engineers estimate the link between seismic intensity measurements and damage probability when creating fragility curves for soft rock tunnels.
A copula is a multivariate distribution function which produces a joint distribution from margins of the individual variables and its dependencies. Copula models are used to analyze the dependence structure between multiple variables, such as different seismic intensity measures and various damage states. These models improve the ability to capture complex correlations and joint distributions in fragility curve development.
Copula models make it easier to create multivariate fragility curves that take dependences between several seismic characteristics into consideration. This approach provides a more comprehensive assessment of vulnerability by considering the joint effects of multiple seismic factors [24].
Copulas are particularly useful for analyzing tail dependencies, where extreme values of seismic intensity measures are correlated with severe damage outcomes. This capability enhances the assessment of rare but impactful seismic events [47].
Copulas increase the precision of fragility models, particularly when the seismic and geotechnical parameters are correlated in multivariate analysis, by supplying a flexible framework.
4.2.5. Statistical uncertainty and sensitivity analysis
Inherent variability in seismic inputs and material properties is taken into account and addressed by uncertainty and sensitivity analysis during development of fragility curves. Understanding statistical uncertainty and sensitivity analysis is essential to appreciating fragility curve robustness and dependability. Recent advancements focus on quantifying and mitigating uncertainty in fragility assessments. Techniques such as Monte Carlo simulations and probabilistic sensitivity analysis quantify the uncertainty in fragility curves due to variations in input parameters and modeling assumptions. This approach helps in assessing the confidence levels of damage predictions [26].
Sensitivity analysis identifies which factors most influence the fragility curves, allowing for targeted improvements in modeling and risk management. This method helps prioritize research and data collection efforts based on their impact on vulnerability estimates [57]. The findings of a sensitivity analysis for a soft rock tunnel are summarized in Table 4, which also highlights the important factors influencing the predictions of the fragility curve.
Table 4Sensitivity analysis results for fragility curves
Parameter | Sensitivity index | Impact on fragility curve |
Ground shaking intensity | 0.65 | High |
Tunnel lining strength | 0.40 | Moderate |
Soil deformability | 0.25 | Low |
These analyses of such soft rock tunnels help ensure that fragility curves accurately portray the wide range of possible outcomes and define controlling factors affecting structural vulnerability specific to site conditions and seismic forces.
The precision and dependability of seismic vulnerability assessments have been greatly improved by the introduction of statistical techniques for fragility curves. New techniques including advanced regression methods, Bayesian updating, machine learning, copula models and uncertainty analysis, provide more sophisticated tools for modeling and understanding seismic risk. These improvements enable more precise predictions of structural damage, better risk management and more effective mitigation strategies in the face of seismic hazards.
5. Case studies
Case studies are essential for comprehending the usefulness and practical use of fragility curves in determining a structure’s seismic susceptibility especially soft rock tunnels. By examining how fragility curves perform in actual scenarios, researchers and practitioners can gain valuable insights into their reliability, limitations and areas for improvement.
5.1. Case study 1: the San Francisco bay area
The San Francisco Bay Area, which is noted for its seismic activity due to the presence of notable fault lines like the San Andreas Fault, is a crucial case study for evaluating seismic risk. The San Francisco Bay Area has already experienced some significant earthquakes, most notably the 1906 San Francisco earthquake and the 1989 Loma Prieta earthquake. The Bay Area’s geology includes a mix of sedimentary deposits and soft rock formations, which influence how seismic waves are transmitted and how structures respond to shaking. Soft rock, such as Franciscan Complex rock, has unique properties that affect seismic vulnerability [63]. The 1906 San Francisco earthquake and the 1989 Loma Prieta earthquake provided crucial information on the seismic performance of infrastructure, especially tunnels. These events demonstrated the need for comprehensive fragility assessments to better understand and manage seismic risks [24].
5.1.1. Application of fragility curves
Fragility curves are frequently employed in the San Francisco Bay Area to assess the seismic susceptibility of various structures, including buildings, bridges and tunnels.
5.1.1.1. Analysis of soft rock tunnels
Comprehensive seismic risk assessments of the soft rock tunnels in the San Francisco Bay Area, including those used by the BART system, have been carried out using fragility curves. These tunnels' fragility curves were created by numerical simulations and sophisticated statistical techniques. The models incorporated site-specific geotechnical data including rock strength, deformation properties and tunnel design parameters [24]. The analysis revealed that soft rock tunnels exhibit a higher vulnerability to seismic events compared to those constructed in harder rock. The fragility curves indicated increased probabilities of significant deformation and structural damage under moderate to high seismic intensities [26].
5.1.1.2. Insights and innovations
The use of fragility curves in the San Francisco Bay Area has produced a number of noteworthy findings and advancements, such as:
The way that various structures, such bridges and tunnels, react to seismic occurrences has been better understood because to the application of fragility curves. This has led to more targeted and effective mitigation strategies [26].
The case study emphasizes how crucial it is to use actual data to validate theoretical models. The accuracy and refinement of fragility curves have been greatly enhanced by the observation of how structures behave during real earthquakes [63]. The region's vital infrastructure is now more resilient thanks to strengthening and retrofitting initiatives developed with the use of insights from fragility curve research [24].
5.2. Case study 2: the Tohoku Region, Japan
Japan's Tohoku region is in the Pacific Ring of Fire and it is most vulnerable to seismic events because of proximity to active subduction zones. Due to its experience with the devastating 2011 Tohoku earthquake and tsunami, the Tohoku area of Japan serves as an important case study for comprehending seismic risk. This event, also called the Great East Japan Earthquake, had a magnitude of 9.0, making it one of the greatest earthquakes ever recorded [70]. The region lies near the subduction zone, where the Pacific and North American plates are moving beneath one another. Significant seismic activity and earthquakes with a high magnitude are caused by this tectonic context [71]. Widespread devastation was brought about by the 2011 earthquake, including significant harm to transport infrastructure including tunnels, bridges and motorways. Significant economic and personal losses resulted from the subsequent tsunami, which made the devastation much worse [72].
5.2.1. Application of fragility curves
Fragility curves have been helpful in assessing the seismic susceptibility of various structures in the Tohoku area, with a focus on soft rock bridges, tunnels and other critical infrastructure.
5.2.1.1. Soft rock tunnels
Soft rock tunnels in the Tohoku region including those used in transportation networks were critically evaluated using fragility curves to assess their seismic performance during the 2011 earthquake. Fragility curves for soft rock tunnels were developed using post-earthquake damage assessments, numerical simulations and field observations. Key factors included soil-structure interaction, tunnel geometry and seismic intensity [73].
The analysis indicated that soft rock tunnels experienced significant deformation and damage, particularly in areas with poor soil conditions. The fragility curves revealed a higher probability of severe damage under intense shaking, emphasizing the need for improved design and retrofitting [74].
5.2.1.2. Insights and innovations
The application of fragility curves in the Tohoku region has provided several key insights and innovations:
The case study highlighted the critical need for improved seismic design and retrofitting of soft rock tunnels and bridges. The fragility curves demonstrated that many existing structures were not adequately prepared for the intensity of the 2011 earthquake [73].
The use of advanced numerical simulations and real-time damage data has improved the accuracy of fragility curves. These innovations allow for better prediction of structural performance and more effective risk management strategies [74].
The insights gained from the 2011 earthquake have informed new design standards and practices in Japan. Enhanced seismic design guidelines and retrofitting strategies have been developed to address the vulnerabilities revealed by the fragility curve analysis [75].
The San Francisco Bay Area case study and the Tohoku region demonstrate the necessity of assessing and improving the seismic vulnerability of infrastructure through the use of fragility curves. By analyzing real-world data and applying advanced modeling techniques, researchers and engineers have gained critical insights into structural performance and resilience. The advancements in modeling techniques and the insights gained from this case study have enabled the development of robust infrastructure regulations and enhanced seismic risk management in one of the world's seismically active regions.
6. Key findings and implications
A key component in comprehending and reducing the dangers associated with earthquakes, especially for vital infrastructure like soft rock tunnels, is the use of fragility curves to measure seismic vulnerability. The previous case studies that looked at the San Francisco Bay Area and the Tohoku Region showed how fragility curve analysis may be used to evaluate and improve a structure's ability to withstand seismic loads.
6.1. Sensitivity to geotechnical properties
The interaction between soil and structure, strength, stiffness and other geotechnical characteristics are important factors in determining how seismically vulnerable soft rock tunnels are. Sensitivity to these properties is a crucial factor in accurately assessing structural performance during seismic events.
6.1.1. Influence of soil properties on fragility curves
6.1.1.1. Soil strength and stiffness
The seismic response of tunnels is influenced by the basic geotechnical characteristics of soil stiffness and strength. These characteristics of tunnel pressure-saturated rock influence the seismic energy dissipation, deformation resistance and sustaining stability of the tunnel construction [76]. Variations in these properties can lead to significant differences in the structural performance and damage probabilities as indicated by fragility curves. Reliable fragility curves depend critically on soil strength and stiffness which directly affect stress, deformation and damage mechanisms in response to seismic events. The shear strength of the soil, which includes cohesion and friction angle, affects the tunnel’s stability during seismic events. The intrinsic shear strength of soil or rock independent of normal stress is cohesion. In weak or fractured soft rock formations, it is especially important to maintaining tunnel stability. The tendency towards shear failure under seismic loads is higher for a tunnel in clay stone with low cohesion (c=10-20 kPa) than for a tunnel in marl stone with greater cohesion (c=50-70 kPa). Shear strength components due to interparticle friction are represented by the friction angle. The amount of shear failure is reduced by higher friction angles. Soft shale tunnels, however, with ϕ=25° have a poorer resistance to seismic-induced shear failure compared to sandstone tunnels, ϕ=35°.
Redistribution of stresses around the tunnel under seismic loading is governed by soil strength and stiffness. As a result of weak claystone and low strength and stiffness, stress concentrations are high at the crown and invert, making cracking and spalling more likely. Higher soil strength generally improves the tunnel’s resistance to seismic forces, whereas lower soil strength can lead to increased deformation and damage [77]. The stiffness of the soil affects the tunnel's interaction with ground motion. High stiffness and damping dissipative soils more effectively dissipate seismic energy leading to lower probabilities of damage. Softer soils tend to amplify seismic waves, potentially increasing the level of shaking experienced by the tunnel. Conversely, stiffer soils can reduce the amplification effect and improve structural performance [78]. Soils in stiffer soils are able to deform lower during similar loading conditions, which results in a lower probability of structural damage. The connection shown in Eq. (16) can be used to predict how soil conditions affect fragility:
where: P(D≥d|IM,S) is the probability of exceeding damage state d given seismic intensity IM and soil properties S, μ(S) and σ(S) are the parameters of the log-normal distribution that vary with soil properties S, ϕ is the cumulative distribution function.
6.1.1.2. Soil-structure interaction
Another important aspect that affects how seismically vulnerable soft rock tunnels is soil-structure interaction (SSI) [79]. Soil-structure interaction (SSI) is defined as the complex dynamic interaction between a tunnel’s structural components (e.g., lining) and the surrounding soil or rock during seismic loading [80]. Stress, deformation patterns and failure mechanism of soft rock tunnels are found to be significantly influenced by this interaction. The distribution and transmission of seismic forces are influenced by the contact between the earth and the tunnel. Increased or reduced seismic forces during an earthquake might be the consequence of the dynamic reaction of the soil and tunnel system, depending on the kind of interaction. The tunnel lining's resistance to seismically generated stresses is determined by its stiffness, thickness and material characteristics. Poorly designed SSI can result in higher deformation and damage, while effective SSI design can mitigate some of the adverse effects [81]. Seismic wave propagation and interactions in tunnel lining depend on the strength, stiffness and damping characteristics of soft rock. Developing reliable fragility curves of tunnel against seismic accelerations requires an accurate modeling of SSI because SSI captures how the tunnel and its surrounding soil affect each other’s responses under seismic forces.
6.1.2. Sensitivity to rock properties
6.1.2.1. Rock strength and deformation
Key geomechanical features that are essential to the seismic performance of soft rock tunnels include rock strength and deformation characteristics. The seismic vulnerability of tunnels is significantly influenced by the strength and deformation characteristics of the rock used to construct them. The abilities of the rock mass to support tunnel structures, resist seismic loads and adapt to dynamic stresses without failure are controlled by these properties. Softer rock types exhibit different fragility characteristics compared to harder, more stable rocks. Fragility curves for tunnels in weaker, softer rock show higher probabilities of damage compared to those in stronger rock. The rock’s strength affects the tunnel's resistance to deformation and seismic stresses [82]. The redistribution of seismic forces around the tunnel is controlled by rock strength and deformation properties, which determine where there may be stress concentrations and potential failure zones. Under seismic loads, the dominant failure modes for rock, for example tensile cracking, shear failure or spalling is dependent on the rock properties. The connection expressed in Eq. (17) may be used to illustrate how rock strength affects fragility curves:
where: μr is the mean damage threshold for rock, δr is the adjustment factor for rock strength, σr is the standard deviation.
Since rock strength and deformation are absolutely critical to developing reliable fragility curves, being able to understand and accurately model these rock properties are integral to developing reliable stress redistribution, tunnel deformation and overall structural stability in seismic and multi-hazard scenarios.
6.1.2.2. Tunnel geometry and construction quality
Tunnel geometry and construction quality play a major role in determining the seismic performance and resilience of soft rock tunnels. The seismic susceptibility of the tunnel can also be influenced by its shape and the standard of construction. Factors such as tunnel diameter, lining thickness and construction quality are important in determining fragility.
Larger diameters and thicker linings generally provide greater resistance to seismic forces. Fragility curves are adjusted based on these parameters to reflect the structural performance accurately [73]. Table 5 summarizes how different tunnel geometries and construction qualities impact fragility curves, with variations in damage probabilities based on these factors.
Table 5Impact of tunnel geometry and construction quality on fragility curves
Geometry/quality | Damage state | Probability of exceeding damage state |
Small diameter, poor quality | Severe damage | 75 % |
Large diameter, good quality | Minor damage | 20 % |
Medium diameter, medium quality | Moderate damage | 50 % |
The distribution of seismic forces throughout the tunnel structure and surrounding rock is a function of geometry and construction quality. Under seismic loads, the tunnel’s ability to deform elastically or plastically depends on its geometric features and material quality. Failure modes such as cracking, spalling or collapse are caused by poor construction quality and unfavorable geometry. These factors must be accounted for in fragility curve development to produce realistic and site specific risk assessments.
6.1.3. Implications for seismic design and risk management
The sensitivity of fragility curves to geotechnical properties has significant implications for seismic design and risk management.
6.1.3.1. Design optimization
Design optimization is the systematic refinement of tunnel geometry, materials and support systems to enhance structural performance and reduce vulnerabilities to seismic and multi-hazard loading. The weaknesses of the surrounding rock in soft rock tunnels make optimization necessary to reduce stress concentrations, deformation and damage risks.
Tailored Design Solutions: Understanding the impact of soil properties allows for the design of tunnels and other structures that are better suited to local geotechnical conditions. This tailored approach can lead to more effective and efficient seismic design solutions [26].
Retrofitting Strategies: Insights into soil-structure interaction can guide the development of targeted retrofitting strategies. Engineers can improve the seismic resilience of existing structures by addressing certain vulnerabilities associated with soil conditions [24].
Fragility curves can be integrated into the design process to first identify optimal configurations which minimize damage probabilities and maximize resilience.
6.1.3.2. Risk management
Soft rock tunnel risk management is defined as the identification, assessment, mitigation and monitoring of risks in seismic and multi-hazard environments. This is a systematic framework that combines fragility curves to estimate damage probability and to develop effective measures to preempt or mitigate the effects on tunnel functionality, safety and resilience.
Improved Risk Assessment: By giving a more realistic picture of possible damage, adding geotechnical sensitivity to fragility curve analysis enhances risk assessments. Effective resource allocation and risk management effort prioritization depend on this knowledge [70].
Improved Emergency Planning: Knowledge of how soil properties influence seismic vulnerability supports better emergency planning and response strategies. By understanding potential failure modes and their triggers, authorities can develop more effective contingency plans [75].
The sensitivity of fragility curves to geotechnical properties underscores the importance of incorporating detailed soil and structural interaction data into seismic vulnerability assessments. Recent advancements in modeling and simulation techniques have provided deeper insights into how soil conditions affect structural performance during seismic events. These insights are crucial for optimizing design, enhancing retrofitting strategies and improving risk management practices, ultimately leading to more resilient infrastructure in earthquake-prone regions.
Fragility based risk assessment can help engineers, planners and policymakers to identify interventions to be applied for critical infrastructure, determine where to allocate limited resources and maintain the long term sustainability of the infrastructure.
6.2. Impact of seismic intensity
The degree of ground shaking during an earthquake is measured by seismic intensity, which has a big impact on how vulnerable structures are. Fragility curves, which display the probability of different damage levels as a function of seismic intensity, are essential for assessing this impact [51].
6.2.1. Understanding seismic intensity
Seismic intensity is frequently assessed using a variety of scales, such as the Modified Mercalli Intensity (MMI), Peak Ground Acceleration (PGA) and Peak Ground Velocity (PGV) scales. Each of these metrics offers a unique perspective on the possible harm that an earthquake might produce. [83].
a. A qualitative scale that evaluates an earthquake's impact by looking at damage and how people perceive it. According to Wood and Neumann (1931) [84], it goes from I (not felt) to XII (complete annihilation).
b. A quantitative measure of the maximum acceleration experienced by the ground during an earthquake, commonly used in structural engineering to assess potential damage [85].
c. The maximum ground movement velocity, which is linked to the danger of damage, particularly to non-structural parts, is measured [86].
6.2.2. Influence of seismic intensity on fragility curves
6.2.2.1. Fragility curves and seismic intensity
The fragility curves show how seismic intensity and the likelihood of a structure reaching or surpassing specific damage states are related [64]. In order to quantify seismic susceptibility, provide recommendations for risk assessment, and design for resilience in soft rock tunnels, these curves are crucial. Fragility curves are used to quantify the probability that a structure may achieve or exceed a specific damage condition as a function of seismic intensity [87]. Depending on how strong the seismic event was, the form and location of these curves might change dramatically. With increased seismic intensity, there is a greater chance that a structure may suffer from progressively worsening damage states such as progressing from mild to moderate and ultimately to severe. According to Zhao Y. et al. (2023) [88], fragility curves usually have a sigmoid form, with the chance of damage rising dramatically after a particular intensity threshold is surpassed. A log-logistic function may be used to represent the connection between earthquake intensity and the likelihood of reaching a certain damage state Eq. (18):
where: P(D≥d|IM) is the probability of exceeding damage state d, IM50 is the seismic intensity at which there is a 50 % probability of exceeding damage state d, β is the parameter controlling the curve’s steepness [14].
Soft rock tunnel resilience design is aided by fragility curves, which act as a vital link between seismic intensity and tunnel damage probability. Fragility curves, which combine diverse intensity measures, site specific calibrations and advanced modeling techniques, provide accurate and analytically actionable information related to seismic risk management.
6.2.2.2. Recent findings and novelties
As a result of developments in computer modeling, significant strides have been achieved in the modeling, monitoring and data analytics of fragility curves in soft rock tunnels in recent years. Recent research has provided new insights into the impact of seismic intensity on fragility curves, including:
Modeling progress has resulted in the creation of intensity-dependent fragility models that take temporal and spatial fluctuations in seismic intensity into consideration. These models provide more accurate predictions by incorporating real-time intensity data and historical earthquake records [89].
Peak Ground Acceleration (PGA), according to studies, is a crucial component in assessing how vulnerable soft rock tunnels are. High PGA values can lead to significant increases in damage probability, particularly in tunnels with suboptimal design or construction practices [24].
Table 6 summarizes recent findings related to seismic intensity and fragility curves, including key parameters and their effects on structural damage.
Table 6Recent findings on seismic intensity and fragility curves
Key parameter | Finding | Reference |
Intensity-dependent models | Improved accuracy with real-time intensity data | [89] |
Peak Ground Acceleration (PGA) | High PGA values increase damage probability significantly | [24] |
Log-Logistic Function | Effective in modeling damage state transitions with intensity | [88] |
6.2.3. Implications for engineering practice
6.2.3.1. Design and retrofitting
Enhancing the seismic and multi hazard resilience of soft rock tunnels requires design and retrofitting. Retrofitting strengthens existing tunnels, and effective design provides optimal structural performance under anticipated loads; however, fragility assessments identify vulnerabilities that retrofitting the tunnels to address.
Seismic Design Adjustments: Understanding the impact of seismic intensity on fragility curves informs adjustments in seismic design standards. Engineers can use this information to design structures that are more resilient to high-intensity earthquakes [26].
Retrofitting Prioritization: Fragility curves can help prioritize retrofitting efforts by identifying structures that are most vulnerable to high seismic intensities. According to Liu et al. (2018) [75], this targeted strategy guarantees that resources are concentrated on enhancing the resilience of the most vital and susceptible infrastructure.
Incorporation of the fragility curves into the design and retrofit processes enables engineers to identify the interventions to be made, minimize the damage probabilities and to attain safety and operational continuity.
6.2.3.2. Risk assessment and policy
Planning for seismic resistance in soft rock tunnels necessitates developing policies and conducting risk assessments. Policymaking converts this intelligence into recommended controls, standards and operational strategies. Risk assessment is the process of discovering, evaluating and prioritizing possible incident outcomes. Incorporating seismic intensity into fragility curve analysis improves the accuracy of risk assessments. This allows for better forecasting of potential damage and more effective risk management strategies [72].
Insights gained from fragility curve analysis can inform policy development, including building codes and standards that address the potential impacts of high seismic intensities. This helps in creating more resilient communities and infrastructure [86]. Policy recommendations based on how seismic intensity affects fragility curves are shown in Table 7.
Table 7Policy recommendations based on seismic intensity
Policy area | Recommendation | Impact |
Building codes | Update codes to account for high seismic intensity | Improved structural resilience |
Risk management strategies | Focus on structures with high fragility under intense shaking | More effective allocation of resources |
Emergency response planning | Develop plans for high-intensity scenarios | Better preparedness for severe seismic events |
The impact of seismic intensity on fragility curves is a crucial factor to take into account when assessing the seismic susceptibility of soft rock tunnels and other structures. Fragility curves are essential in both procedures because they offer probabilistic information on the likelihood of damage and aid in determining how to balance cost, functionality and safety. Recent developments in modeling and intensity impact knowledge have given important new insights into how different seismic intensity levels affect structure damage. These insights have significant implications for engineering practice, including design adjustments, retrofitting strategies, risk assessment and policy development, ultimately leading to more resilient infrastructure and improved earthquake preparedness.
6.3. Advances in data collection
Accurate data collection is the foundation of reliable seismic vulnerability assessments. Over the past decade, significant advancements in data collection technologies and methodologies have greatly enhanced the quality and quantity of data available for constructing fragility curves. This section explores these advancements, highlighting their impact on the assessment of seismic vulnerability in soft rock tunnels, with a focus on novel techniques, improved accuracy and their practical implications.
6.3.1. Modern data collection techniques
6.3.1.1. Remote sensing and geophysical surveys
Soft rock tunnels in seismically active regions are assessed using remote sensing and geophysical surveys essential to evaluation of their subsurface conditions and structural integrity. But these technologies allow for the non-invasive collection of data to gauge rock properties, as well as ground deformation and potential vulnerabilities.
Recent developments in remote sensing technology, such as satellite photography, Light Detection and Ranging (LiDAR) and Synthetic Aperture Radar (SAR), have completely changed the way data is gathered for seismic risk assessments. High-resolution topographical and geological data may be quickly acquired thanks to these technologies, which is essential for comprehending the underlying conditions around tunnels [90].
LiDAR systems, mounted on aircraft or drones, can capture detailed 3D maps of surface topography. The combination of 3D mapping and deformation patterns enables high precision hard point mapping of tunnel surfaces. This data is essential for identifying geological features that may influence seismic response, such as fault lines, fractures and soil layers [91].
SAR provides information on ground displacement by measuring changes in the Earth's surface before and after an earthquake. This data is essential for evaluating the effects of seismic waves on tunnel constructions, especially those situated in soft rock settings [42].
The remote sensing and geophysical surveys together with fragility curve development yield more accurate damage probability predictions and provide support to informed decision making on tunnel design, retrofitting and risk management.
6.3.1.2. In-Situ instrumentation
The in situ instrumentation serves a central role to tunnel and surrounding rock mass behavior monitoring under seismic and multiple hazard conditions. The deployment of advanced geotechnical instruments such as piezometers, inclinometers and accelerometers, within and around tunnels has greatly improved the quality of data collected on site. These instruments measure ground movement, pore water pressure and seismic acceleration, providing real-time data on the tunnel's response to seismic events [92].
Used to monitor pore water pressure, piezometers are particularly important in soft rock environments where water content can significantly affect soil behavior under seismic loading.
Inclinometers measure ground movement and deformation, particularly near tunnel portals or slopes which are crucial for assessing the stability of tunnel structures during and after an earthquake.
These instruments gauge seismic acceleration and are frequently positioned inside the tunnel structure as well as on the ground to record differential movement and offer information on the tunnel’s structural soundness [93].
Instrumentation gives analytically based fragility curves a greater degree of confidence through enhanced understanding of tunnel performance and real-time data on stress, deformation and environmental changes. This data driven approach guarantees that the risk assessment and resilience strategy is empirical observed based and enhances the predictive reliability of the probability of damage for soft rock tunnels.
6.3.2. Integration of big data and machine learning
The huge volumes of data gathered by contemporary sensors and remote sensing technologies may now be processed and interpreted in innovative ways thanks to the combination of big data analytics and machine learning techniques. These tools allow for more accurate and efficient development of fragility curves.
6.3.2.1. Big data analytics
To efficiently analyze and interpret the vast amount of data produced by contemporary monitoring systems, sophisticated data analytics techniques are needed. Big data analytics is made possible by sophisticated computational tools and algorithms that use extensive, intricate datasets to conduct analysis and derive useful information for decision-making. Big data platforms are capable of processing these massive datasets, finding relevant patterns and detecting connections that would not be visible using typical research approaches.
Data Fusion: Big data analytics enables the fusion of different data types such as seismic readings, satellite imagery and in-situ measurements, into a comprehensive dataset. This combined method increases the accuracy of fragility curves and offers a more comprehensive understanding of seismic risk [92].
Real-Time Data Processing: Real-time data processing advances enable the instantaneous investigation of seismic occurrences as they happen, yielding timely knowledge that may be utilized to dynamically alter fragility evaluations. This is particularly important in regions with frequent seismic activity [24].
Big data analytical investigations of these datasets reveal patterns and correlations in risk assessment, resilience planning and policy formulation for seismic and multi-hazard time tunnel infrastructure.
6.3.2.2. Machine learning applications
Machine learning (ML) is transforming the creation of fragility curves for soft rock tunnels by tackling large, complicated datasets and revealing nonlinear correlations between seismic intensity measurements, material characteristics and damage probability. Seismic data is increasingly being processed using machine learning techniques to create fragility curves that are more precise and predictive. These algorithms can analyze large datasets, identify complex patterns and predict structural responses to seismic events.
Supervised Learning Models: Supervised learning methods, such as support vector machines (SVM) and neural networks, are trained on historical seismic data to predict the probability of damage based on certain seismic intensities. These models can refine fragility curves by learning from past events and improving their predictive accuracy [94].
Unsupervised Learning for Anomaly Detection: Clustering algorithms and other unsupervised learning techniques can be used to detect anomalies in seismic data. These anomalies may point to novel structural reactions or vulnerabilities that had not been identified before. These insights can lead to the refinement of fragility curves and better risk assessments [95]. Eq. (19) is an expression of how machine learning is applied to the generation of fragility curves:
where: fML represents the machine learning model, X is the input vector of seismic intensity measures and structural characteristics, θrepresents the learned parameters of the model.
Fragility assessments with Machine Learning algorithms improve accuracy, efficiency and adaptability to a wider range of scenarios and conditions and allow engineers to predict seismic vulnerability. In order to improve risk assessment, resilience planning and real time decision making for tunnel infrastructure, these applications are essential.
6.3.3. Implications for fragility curve development
The creation of fragility curves and the evaluation of seismic risk are significantly impacted by the advances in data collecting.
6.3.3.1. Enhanced accuracy and reliability
Fragility curves are essential in seismic risk assessments and resilience planning of soft rock tunnels: they demand accuracy and robustness, as they actually determine the capacity of such risk assessment. Accuracy is enhanced because damage probabilities are close to real world conditions and reliability guarantees confidence in fragility predictions in a range of scenarios.
Improved Data Quality: More precise and trustworthy fragility curves are produced in part by the high-resolution data from contemporary remote sensing and in-situ monitoring technology. Seismic vulnerability evaluations are more accurate and less ambiguous thanks to this improved data quality [92].
Dynamic Updating of Fragility Curves: The combination of real-time data processing and machine learning enables the dynamic updating of fragility curves. According to Andreotti and Lai (2019) [24], this implies that fragility evaluations may be improved over time as new data become available, resulting in more precise forecasts and improved risk management techniques.
Significant improvements in the accuracy and reliability of fragility curves were obtained by advances in modeling techniques, data integration and validation methodologies and fragility curves are now indispensable tools to manage seismic risk.
6.3.3.2. Broader applicability and customization
Soft rock tunnel seismic risk assessment based on fragility curves is particularly important, and for a broader applicability and customization, fragility curves can be applied for a range of geotechnical, seismic and operational aspects.
Site-Specific Fragility Curves: Custom fragility curves that are suited to certain places and situations may be created because to the ability to gather comprehensive site-specific data. The relevance and application of fragility evaluations for various structure types and geological environments are enhanced by this customization [25].
Application to Complex Geological Conditions: Advances in data collection make it possible to apply fragility curve analysis to complex geological conditions, such as those found in soft rock tunnels. Assessing the susceptibility of such buildings requires the capacity to precisely capture the influence of local geology on seismic response [59].
Advances in data collection have significantly enhanced the development and application of fragility curves for seismic vulnerability assessment. The accuracy, dependability and application of fragility curves have increased due to advancements in big data analytics, machine learning, remote sensing and in-situ monitoring. This has resulted in more knowledgeable seismic risk assessments and mitigation plans. These developments represent a major step forward in our ability to access and manage the seismic vulnerability of infrastructure, particularly in complex geological settings such as soft rock tunnels.
Fragility curves explicitly incorporate site specific data and multi-hazard scenarios, with model tailoring to regional variations and structural quirks, which assists in obtaining more precise and actionable insights. These advancements make the fragility assessments still relevant and powerful to support global resilience initiative for tunnel infrastructure.
7. Conclusions
7.1. Summary of key findings
The application of fragility curves for the evaluation of seismic susceptibility is a crucial technique for identifying the potential impacts of earthquakes on soft rock tunnels. Several facets of fragility curve generation were examined and used in this study, emphasizing the particular difficulties presented by soft rock settings.
a. Development of Fragility Curves: The process of developing fragility curves for soft rock tunnels involves a comprehensive understanding of seismic demands and structural capacities. This includes the use of sophisticated numerical models, empirical data and advanced statistical techniques to capture the complex interactions between seismic forces and tunnel behavior.
b. Incorporation of Soft Rock Characteristics: Significant difficulties in earthquake design arise from the special geotechnical characteristics of soft rock, such as its great deformability, low shear strength and weathering vulnerability. The incorporation of these characteristics into fragility curves is essential for accurately predicting the seismic vulnerability of tunnels, and recent advances have enabled more precise modeling of these factors.
c. Case Studies and Practical Applications: The benefits and practical challenges of these models have been clarified by the use of fragility curves in real-world settings, such as the San Francisco Bay Area and the Tohoku Region of Japan. These case studies have illustrated how crucial it is to take into account the unique features of the infrastructure, past seismic activity and local geological conditions when creating and using fragility curves.
7.2. Future directions
There are still some areas that require further research and development, despite the fact that the use of fragility curves to assess the seismic susceptibility of soft rock tunnels has greatly advanced:
a. Machine Learning and AI Integration: Artificial intelligence (AI) and machine learning applications in fragility curve development are still in their infancy. Future research should focus on refining these models, particularly in terms of improving their interpretability and reliability. Additionally, the use of AI for predictive maintenance and early warning systems in tunnel infrastructure could be a promising area of exploration.
b. Long-Term Monitoring and Data Collection: There is a need for long-term monitoring of tunnels in seismic regions to collect comprehensive datasets that can be used to validate and refine fragility curves. This includes the continuous monitoring of tunnel conditions, seismic activity and environmental factors over extended periods.
c. Impact of Climate Change: As climate change is expected to alter seismic patterns and intensify natural hazards, future research should investigate how these changes might impact the seismic vulnerability of soft rock tunnels. This would include creating fragility curves that take changing earthquake hazards into consideration in light of climate change.
References
-
S. L. Kramer, Geotechnical Earthquake Engineering. Harlow, Essex: Pearson Education, 2014.
-
W. Qiu, G. Huang, H. Zhou, and W. Xu, “Seismic vulnerability analysis of rock mountain tunnel,” International Journal of Geomechanics, Vol. 18, No. 3, Mar. 2018, https://doi.org/10.1061/(asce)gm.1943-5622.0001080
-
A. Ansari, K. S. Thadagani, K. Seshagiri Rao, S. Shekhar, and A. E. Alluqmani, “Assessing seismic vulnerability in metro systems through numerical modeling: enhancing the sustainability and resilience of urban underground utilities (3U),” Innovative Infrastructure Solutions, Vol. 9, No. 10, Sep. 2024, https://doi.org/10.1007/s41062-024-01685-1
-
C. Xia, C. Zhou, F. Zhu, Z. Liu, and G. Cui, “The critical indicator of red-bed soft rocks in deterioration process induced by water basing on renormalization group theory,” Applied Sciences, Vol. 11, No. 17, p. 7968, Aug. 2021, https://doi.org/10.3390/app11177968
-
R. Sterling et al., “Sustainability issues for underground space in urban areas,” Proceedings of the Institution of Civil Engineers – Urban Design and Planning, Vol. 165, No. 4, pp. 241–254, Dec. 2012, https://doi.org/10.1680/udap.10.00020
-
L. M. Krieger and M. Gafni, “25 years after loma Prieta: bay area infrastructure is safer, but still on shaky ground,” Contra Costa Times, 2014.
-
X. Wu and N. Lv, “Seismic performance of soft rock tunnel under composite support conditions,” Journal of Vibroengineering, Vol. 26, No. 3, pp. 643–656, May 2024, https://doi.org/10.21595/jve.2023.23565
-
Q. Yang, P. Geng, L. Wang, G. Liu, and R. Tang, “Study on asphalt-cement isolation layer for shield tunnels using seismic fragility curves,” Journal of Earthquake Engineering, Vol. 27, No. 9, pp. 2338–2357, Jul. 2023, https://doi.org/10.1080/13632469.2022.2113003
-
J. E. Padgett and R. Desroches, “Methodology for the development of analytical fragility curves for retrofitted bridges,” Earthquake Engineering and Structural Dynamics, Vol. 37, No. 8, pp. 1157–1174, Jul. 2008, https://doi.org/10.1002/eqe.801
-
A. Taslimi, “Probabilistic simulation-based evaluation of the effect of near-field spatially varying ground motions on distributed infrastructure systems,” University of Nevada, Reno, 2024.
-
L. Cheng, C. Qiu, and X. Du, “Comparative seismic analysis of frames with shape memory alloy slip friction dampers,” Journal of Constructional Steel Research, Vol. 222, p. 108969, Nov. 2024, https://doi.org/10.1016/j.jcsr.2024.108969
-
K. Mackie and B. Stojadinovic, “Residual displacement and post-earthquake capacity of reinforced concrete bridges,” in 13th World Conference on Earthquake Engineering, 2004.
-
W. Guo, K. Wang, W. Yin, B. Zhang, and G. Lu, “Research on seismic excitation direction of double-deck curved bridges: A probabilistic method based on the random forest algorithm,” Structures, Vol. 39, pp. 705–719, May 2022, https://doi.org/10.1016/j.istruc.2022.03.066
-
E. Choi, J. Park, S.-J. Yoon, D.-H. Choi, and C. Park, “Comparison of seismic performance of three restrainers for multiple-span bridges using fragility analysis,” Nonlinear Dynamics, Vol. 61, No. 1-2, pp. 83–99, Dec. 2009, https://doi.org/10.1007/s11071-009-9633-6
-
R. Sarkar and K. Pareek, “Influence of stratification and assessment of fragility curves for mountain tunnels,” Proceedings of the Institution of Civil Engineers – Geotechnical Engineering, Vol. 174, No. 3, pp. 279–290, Jun. 2021, https://doi.org/10.1680/jgeen.19.00134
-
S. J. Vaziri, R. Vahdani, and O. Souri, “Seismic evaluation of BRBF steel structures with L-shaped irregular plan considering soil-structure interaction,” Bulletin of Earthquake Engineering, Vol. 22, No. 10, pp. 5347–5377, Jul. 2024, https://doi.org/10.1007/s10518-024-01963-4
-
S. D. Werner, R. Desroches, G. J. Rix, and A. Shafieezadeh, “Fragility models for container cargo wharves,” in Technical Council on Lifeline Earthquake Engineering Conference (TCLEE) 2009, pp. 1–12, Jun. 2009, https://doi.org/10.1061/41050(357)81
-
H. Azizi-Bondarabadi, “Analytical and empirical seismic fragility analysis of irregular URM buildings with box behaviour,” Universidade do Minho, Portugal, 2018.
-
A. Naseem, M. Kashif, K. Schotte, and H. de Backer, “Seismic fragility curves of combined multiple tunnel complexes in soft soils,” Journal of Earthquake and Tsunami, Vol. 17, No. 6, Nov. 2023, https://doi.org/10.1142/s1793431123500264
-
K. Ramanathan, R. Desroches, and J. E. Padgett, “A comparison of pre- and post-seismic design considerations in moderate seismic zones through the fragility assessment of multispan bridge classes,” Engineering Structures, Vol. 45, pp. 559–573, Dec. 2012, https://doi.org/10.1016/j.engstruct.2012.07.004
-
A. Faisal, A. Anshari, F. M. Nazri, and M. M. Kassem, “Near-collapse probability of RC frames in indonesia under repeated earthquakes containing fling-step effect,” International Journal of Technology, Vol. 14, No. 2, p. 339, Apr. 2023, https://doi.org/10.14716/ijtech.v14i2.4989
-
C. Amendola and D. Pitilakis, “Large-scale damage assessment of buildings considering SSI and site amplification: The case of Thessaloniki,” Earthquake Spectra, Vol. 40, No. 2, pp. 1324–1352, Jan. 2024, https://doi.org/10.1177/87552930231220376
-
S. T. Karapetrou, S. D. Fotopoulou, and K. D. Pitilakis, “Seismic vulnerability assessment of high-rise non-ductile RC buildings considering soil-structure interaction effects,” Soil Dynamics and Earthquake Engineering, Vol. 73, pp. 42–57, Jun. 2015, https://doi.org/10.1016/j.soildyn.2015.02.016
-
G. Andreotti and C. G. Lai, “Use of fragility curves to assess the seismic vulnerability in the risk analysis of mountain tunnels,” Tunnelling and Underground Space Technology, Vol. 91, p. 103008, Sep. 2019, https://doi.org/10.1016/j.tust.2019.103008
-
M. Jamshidi Avanaki, A. Hoseini, S. Vahdani, C. de Santos, and A. de La Fuente, “Seismic fragility curves for vulnerability assessment of steel fiber reinforced concrete segmental tunnel linings,” Tunnelling and Underground Space Technology, Vol. 78, pp. 259–274, Aug. 2018, https://doi.org/10.1016/j.tust.2018.04.032
-
S. Mangalathu and J.S. Jeon, “Stripe‐based fragility analysis of multispan concrete bridge classes using machine learning techniques,” Earthquake Engineering and Structural Dynamics, Vol. 48, No. 11, pp. 1238–1255, Jun. 2019, https://doi.org/10.1002/eqe.3183
-
Z. Akakza, A. Samet, and Z. Boutaraa, “Analysis of tunnels seismic behaviour: Consideration of the structure geometry and site conditions,” in MATEC Web of Conferences, Vol. 394, p. 03006, Apr. 2024, https://doi.org/10.1051/matecconf/202439403006
-
H. Karaca, “Estimation of potential earthquake losses for the evaluation of earthquake insurance risks,” Middle East Technical University, Turkey, 2014.
-
D. M. Boore, J. P. Stewart, E. Seyhan, and G. M. Atkinson, “NGA-West2 equations for predicting PGA, PGV, and 5% damped PSA for shallow crustal earthquakes,” Earthquake Spectra, Vol. 30, No. 3, pp. 1057–1085, Aug. 2014, https://doi.org/10.1193/070113eqs184m
-
Z. Wang, J. E. Padgett, and L. Dueñas-Osorio, “Influence of vertical ground motions on the seismic fragility modeling of a bridge-soil-foundation system,” Earthquake Spectra, Vol. 29, No. 3, pp. 937–962, Aug. 2013, https://doi.org/10.1193/1.4000170
-
E. M. Ün, “An integrated seismic loss estimation methodology: a case study in northwestern Turkey,” Middle East Technical University, Turkey, 2011.
-
G. M. Atkinson and D. M. Boore, “Erratum to empirical ground-motion relations for subduction zone earthquakes and their application to Cascadia and other regions,” Bulletin of the Seismological Society of America, Vol. 98, No. 5, pp. 2567–2569, Oct. 2008, https://doi.org/10.1785/0120080108
-
K. Gür, “Ground motion prediction equations based on simulated ground motions,” Middle East Technical University, Turkey, 2018.
-
X.-W. Zheng, H.-N. Li, and Z.-Q. Shi, “Hybrid AI-Bayesian-based demand models and fragility estimates for tall buildings against multi-hazard of earthquakes and winds,” Thin-Walled Structures, Vol. 187, p. 110749, Jun. 2023, https://doi.org/10.1016/j.tws.2023.110749
-
J. Zhang, Z. He, and X. Yu, “Three-dimensional finite element modeling of soft rock tunnel with large section: a case study,” Frontiers in Physics, Vol. 8, Oct. 2020, https://doi.org/10.3389/fphy.2020.577787
-
M. Patil, D. Choudhury, P. G. Ranjith, and J. Zhao, “Behavior of shallow tunnel in soft soil under seismic conditions,” Tunnelling and Underground Space Technology, Vol. 82, pp. 30–38, Dec. 2018, https://doi.org/10.1016/j.tust.2018.04.040
-
S. E. Janous, M. A. Abid, A. Afras, and A. E. Ghoulbzouri, “Soil-structure interaction influence on the seismic performance of buildings,” Civil Engineering and Architecture, Vol. 12, No. 2, pp. 798–813, Mar. 2024, https://doi.org/10.13189/cea.2024.120210
-
A. Garg, B. Yuan, and Y. Zhang, Structural Seismic and Civil Engineering Research. London: CRC Press, 2023, https://doi.org/10.1201/9781003384342
-
M. Dyanati, Q. Huang, and D. Roke, “Sensitivity analysis of seismic performance assessment and consequent impacts on loss analysis,” Bulletin of Earthquake Engineering, Vol. 15, No. 11, pp. 4751–4790, May 2017, https://doi.org/10.1007/s10518-017-0150-6
-
W. Huang, Y. Shi, and W. Zhou, “Research on the application of artificial intelligence technology in risk management of commercial banks,” in Applied Economics and Policy Studies, pp. 1606–1615, Feb. 2024, https://doi.org/10.1007/978-981-97-0523-8_145
-
Q. Chen et al., “Assessment of the physical vulnerability of buildings affected by slow-moving landslides,” Natural Hazards and Earth System Sciences, Vol. 20, No. 9, pp. 2547–2565, Sep. 2020, https://doi.org/10.5194/nhess-20-2547-2020
-
C. J. van Westen, E. Castellanos, and S. L. Kuriakose, “Spatial data for landslide susceptibility, hazard, and vulnerability assessment: An overview,” Engineering Geology, Vol. 102, No. 3-4, pp. 112–131, Dec. 2008, https://doi.org/10.1016/j.enggeo.2008.03.010
-
E. Saleh, “The development of fragility curves using calibrated probabilistic classifiers,” Structures, Vol. 64, p. 106618, Jun. 2024, https://doi.org/10.1016/j.istruc.2024.106618
-
G. C. Marano, R. Greco, and M. Mezzina, “Stochastic approach for analytical fragility curves,” KSCE Journal of Civil Engineering, Vol. 12, No. 5, pp. 305–312, Sep. 2008, https://doi.org/10.1007/s12205-008-0305-8
-
F. Yang, Y. Zhang, T. Zheng, and B. Li, “Application of pushover analysis in bridge piers,” in International Forum on Energy, Environment and Sustainable Development, pp. 218–223, Jan. 2016, https://doi.org/10.2991/ifeesd-16.2016.38
-
J. P. Camayang, O. Dela Cruz, and R. Grutas, “Integrating building – and site-specific and generic fragility curves into seismic risk assessment: a PRISMA-based analysis of methodologies and applications,” CivilEng, Vol. 5, No. 4, pp. 1011–1041, Nov. 2024, https://doi.org/10.3390/civileng5040050
-
X. Hu, Z. Zhou, H. Chen, and Y. Ren, “Seismic fragility analysis of tunnels with different buried depths in a soft soil,” Sustainability, Vol. 12, No. 3, p. 892, Jan. 2020, https://doi.org/10.3390/su12030892
-
A. Urlainis and I. M. Shohet, “A comprehensive approach to earthquake-resilient infrastructure: integrating maintenance with seismic fragility curves,” Buildings, Vol. 13, No. 9, p. 2265, Sep. 2023, https://doi.org/10.3390/buildings13092265
-
S. Nirandjan et al., “Physical vulnerability database for critical infrastructure multi-hazard risk assessments – a systematic review and data collection,” Natural Hazards and Earth System Sciences, Vol. 38, 2024.
-
H. Zhou, C. Xia, X. Yu, G. Zheng, X. Liu, and Z. Shi, “Seismic resilience evaluation of granular column-supported road embankments on liquefiable soils,” Soil Dynamics and Earthquake Engineering, Vol. 181, p. 108664, Jun. 2024, https://doi.org/10.1016/j.soildyn.2024.108664
-
A. Athanasiou, L. Tirca, and T. Stathopoulos, “Performance-based wind and earthquake design framework for tall steel buildings with ductile detailing,” Journal of Wind Engineering and Industrial Aerodynamics, Vol. 240, p. 105492, Sep. 2023, https://doi.org/10.1016/j.jweia.2023.105492
-
S. Xiao, X. Bu, Y. Chen, and X. Wang, “Investigating the damage-based seismic performance of the blind bolt-connected steel framework,” Structures, Vol. 69, p. 107388, Nov. 2024, https://doi.org/10.1016/j.istruc.2024.107388
-
F. Wu et al., “Performance‐based seismic fragility and residual seismic resistance study of a long‐span suspension bridge,” Advances in Civil Engineering, Vol. 2020, No. 1, pp. 1–16, Sep. 2020, https://doi.org/10.1155/2020/8822955
-
R. Sainct, C. Feau, J.-M. Martinez, and J. Garnier, “Efficient methodology for seismic fragility curves estimation by active learning on support vector machines,” Structural Safety, Vol. 86, p. 101972, Sep. 2020, https://doi.org/10.1016/j.strusafe.2020.101972
-
W. Chen and L. Zhang, “Building vulnerability assessment in seismic areas using ensemble learning: A Nepal case study,” Journal of Cleaner Production, Vol. 350, p. 131418, May 2022, https://doi.org/10.1016/j.jclepro.2022.131418
-
B. Wei et al., “Seismic response prediction and fragility assessment of high-speed railway bridges using machine learning technology,” Structures, Vol. 66, p. 106845, Aug. 2024, https://doi.org/10.1016/j.istruc.2024.106845
-
A. van Biesbroeck, C. Gauchy, C. Feau, and J. Garnier, “Reference prior for Bayesian estimation of seismic fragility curves,” Probabilistic Engineering Mechanics, Vol. 76, p. 103622, Apr. 2024, https://doi.org/10.1016/j.probengmech.2024.103622
-
L. Haoze, “Seismic vulnerability assessment in tunnels: a review,” Advances in Research, Vol. 25, No. 1, pp. 1–12, Jan. 2024, https://doi.org/10.9734/air/2024/v25i11012
-
Y. Liu, Y. Gu, and H. Zhang, “Seismic risk assessment and damage analysis: emerging trends and new developments,” Journal of Safety Science and Resilience, Vol. 5, No. 3, pp. 365–381, Sep. 2024, https://doi.org/10.1016/j.jnlssr.2024.04.005
-
T. Benz and S. Nordal, Numerical Methods in Geotechnical Engineering – (NUMGE 2010). CRC Press, 2010.
-
J. Park, P. Towashiraporn, J. I. Craig, and B. J. Goodno, “Seismic fragility analysis of low-rise unreinforced masonry structures,” Engineering Structures, Vol. 31, No. 1, pp. 125–137, Jan. 2009, https://doi.org/10.1016/j.engstruct.2008.07.021
-
S. S. Bora, F. Scherbaum, N. Kuehn, P. Stafford, and B. Edwards, “Development of a response spectral ground‐motion prediction equation (GMPE) for seismic‐hazard analysis from empirical Fourier spectral and duration models,” Bulletin of the Seismological Society of America, Vol. 105, No. 4, pp. 2192–2218, Jul. 2015, https://doi.org/10.1785/0120140297
-
Z.-K. Huang, K. Pitilakis, G. Tsinidis, S. Argyroudis, and D.-M. Zhang, “Seismic vulnerability of circular tunnels in soft soil deposits: The case of Shanghai metropolitan system,” Tunnelling and Underground Space Technology, Vol. 98, p. 103341, Apr. 2020, https://doi.org/10.1016/j.tust.2020.103341
-
A. M. El‐Maissi, S. A. Argyroudis, M. M. Kassem, and F. Mohamed Nazri, “Development of intrinsic seismic vulnerability index (ISVI) for assessing roadway system and its assets framework,” MethodsX, Vol. 9, p. 101818, Jan. 2022, https://doi.org/10.1016/j.mex.2022.101818
-
R. Koenker and G. Bassett, “Regression quantiles,” Econometrica, Vol. 46, No. 1, p. 33, Jan. 1978, https://doi.org/10.2307/1913643
-
J.-G. Xu, G. Wu, D.-C. Feng, and J.-J. Fan, “Probabilistic multi-hazard fragility analysis of RC bridges under earthquake-tsunami sequential events,” Engineering Structures, Vol. 238, p. 112250, Jul. 2021, https://doi.org/10.1016/j.engstruct.2021.112250
-
A. Gelman, Bayesian Data Analysis. Boca Raton, Fla.: Chapman and Hall/Crc, 2004.
-
A. Pandey, A. Pratap Singh, and V. Kumar, “Design and optimization of circularly polarized dielectric resonator-based MIMO antenna using machine learning for 5G Sub-6 GHz,” AEU – International Journal of Electronics and Communications, Vol. 162, p. 154558, Apr. 2023, https://doi.org/10.1016/j.aeue.2023.154558
-
O. Bilginer, H. Karaman, and J. W. van de Lindt, “Development of seismic fragilities for a base station steel lattice cellular tower,” Heliyon, Vol. 9, No. 10, p. e20582, Oct. 2023, https://doi.org/10.1016/j.heliyon.2023.e20582
-
K. Tokimatsu, S. Tamura, H. Suzuki, and K. Katsumata, “Building damage associated with geotechnical problems in the 2011 Tohoku Pacific earthquake,” Soils and Foundations, Vol. 52, No. 5, pp. 956–974, Oct. 2012, https://doi.org/10.1016/j.sandf.2012.11.014
-
Y. Tanioka and K. Satake, “Detailed coseismic slip distribution of the 1944 Tonankai earthquake estimated from tsunami waveforms,” Geophysical Research Letters, Vol. 28, No. 6, pp. 1075–1078, Mar. 2001, https://doi.org/10.1029/2000gl012284
-
S. Yasuda, K. Harada, and K. Ishikawa, “Damage to structures in Chiba prefecture during the 2011 Tohoku-Pacific Ocean earthquake,” Japanese Geotechnical Journal, Vol. 7, No. 1, pp. 103–115, Jan. 2012, https://doi.org/10.3208/jgs.7.103
-
G. Tsinidis, A. Karatzetzou, S. Stefanidou, and O. Markogiannaki, “Developments in seismic vulnerability assessment of tunnels and underground structures,” Geotechnics, Vol. 2, No. 1, pp. 209–249, Feb. 2022, https://doi.org/10.3390/geotechnics2010010
-
Y. Kajitani and H. Tatano, “Estimation of production capacity loss rate after the Great East Japan earthquake and Tsunami in 2011,” Economic Systems Research, Vol. 26, No. 1, pp. 13–38, Jan. 2014, https://doi.org/10.1080/09535314.2013.872081
-
W. Liu, H. Xu, W. He, and Q. Yang, “Static test and seismic dynamic response of an innovative 3D seismic isolation system,” Journal of Structural Engineering, Vol. 144, No. 12, Dec. 2018, https://doi.org/10.1061/(asce)st.1943-541x.0002195
-
G. Zhao, P. Gardoni, L. Xu, F. Shu, and L. Xie, “Probabilistic seismic demand models for circular tunnels subjected to transversal seismic load,” Tunnelling and Underground Space Technology, Vol. 125, p. 104527, Jul. 2022, https://doi.org/10.1016/j.tust.2022.104527
-
F. Tatsuoka, M. Tateyama, J. Koseki, and T. Yonezawa, “Geosynthetic-reinforced soil structures for railways in Japan,” Transportation Infrastructure Geotechnology, Vol. 1, No. 1, pp. 3–53, Feb. 2014, https://doi.org/10.1007/s40515-013-0001-0
-
R. W. Boulanger, C. J. Curras, B. L. Kutter, D. W. Wilson, and A. Abghari, “Seismic soil-pile-structure interaction experiments and analyses,” Journal of Geotechnical and Geoenvironmental Engineering, Vol. 125, No. 9, pp. 750–759, Sep. 1999, https://doi.org/10.1061/(asce)1090-0241(1999)125:9(750)
-
R. Barman, L. Halder, S. C. Dutta, R. P. Sharma, and S. Kumar, “Effect of soil flexibility on seismic fragility of code-designed reinforced concrete framed buildings,” Structural Engineering International, Vol. 30, No. 2, pp. 270–279, Apr. 2020, https://doi.org/10.1080/10168664.2019.1661806
-
S. El Janous and A. El Ghoulbzouri, “Evaluation of the seismic susceptibility in the north of Morocco considering the soil-structure interaction,” Iranian Journal of Science and Technology, Transactions of Civil Engineering, Jun. 2024, https://doi.org/10.1007/s40996-024-01474-x
-
I. Oz, S. M. Senel, M. Palanci, and A. Kalkan, “Effect of soil-structure interaction on the seismic response of existing low and mid-rise RC buildings,” Applied Sciences, Vol. 10, No. 23, p. 8357, Nov. 2020, https://doi.org/10.3390/app10238357
-
E. Hoek and E. T. Brown, “Empirical strength criterion for rock masses,” Journal of the Geotechnical Engineering Division, Vol. 106, No. 9, pp. 1013–1035, Sep. 1980, https://doi.org/10.1061/ajgeb6.0001029
-
Y. Xu, “An earthquake strong motion database in Taiwan and its applications to earthquake studies,” The Hong Kong University of Science and Technology Library, Sep. 2023.
-
H. O. Wood and F. Neumann, “Modified Mercalli intensity scale of 1931,” Bulletin of the Seismological Society of America, Vol. 21, No. 4, pp. 277–283, Dec. 1931, https://doi.org/10.1785/bssa0210040277
-
J. J. Bommer and N. A. Abrahamson, “Why do modern probabilistic seismic-hazard analyses often lead to increased hazard estimates?,” Bulletin of the Seismological Society of America, Vol. 96, No. 6, pp. 1967–1977, Dec. 2006, https://doi.org/10.1785/0120060043
-
X. Hu, Y. Zhang, and N. S. Moghaddasi B., “Seismic performance of reinforced concrete frames retrofitted with self-centering hybrid wall,” Advances in Structural Engineering, Vol. 15, No. 12, pp. 2131–2143, Nov. 2016, https://doi.org/10.1260/1369-4332.15.12.2131
-
S. Paul and S. K. Deb, “Seismic vulnerability assessment of exterior semi-rigid RBS-column connections using experimental fragility functions,” Innovative Infrastructure Solutions, Vol. 8, No. 4, Apr. 2023, https://doi.org/10.1007/s41062-023-01100-1
-
Y. Zhao, M. Gong, J. Tan, Z. Zuo, and J. Jia, “New ground-motion prediction equations for significant duration of subduction intraslab and interface earthquakes in Japan,” Bulletin of Earthquake Engineering, Vol. 21, No. 12, pp. 5375–5401, Aug. 2023, https://doi.org/10.1007/s10518-023-01749-0
-
Z. Cheng, C. Peng, and M. Chen, “Real-time seismic intensity measurements prediction for earthquake early warning: a systematic literature review,” Sensors, Vol. 23, No. 11, p. 5052, May 2023, https://doi.org/10.3390/s23115052
-
R. W. Jibson, E. L. Harp, and J. A. Michael, “A method for producing digital probabilistic seismic landslide hazard maps,” Engineering Geology, Vol. 58, No. 3-4, pp. 271–289, Dec. 2000, https://doi.org/10.1016/s0013-7952(00)00039-9
-
Y. Heo and S. K. Kunnath, “Damage-based seismic performance evaluation of reinforced concrete frames,” International Journal of Concrete Structures and Materials, Vol. 7, No. 3, pp. 175–182, Sep. 2013, https://doi.org/10.1007/s40069-013-0046-z
-
L. Wang, P. Geng, J. Chen, and T. Wang, “Machine learning-based fragility analysis of tunnel structure under different impulsive seismic actions,” Tunnelling and Underground Space Technology, Vol. 133, p. 104953, Mar. 2023, https://doi.org/10.1016/j.tust.2022.104953
-
V. Cervenka, J. Cervenka, and L. Kadlec, “Model uncertainties in numerical simulations of reinforced concrete structures,” Structural Concrete, Vol. 19, No. 6, pp. 2004–2016, Jul. 2018, https://doi.org/10.1002/suco.201700287
-
D. Forcellini and S. Alzabeebee, “Seismic fragility assessment of geotechnical seismic isolation (GSI) for bridge configuration,” Bulletin of Earthquake Engineering, Vol. 21, No. 8, pp. 3969–3990, Feb. 2022, https://doi.org/10.1007/s10518-022-01356-5
-
F. Kazemi, N. Asgarkhani, and R. Jankowski, “Machine learning-based seismic fragility and seismic vulnerability assessment of reinforced concrete structures,” Soil Dynamics and Earthquake Engineering, Vol. 166, p. 107761, Mar. 2023, https://doi.org/10.1016/j.soildyn.2023.107761
About this article

The authors have not disclosed any funding.
The datasets generated during and/or analyzed during the current study are available from the corresponding author on reasonable request.
The author declares that there is no conflict of interest.
