Abstract
The wheel-coupled road simulation test rig has a wide range of applications in whole-vehicle test. Obtaining the drive spectrum of the wheel coupling road simulation rig quickly and accurately has always been a key issue in the industry. This paper reviewed the basic theory of test rig, and discussed the feasibility of the rig's standard spectrum. Then, this paper took a domestic car model as the test vehicle and collected actual road data from the Yancheng test site. By analyzing and processing these data, the paper verified the feasibility of the standard load spectrum for the wheel-coupled test rig. This research provides theoretical and empirical support for the development of a standard load spectrum for wheel-coupled road simulation rigs.
1. Introduction
The wheel-coupled road simulation test equipment has significant advantages. Firstly, it can achieve rapid verification, significantly shorten the R&D cycle, and speed up product launches. Secondly, the equipment can conduct a preliminary test in the early stages of automotive development, discover design defects promptly, and optimize product performance.
However, the system must be capable of swiftly and precisely capturing the load spectrum. Traditional load spectrum acquisition methods depend on actual vehicle road load data, which is time-consuming, labor-intensive, and often inaccessible during the early development stages. Therefore, there is an urgent need to implement a standard load spectrum that meets the needs of the automotive R&D process and can verify power train-less models without relying on actual road load data [1-3].
This paper analyzed and verified the feasibility of developing a standard load spectrum based on the wheel-coupled road simulation rig. Finally, the thesis proposed a new method for obtaining a load spectrum, which has quickly and accurately acquired time-domain excitation signals and provided theoretical and empirical support for early-stage verification in automotive R&D.
2. Basic theory
2.1. Wheel-coupled road simulation test rig introduction
The wheel-coupled road simulation test rig is crucial for indoor road tests, replicating real driving conditions in a lab. It helps assess vehicle dynamics, suspension, tires, and other components, leading to safer, more efficient, and durable vehicle development.
2.2. Hardware composition
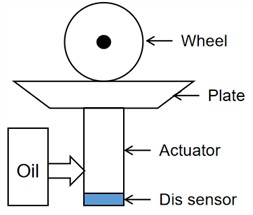
Hydraulic Actuators and Plate: The actuators and plate are in direct contact with the test vehicle's tires, simulating road unevenness through the movement of the hydraulic cylinders.
Hydraulic Pump Source: Provides the hydraulic energy required by the system, it is typically composed of a hydraulic pump group and an accumulator combined with the oil supply.
Fig. 1Schematic diagram of a wheel-coupled road simulation test rig
2.3. Main software
Servo Control System: The servo control system is the core of the road simulation test rig, responsible for receiving control signals and precisely controlling the movement of the hydraulic actuators to achieve accurate excitation of the vehicle.
Computer and Software: The computer system and the associated software package are used for human-machine interaction, to carry out test planning, setting, control, monitoring, and management, as well as data acquisition and analysis.
Control Algorithm: Includes servo control methods and identification iterative control methods, used for achieving accurate reproduction of road simulation waveforms.
2.4. Main applications
Wheel-coupled test rigs are essential in the automotive industry, particularly for evaluating vehicle durability. They simulate real-world conditions to test vehicle longevity, helping manufacturers identify weaknesses and improve durability, ensuring vehicles can handle daily use.
2.5. Working principle
The wheel-coupled road simulation test rig utilizes a four-poster structure to simulate the impact of real road load on automotive. Initially, road load data is collected using an accelerometer on the test vehicle. Subsequently, the RPC (Remote Parameter Control) technology is employed to edit and reproduce the signal. The test system first establishes a model between the rig and the whole vehicle and then generates the driving signal. Then, through an iteration process, the driving signal is gradually refined until the error between the rig’s output signal and the target signal collected from the actual road falls within the required range. This process ensures that the necessary driving signal is obtained [4-5].
Fig. 2Principle of iteration
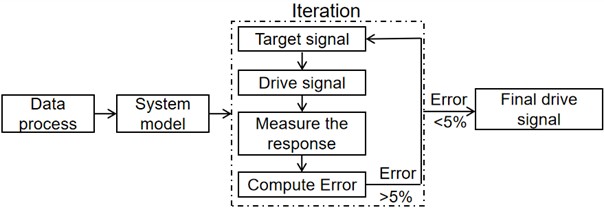
The wheel-coupled road simulation test rig works by: 1) collecting road load data, 2) creating a test model and drive signal, and 3) iterating to refine the signal until the rig's output matches the target signal within an acceptable error margin. This ensures the test vehicle experiences road-like load excitation [6-7].
The wheel-coupled test rig aims to mimic real road conditions by capturing and processing signals. It doesn't restrict the test vehicle and can only replicate vertical loads from the test track. On straight roads, tire-road contact allows using road roughness as a driving signal. However, on uneven roads, tire contact is incomplete, and wheel hub displacement doesn’t fully match the road surface. Filtering roughness gives a usable road profile for the rig's operation [8-9].
2.6. Tire envelope characteristic analysis
When a vehicle is driving on the road, the tire, as a component in contact with the road, has the functions of circumferential geometric filtering and elastic filtering [10]. At the same time, since the vehicle needs to be equipped with the tire when conducting a four-poster road simulation test, after spatial geometric filtering of the road surface roughness, the test rig must reproduce reproduce an effective road profile. Consequently, the test rig’s drive signal is processed to represent this effective road profile. As shown in the figure, the simplified mathematical model of the tire passing through the road surface is as follows: represents the coordinate system where the actual road profile is located, while AX denotes the coordinate system of the tire. is the actual road profile, and is the height of the tire in the coordinate system as it contacts the road surface.
Fig. 3Simplified mathematical model of tire passing over road profile
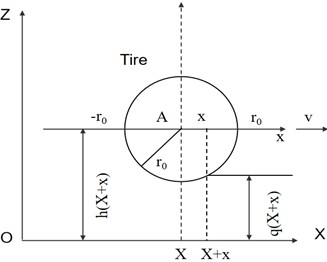
Assumptions: 1) The tire always rolls with a free radius ; 2) The tire has at least one point in contact with the road surface during rolling. From Fig. 1, we can derive formula 1:
Given that:
where, represents the actual height of the tire:
where is the effective road profile, that is, the road profile obtained by geometric filtering of the actual road surface. Therefore, it is theoretically feasible to obtain an effective road profile after geometric filtering of the actual road surface.
The analysis indicates that the wheel-coupled test rig’s driving signal matches real road surfaces, and the actuator's signals align with actual road conditions after iteration, which will be validated experimentally.
3. Rig test and data analysis
The paper focuses on a top-selling vehicle model. Accelerators are mounted on the axle head to gather road load data on a typical road profile. The vehicle is tested on a wheel-coupled road simulator to get actuator cylinder displacement signals, as shown in Fig. 5. These signals are analyzed in various domains. The paper compares these signals with variables like counterweight, rim size, and vehicle speed.
Table 1Single variable design of vehicle data collection
Variable types | Variable value 1 | Variable value 2 |
Counter weight | Fully loaded | Half load |
Speed | 30 km/h | 40 km/h |
Rim size | 17 inches | 19 inches |
Fig. 4Experimental setup
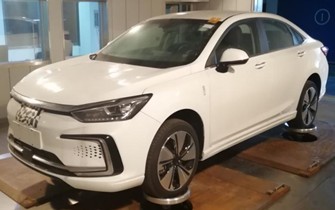
Fig. 5Iteration result
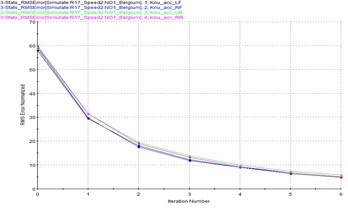
Fig. 6Comparative analysis of drive signal under different counterweight
a) Time domain
b) Frequency domain
c) Level cross
d) Rain flow
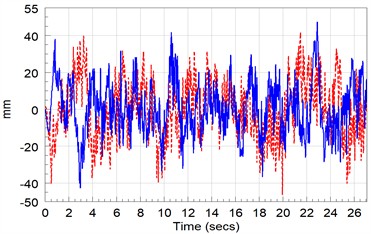
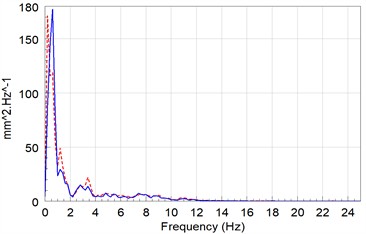
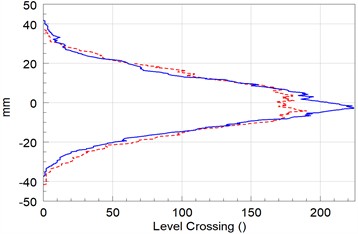
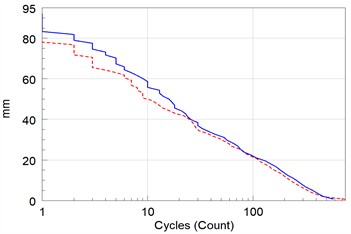
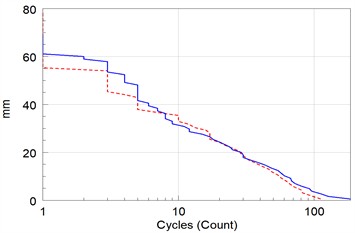
The comparison of drive signals, obtained through the iterative process for the whole vehicle under two different loading conditions, is depicted in Fig. 6, where the red line corresponds to the variable value 1, and the blue line represents the variable value 2.
Fig. 7Comparative analysis of drive signal at different speeds
a) Time domain
b) Frequency domain
c) Level cross
d) Rain flow
Fig. 8Comparative analysis of drive signal under different rim sizes
a) Time domain
b) Frequency domain
c) Level cross
d) Rain flow
In the time domain, the amplitude is consistent, and the main frequency in the frequency domain is around 0.3 Hz. The level-cross counting results show that the small-amplitude drive signal is significantly reduced under full load conditions, with the vibration amplitude difference mainly concentrated between –5 mm and +5 mm. In the rain flow count results, the large-amplitude actuator displacement under different loads is consistent. In summary, the overall trend and amplitude of the drive signals are consistent under different loads.
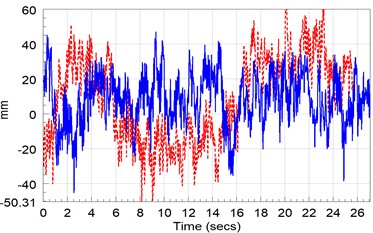
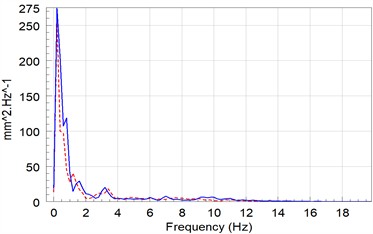
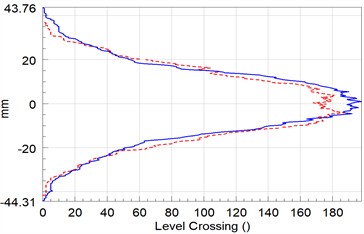
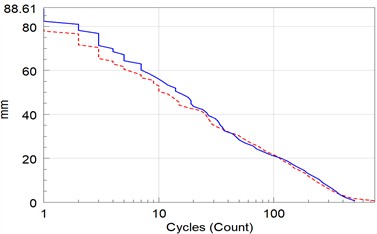
Fig. 7 compares drive signals from the whole vehicle iteration at two speeds. The signals show good amplitude consistency around 0.3 Hz. Cross-level analysis confirms similar amplitudes at both speeds. Rain flow results indicate overall consistency, with increased amplitudes at higher speeds possibly due to tires losing contact with the ground. Overall, drive signal trends and amplitudes are consistent across speeds.
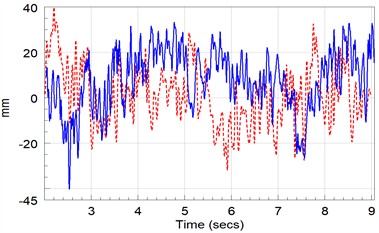
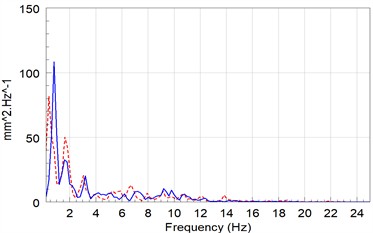
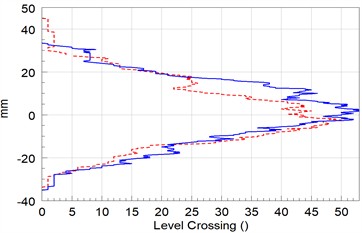
The comparison of the drive signals obtained by the iteration of the whole vehicle under two different rim sizes is shown in Fig. 8. From the time domain, the amplitude consistency is good; the main frequency in the frequency domain is around 0.3 Hz, but it is obvious that the actuator displacement energy corresponding to the 17-inch tire is larger, different rim sizes will lead to different filtering effects; the level-cross counting results show that the amplitudes are the same under the two working conditions; from the rain flow results, the drive signals are the same overall. In summary, under different rim sizes, the overall trend and amplitude of the drive signals have a certain degree of consistency, and the difference in the frequency domain proves the necessity of geometric filtering when compiling the standard load spectrum.
4. Conclusions
This paper discussed in detail the basic theory and working principle of the wheel-coupled road simulation test rig and deduced that the drive signal of the test rig corresponds to the effective road profile.
1) It analyzed the feasibility of deriving the effective road profile from the actual road profile and provided the corresponding calculation method.
2) Based on the method, a specific vehicle is used as a prototype for actual vehicle verification. The iterative results demonstrate good consistency of the test rig's drive signal across different parameters.
3) Through a series of analyses, the paper proved the feasibility of obtaining the wheel-coupled test rig load spectrum from the actual road profile at the test field.
References
-
X. Xu, “Research on the control of indoor reproduction of standard road spectrum,” Wuhan University of Technology, 2009.
-
L. Zhao, P. Yang, and S. Weng, “Research on standardization method of load spectrum for four-column reliability test,” Journal of Vibration Impact, Vol. 2022, No. 5, p. 041, 2022.
-
P. Guan, F. Yin, and L. Yao, “Feasibility study on standard spectrum of four-column rig test,” Shanghai Automobile, Vol. 2020, No. 10, pp. 59–62, 2020, https://doi.org/10.3969/j.issn.1007-4554.2020.10.13
-
X. Sun, “A vehicle rig test load spectrum analysis method based on virtual test field: CN202110280072.6,” CN113010964A, 2024.
-
X. Deng, “Research on the compilation method of rapid simulation test load spectrum for four-channel whole vehicle,” Shanghai University of Technology, 2024.
-
L. Shi, C. Yue, and R. Zhang, “Research on road modeling method for random excitation test on vehicle test field,” China Auto, Vol. 2024, No. 5, 2024.
-
B. Wang, “Research on road surface roughness reproduction method of road simulation test rig,” Wuhan University of Technology, 2010.
-
W. Li and G. Gao, “Enhancement coefficient of moderate standard washboard road in vehicle test field,” Journal of Vibration Testing and Diagnosis, Vol. 35, No. 6, 2015, https://doi.org/10.16450/j.cnki.issn.1004-6801.2015.06.017
-
Z. Zhou, “Research on virtual rig based on real road spectrum reproduction and vehicle fatigue life prediction,” Hunan University, 2013.
-
K. Guo, Q. Liu, and G. Ding, “Analysis of tire envelope characteristics and its application in vehicle vibration system modeling,” Automotive Engineering, Vol. 21, No. 2, 1999.
About this article
The authors have not disclosed any funding.
The datasets generated during and/or analyzed during the current study are available from the corresponding author on reasonable request.
The authors declare that they have no conflict of interest.
