Abstract
In order to effectively reduce the failure rate of vibrating screens, a vibration monitoring system design was proposed based on the structure and working principle. The system should be able to monitor the operating state of the vibrating screen in real time, including vibration amplitude, frequency, axial displacement, etc., and be able to detect abnormal conditions in time and give warning prompts. The key hardware of the monitoring system was designed, including acceleration sensor, power module, signal filtering circuit, etc. The sensitivity of the acceleration sensor was measured using comparative method and accurately completed parameter calibration. The eccentric block was used to simulate different deviation of excitation force for system vibration signal test and calibration. The results show that under normal operating conditions, the amplitude of each frequency of the vibrating screen is less than 0.04 g. Under the condition of excitation force deviation, the amplitude of 16 Hz is obviously lower than that of other frequencies, which means that the vibrating screen is currently experiencing lateral oscillation.
Highlights
- The key hardware of the monitoring system was designed, including acceleration sensor, power module, signal filtering circuit, etc.
- The sensitivity of the acceleration sensor was measured using comparative method and accurately completed parameter calibration.
- The eccentric block was used to simulate different deviation of excitation force for system vibration signal test and calibration.
1. Introduction
Vibrating screen is a screening equipment that vibrates back and forth with the excitation force, not only can it sort mixtures by size, but also can clean and dehydrate materials during screening [1]. It is an indispensable important equipment in material separation industry. However, vibrating screen often fails in actual use due to long-term continuous operation and complex load, causing the main components to bear load for a long time, resulting in wear of the screen mesh, fatigue fracture of the side plate, and broken fasteners. In addition, the working environment of vibrating screen is harsh, and it is often installed in mining areas with serious dust. During the operation process, uneven excitation force is one of the important factors that lead to mechanical damage [2, 3]. More serious failures may even result in accidents, causing casualties. If there is a vibrating screen fault monitoring system that monitors the operation of the vibrating screen in real time and issues a warning for vibrating screen faults, not only can unnecessary economic losses be recovered, but accidents can also be avoided [4, 5]. Therefore, it is of great significance to deeply study the monitoring system of vibrating screen. The causes of vibrating screen failure are diverse, and it may be caused by multiple factors acting together, making it difficult to represent the fault characteristics with a single feature vector. Furthermore, for the weak fault types that have a minor impact on the operation of the vibrating screen, multiple angles should be analyzed to obtain effective fault feature quantities. Research should be conducted on vibrating screen fault diagnosis algorithms to achieve fault diagnosis by fusing multiple feature vectors. A vibrating screen fault monitoring system can monitor the operating condition of the vibrating screen in real time and identify vibrating screen faults.
2. Analysis of mechanical structure and fault type
2.1. Structure composition and principle
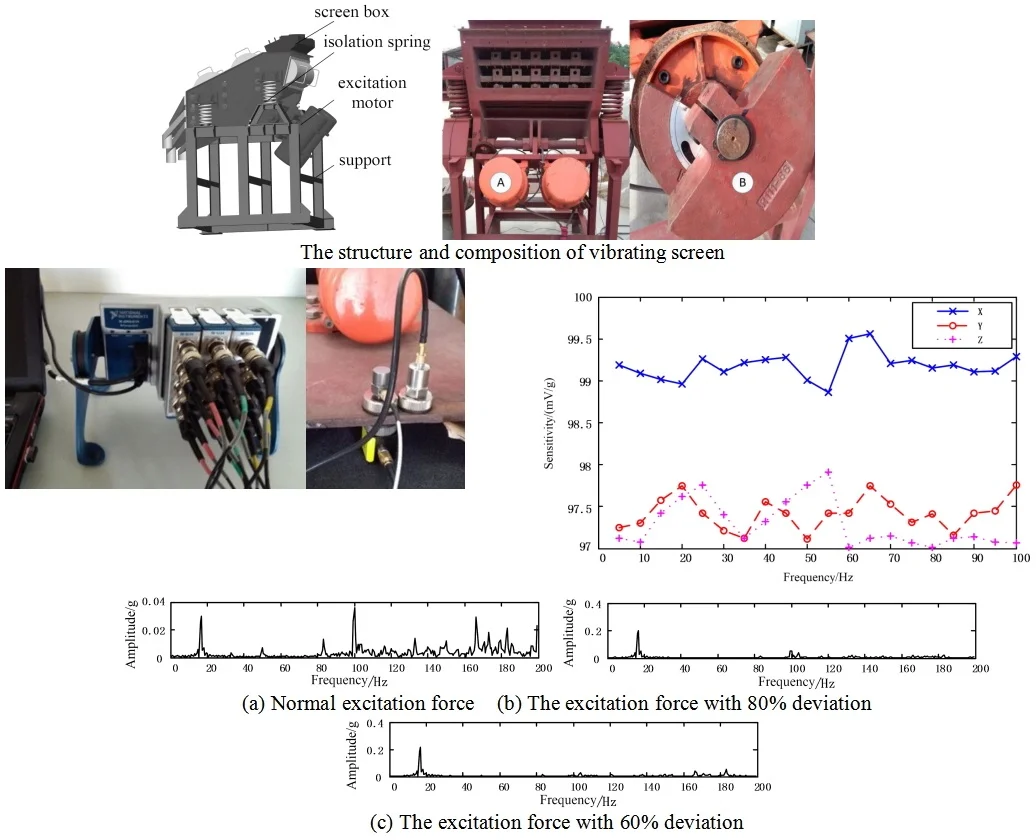
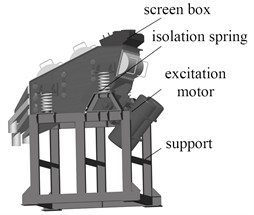
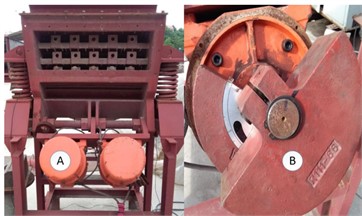
The probability screen is the most commonly used type of vibrating screen, which is based on the probability statistical theory and utilizes probability principles to quickly screen materials. It has a high screening efficiency and other advantages such as simple structure, small size, large slope angle of the screen surface, and less blockage of materials. The main structure of a vibrating screen includes the screen box, vibration system, and isolation system, as shown in Fig. 1. The screen box of the vibrating screen consists of side plates, a vibrator beam, and screen mesh. The entire screen box is constructed from high-quality steel, with the side plates and beam being connected using bolts. This approach is adopted due to the high stress concentration at welded joints, which can lead to easy cracking and equipment failure. Furthermore, the vibrator beam not only withstands the vibrating force but also supports its own weight and that of the vibrating motor, making it susceptible to cracking.
Fig. 1The structure and composition of vibrating screen
2.2. Analysis of fault types
Most of the faults in the vibrating screen are caused by unequal excitation force. Common types of vibrating screen failure include spring breakage, side panel cracking, bolt breakage, and screen wear. Springs are utilized to support the screen box and isolate vibration, often failing due to fatigue or wear. The natural frequency of the vibrating screen is directly related to the spring stiffness; an increase in spring stiffness results in a higher natural frequency, and vice versa. When the operating frequency approaches the natural frequency, the vibrating screen becomes more unstable. It is generally preferred that the ratio of operating frequency to natural frequency falls between 3 Hz and 7 Hz. Therefore, it is advisable not to alter spring stiffness. Furthermore, changes in stiffness directly impact dynamic load on the vibrating screen base: greater stiffness leads to increased load and reduced stability. In practical use, springs are subject to excitation force as well as material impact and wear resulting in breakage. The vibrating screen should be positioned horizontally to ensure alignment of the exciting force and gravity, thereby preventing the generation of lateral forces within the system. However, if there is a change in spring height or uneven ground causing tilting of the vibrating screen, non-alignment between the exciting force and gravity will lead to the generation of lateral forces, resulting in oscillation of the vibrating screen.
2.3. Design of vibration testing platform
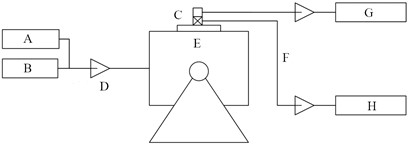
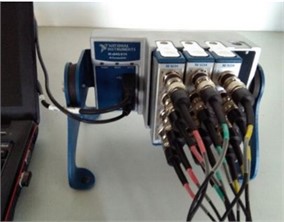
The fault experiment platform for vibrating screen mainly includes: the experimental vibrating screen; the acceleration sensor; the data acquisition system. When detecting vibration signals, acceleration signals, velocity signals, or displacement signals can be selected, and the three quantities can be converted through integration. Displacement sensors are mainly non-contact type, with a smaller measurement range, such as laser displacement sensors, eddy current displacement sensors, and inductive displacement sensors, which have the characteristics of high precision and fast response, but since they are non-contact type, a mounting reference is needed, which is not possible in the construction site, so they are not used. Acceleration sensors utilize the piezoelectric effect of materials, wherein the internal structure changes and polarization occurs under the action of external force, thereby generating an electric field on its surface. Acceleration sensors are suitable for measuring damage or failure caused by force. Considering the characteristics of acceleration sensors, this experimental platform uses a triaxial acceleration sensor. The amplitude in the X and Y directions is obtained from the triaxial acceleration sensor, and then synthesized to obtain the trajectory and direction of vibration of the vibrating screen. The experimental platform needs to detect precise acceleration values for calculating vibration screen parameters such as speed, amplitude, and direction angle. Therefore, the acceleration sensor needs to be calibrated before the experiment. According to the calibration regulations for vibration measuring instruments, the sensitivity of the acceleration sensor is measured using the comparison method, as shown in Fig. 2.
Fig. 2Comparative method of measurement: A: digital counter, B: signal generator, C: standard sensor, D: power amplifier, E: excitation board, F: amplifier, G: indicating or recording instruments, H: digital voltmeter
3. Design and testing of monitoring systems
3.1. Key hardware design
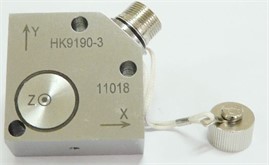
(1) Acceleration sensor. According to the vibration signal measurement requirements, the acceleration sensor uses the three-axis current signal output type HK9190-3, as shown in Fig. 3. This acceleration sensor has a shear structure and is equipped with a shear ceramic piezoelectric crystal chip. It has a double-shell structure and is durable, with good insulation against ground and good sealing performance, making it suitable for use in harsh working environments. The HK9190-3 type acceleration sensor has a range of 10 g, while the maximum probability value of the acceleration in the experiment is about 3.5 g, and most vibrating screens have an acceleration of less than 6 g, so the range of the sensor meets the requirements. Additionally, most vibrating screens have a working frequency of less than 50 Hz, if the sampling rate is chosen to be 10 times the vibrating screen’s working frequency, the maximum sampling rate would be 500 Hz. The usage frequency range of HK9190-3 is 0.5-5000 Hz, which also meets the requirements.
Fig. 3Structure of acceleration sensor
(2) AC/DC power module. Since the speed sensor requires a DC voltage of 8-30 V for power supply, and the operational amplifier chip in the signal processing circuit requires ±15 V power supply, and finally, the MCU chip requires a power supply voltage of 5 V, the power module needs to provide ±15 V and +5 V voltages. Fig. 4 shows the circuit diagram of the power module.
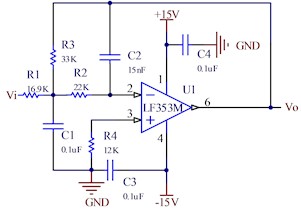
(3) Signal filter circuit. Since the voltage signal after conversion is superimposed with a DC component, which affects the subsequent processing, a high-pass filter circuit is used to filter out the DC component. The design needs to consider that the filter circuit can filter out the DC component and ensure that the gain in the 10-50 Hz passband is the same. Since the voltage signal after conversion has a DC component that affects subsequent processing, the capacitance value of the filter capacitor is set to 1 uF, the resistance value to 1 MΩ, and the time constant to 1 s. The time constant of the high-pass filter is much greater than the maximum period of the acceleration sensor output signal. The working frequency of the vibrating screen is below 50 Hz, in order to improve the integration accuracy, it is necessary to filter out high-frequency interference in the signal before integration, so a low-pass filter is needed, and the passband flatness in the 0-50 Hz range should be ensured as much as possible. Fig.5 shows the principle diagram of the low-pass filter circuit. Generally, the frequency band of the filter is divided into the passband, transition band and stopband. The ideal situation is that the gain in the passband is constant, and the gain in the stopband is zero. The delay function is a constant in the passband.
Fig. 4Power module circuit diagram
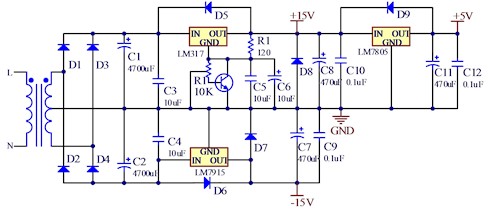
Fig. 5The principal diagram of the low-pass filter circuit
3.2. Parameter calibration
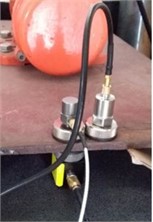
In the experiment, the standard acceleration sensor used was the ICP series, with a sensitivity of 101.3 mV/g. The vibrating exciter frequency was adjusted, starting from 5 Hz and measuring once at each 5 Hz interval up to 100 Hz. Since the vibrating screen usually operates at a frequency of 50 Hz or less, and is limited by the exciter's performance, the amplitude is small when the frequency exceeds 100 Hz, which is not conducive to accurate measurement. In order to improve the detection accuracy and thereby ensure the reliability of indicators such as the amplitude and direction angle of the vibrating screen, it is necessary to calibrate the acceleration sensor before the test, that is, to measure the sensitivity of the acceleration sensor by the comparison method, as shown in Fig. 6.
Fig. 6Calibration experiment for sensors
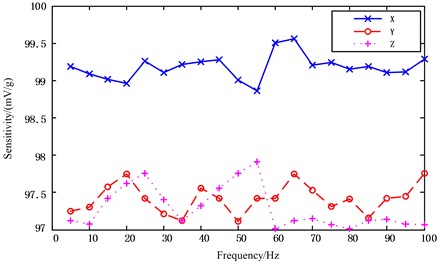
According to the experimental data, the frequency characteristic curve of the acceleration sensor was drawn. As shown in Fig. 7, the sensitivity values of the sensor in the X, Y, and Z directions at different frequencies were measured. The sensitivity values of each axis were relatively stable, with the X axis sensitivity ranging from 99 to 100 mV/g and the Y and Z axes ranging from 97 to 98 mV/g. According to the experimental data in Fig. 7 and Eq. (1):
where s is sensitivity value, n is the number of test points, Mi is the input acceleration value at the i-th test point, Ni is the output value of the acceleration sensor at the i-th test point.
The sensitivity of the acceleration sensor can be corrected, as shown in Table 1.
Just relying on the amplitude and direction angle of the vibrating screen is not enough to fully identify the different types of states, so additional analysis and extraction of effective fault features are needed. In the frequency domain analysis, the most commonly used analysis method is the Fourier transform, but the Fourier transform has limitations for non-stationary signals. The Fourier transform of a finite, non-periodic function or a signal with spikes and discontinuities is poor, and it cannot express the time-frequency information of the signal. The wavelet transform, on the other hand, can observe the time-frequency characteristics of the signal. The wavelet transform can adaptively adjust the resolution for different frequency signals.
Table 1Calibration result of sensor sensitivity value
Sensitivity / direction | X | Y | Z |
Factory default value / (mV/g) | 99.88 | 99.77 | 98.31 |
Experimental calibration value / (mV/g) | 99.23 | 97.59 | 97.43 |
Fig. 7The sensitivity values of the sensor
3.3. Testing and identification of vibration signals
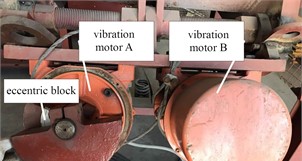
The vibrating motor generates a vibration force, which is used to drive the vibrating screen to perform periodic motion, as shown in Fig. 8. The vibration force of the vibrating screen is the result of the vertical components of the vibrating motor being added together. Due to the action of eccentric weights, the center of gravity of the vibrating motor is displaced from the axis, and a vibration force is generated when the vibrating motor rotates. The size of the vibration force depends on the mass of the eccentric weights and the distance of the center of gravity from the axis. If the vibration force is not balanced, the eccentric weights will deviate from their predetermined positions. According to this principle, the active setting of unbalanced vibration force can simulate equipment failure. In the test experiment, the vibration screen fault monitoring system only used the low-frequency coefficient and peak factor as two feature quantities. The identification algorithm was simplified, as the fault on the vibration screen had a weak macroscopic effect, and the fault features were reflected in the high-frequency part of the signal. Therefore, the signal detection and analysis of the abnormal situation of the excitation force were carried out.
Fig. 8Adjustment of unbalanced excitation force
Changes in excitation force can cause changes in the amplitude of the vibrating screen and abnormalities, thereby aggravating overloading of some parts. The vibration response under different excitation force deviation conditions is shown in Fig. 9. It can be seen from the figure that when the excitation forces of the two vibrating motors are not simultaneous, the horizontal component cannot be cancelled out, so the vibrating screen will exhibit lateral sway, which will reduce the screening efficiency of the vibrating screen and subject the vibrating screen's side plates to impact stress, causing damage to the vibrating screen. Under normal operating conditions, the amplitude of each frequency on the vibrating screen is less than 0.04 g. However, after adjusting the excitation force, the amplitude at 16 Hz is clearly lower than that of other frequencies, and the high-frequency response is significantly reduced, indicating that the vibrating screen is exhibiting lateral sway at this time.
Fig. 9Vibration response under different eccentricity excitation forces
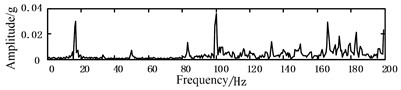
a) Normal excitation force
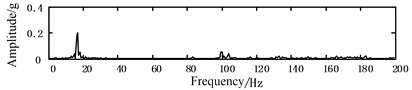
b) The excitation force with 80 % deviation
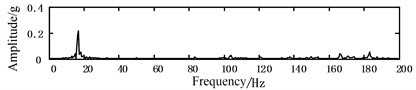
c) The excitation force with 60 % deviation
4. Conclusions
1) The vibration screen fault monitoring system has two main functions, namely vibration screen operation status monitoring and vibration screen fault diagnosis. Vibration screen operation status monitoring is to calculate and display the frequency, amplitude, and direction angle of the vibration screen on the screen for operators to observe the operating status of the equipment. Vibration screen fault diagnosis is to determine whether the vibration screen has a fault, and immediately alarm to indicate if a fault occurs.
2) The vibration system consists of a vibration motor and eccentric counterweight, which provides the vibration power for the vibrating screen. The operating frequency of the vibrating screen corresponds to the excitation frequency of the motor, which can be adjusted by adjusting the motor speed. The vibration signal feedback can be used to infer whether the excitation force deviation is within a reasonable range, thereby reducing the probability of damage.
References
-
H. O. A. Ahmed and A. K. Nandi, “Vibration image representations for fault diagnosis of rotating machines: a review,” Machines, Vol. 10, No. 12, p. 1113, Nov. 2022, https://doi.org/10.3390/machines10121113
-
T. Sato, M. Funato, K. Imai, and T. Nakajima, “Self-powered fault diagnosis using vibration energy harvesting and machine learning,” Sensors and Materials, Vol. 34, No. 5, p. 1909, May 2022, https://doi.org/10.18494/sam3907
-
V. Goel and N. Kumar, “Vibration response analysis of healthy and cracked gears through different signal processing techniques,” Vibroengineering Procedia, Vol. 39, No. 3, pp. 43–47, Dec. 2021, https://doi.org/10.21595/vp.2021.22311
-
N. J. A. Egarguin, T. Meklachi, D. Onofrei, and N. D. Harari-Arnold, “Vibration suppression and defect detection schemes in 1D linear spring-mass systems,” Journal of Vibration Engineering and Technologies, Vol. 8, No. 4, pp. 489–503, May 2019, https://doi.org/10.1007/s42417-019-00104-5
-
Z. Feng, H. Ma, and M. J. Zuo, “Vibration signal models for fault diagnosis of planet bearings,” Journal of Sound and Vibration, Vol. 370, No. 1, pp. 372–393, May 2016, https://doi.org/10.1016/j.jsv.2016.01.041
About this article

The authors have not disclosed any funding.
The datasets generated during and/or analyzed during the current study are available from the corresponding author on reasonable request.
The authors declare that they have no conflict of interest.
