Abstract
Detecting early faults in traction motor bearings poses significant challenges due to weak signals and difficulties in identifying fault initiation points with sufficient sensitivity. This paper introduces a novel anomaly detection method based on a multi-scale sub-band fuzzy entropy manifold fusion index (MFMI). The proposed method decomposes vibration signals across multiple scales to capture local features of bearing health, calculates sub-band fuzzy entropy to quantify fault characteristics, and uses locality preserving projection to retain nonlinear structural features while reducing dimensionality. Validation experiments using full-cycle acceleration life vibration signals demonstrate the superior performance of the proposed method. For instance, in the traction motor case, the proposed index detected early damage at the 189th time point, outperforming other indicators that detected damage after the 200th time point. The proposed method also shows higher sensitivity to early degradation trends while maintaining stability during normal operation. These results highlight the practical applicability of the method for early anomaly detection in traction motor bearings, offering earlier and more reliable fault detection compared to traditional methods.
Highlights
- The fuzzy entropy is obtained by multi-scale sub-band decomposition, and the local detail characteristics of bearing health are quantitatively described.
- The unsupervised locality preserving projection method is used to preserve the geometric properties of the original nonlinear features of multi-scale fuzzy entropy.
- By adaptive processing and giving more weight to the latest data, the short-term trend of bearing degradation is effectively captured.
1. Introduction
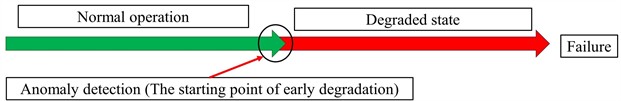
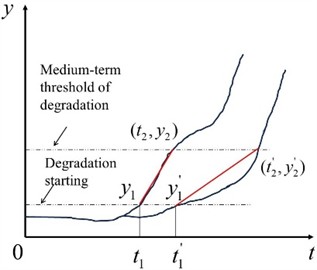
The detection of the initial fault start time in rolling bearings is crucial for maintaining rotating equipment and is a key focus in anomaly detection research. At the early stages of bearing faults, signals are often weak, heavily influenced by noise, and sensitive to varying working conditions, making early fault detection a significant challenge [1]. As illustrated in Fig. 1, accurately identifying the initial fault onset is essential for evaluating performance degradation, assessing risk levels, and devising timely maintenance strategies. This process directly impacts fault diagnosis accuracy, bearing performance evaluation, and residual life prediction [2]. Since the initial fault onset is difficult to identify, advanced signal processing techniques are often employed to extract weak fault features from vibration signals. These methods, combined with diagnostic strategies and early-warning thresholds, enable efficient detection of fault initiation points [3].
Fig. 1Bearing degradation process
The researchers determined the initial fault time of the bearing by analyzing the characteristics of the vibration signal. Based on the signal changes and fault characteristics, a series of identification indicators and rapid identification strategies were developed. For example, according to Howar’s research, the kurtosis value of the vibration signal at the initial fault point is usually between 3 and 3.5 [4]. However, the difference in working conditions of different devices makes this standard unable to set a fixed threshold, which may lead to deviations in practical applications. Although this provides a quantitative indicator, this method also faces the problem of deviation in practical applications due to the diversity of working conditions and the influence of environmental noise. There are still challenges and room for improvement in accurately identifying the initial fault time point. Zhu et al. proposed a bearing anomaly detection method combined with RMT-PCA, which extracts key information from many feature data, and then creates a comprehensive feature index to evaluate the degradation of bearings. Compared with other intelligent algorithms, the RMT-PCA method is more sensitive to early anomalies and can more accurately describe the degradation process of bearings [5]. Wan et al. proposed a state degradation characteristic index combining Multi-Scale Weighted Permutation Entropy (MWPE) and Locally Linear Embedding (LLE) to improve the sensitivity to early performance degradation of motor bearings. This state degradation feature index effectively enhances the detection ability of early degradation phenomena by using MWPE and LLE techniques [6]. Through literature [7], it can be seen that in the early stage of performance degradation, the root mean square (RMS) shows an upward trend; however, as the performance degradation intensifies, the trend of RMS changes from upward to downward. Therefore, relying on RMS alone is not enough to intuitively describe the overall degradation trend of the object. Therefore, Zhang et al. used the root mean square as the main degradation index, and selected the statistical characteristics with high correlation with the root mean square according to the correlation coefficient. The improved Weibull distribution was used to fit the fluctuation characteristics of the bearing in different recession stages, and finally the health state and four bearing degradation states were obtained [8]. Meddour et al. selected the optimal bearing health index from 30 vibration characteristics in time domain, frequency domain and time-frequency domain through grey correlation analysis, and effectively evaluated the failure state of the bearing combined with the fuzzy inference system of adaptive network [9].
In recent years, feature selection and machine learning techniques have gained increasing attention in fault diagnosis. For instance, Demetgul et al. [10] demonstrated a hybrid approach combining feature selection and data mining to improve diagnostic accuracy under diverse working conditions. Similarly, Yang et al. [11] applied ensemble learning models to enhance the extraction of highly relevant features, improving the reliability of fault detection systems. Furthermore, Zhu et al. [12] utilized transfer learning to enable cross-device fault diagnosis, addressing the challenges posed by varying operational environments and reducing reliance on extensive labeled datasets. These advancements highlight the potential of data-driven techniques in improving fault detection performance.
Despite these advancements, existing methods face significant challenges. Many rely on complex diagnostic models requiring extensive training data, which can be both costly and difficult to obtain. Furthermore, artificial intelligence-based methods often struggle with accuracy under varying working conditions, providing only limited early warnings [13-16]. Fixed-threshold approaches also fail to effectively adapt to the dynamic operating environments of traction motor insulation bearings. These limitations necessitate the development of a generalized and efficient anomaly detection method that can operate reliably across diverse conditions.
To address these limitations, this study proposes a novel anomaly detection method based on a multi-scale sub-band fuzzy entropy manifold fusion index. The proposed method decomposes vibration signals at multiple scales to capture local features of bearing health. Sub-band fuzzy entropy values are then calculated to quantitatively describe fault characteristics at different scales. Using an unsupervised locality preserving projection method, the geometric attributes of the original nonlinear features are retained while reducing high-dimensional features. Adaptive processing is applied to assign greater weight to recent data, enhancing sensitivity to short-term trends and optimizing the final anomaly detection index. The proposed method captures the degradation evolution of traction motor bearings from initiation to failure, quantitatively evaluating the state degradation degree using two evaluation parameters. Validation using full-cycle acceleration life vibration signals demonstrates that this method predicts early faults more accurately, with higher sensitivity to fault trends compared to traditional approaches.
2. Basic theory of bearing performance degradation
2.1. Degradation law of bearing performance
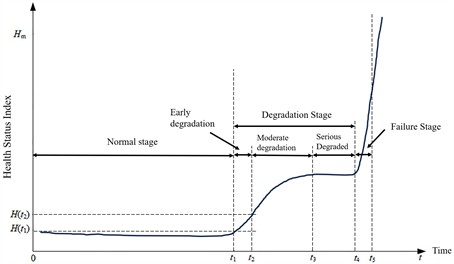
Bearings will experience a variety of complex operating conditions during use and gradually enter different health stages. Therefore, the indicators for evaluating the running state of the bearing need to be able to accurately reflect its current health status. After deeply discussing the development process of rolling bearing damage, the wear mechanism of each stage and the change of surface morphology, El-Thalj et al. proposed five damage evolution models: running-in stage, stable stage, defect initiation stage, defect expansion stage and damage growth stage [17]. There are also some studies that divide the performance degradation state of bearings into four types: normal state, initial degradation state, deep degradation state, and failure state. Fig. 2 shows the performance degradation curve of the bearing [18].
Fig. 2Bearing performance degradation curve
The operation and maintenance mode of mechanical equipment in industry mostly adopts planned maintenance and fault maintenance. Because fault maintenance is carried out only when abnormal occurs, the stop opportunity caused by bearing fault brings huge economic losses. The common operation and maintenance mode is to replace the degraded bearing when the fault is about to occur or when the equipment can maintain normal operation in the early stage of bearing failure. Therefore, the research focus of this paper is the early fault starting point during bearing operation, that is, the abnormal starting point. Accurately identifying the starting point of the abnormal state of the motor bearing can lay the foundation for the subsequent health assessment and intelligent fault diagnosis of the traction motor insulation bearing.
2.2. Performance anomaly evaluation index
Efficient diagnosis and prediction depend on the characteristic indexes that can sensitively reflect the change of the operating state of the motor insulation bearing. As a key link in the evaluation of bearing health status, the mainstream method is to extract the corresponding statistics in the time-frequency domain of the vibration signal as the evaluation index for the vibration signal of the bearing, such as root mean square, kurtosis, frequency mean, frequency root mean square, etc., or use principal component analysis and other dimensionality reduction methods to perform simple feature screening or fusion on the extracted statistical features. The vibration signal of the bearing contains a wealth of performance degradation information. In the field of health assessment, the quantification of signal pulses has attracted the interest of many researchers, because impulsiveness often indicates the occurrence of early faults. Pulse-based health indicators, such as Gini index, kurtosis, entropy, smoothness index, etc., are statistical parameters that can quantify the impact of vibration signals [18].
However, there are still some shortcomings in the existing health indicators: First, the statistical characteristics of the vibration signal have inconsistent characterization capabilities for the bearing degradation process. Direct feature fusion will make the constructed evaluation index contain a lot of redundant information. Secondly, the prediction accuracy of early fault occurrence point is not high, and the fixed threshold method is often used to determine the early fault occurrence point, which makes it difficult to determine the time point of early fault occurrence. Especially when the operating conditions are different, the fault threshold will fluctuate due to the change of operating conditions. Third, the sensitivity of the early fault degradation process of the bearing is insufficient, and the change of the bearing health state cannot be reflected in time.
Vibration signals carry important information about the degradation of rolling bearings. It is very important to identify the sensitive features in these signals for judging the bearing state. Through the effective feature extraction method, the vibration signal can be analyzed from the time domain and frequency domain, so as to accurately reflect the degradation degree of the bearing. In this paper, four common performance degradation indexes of rolling bearings are selected as comparison. The root mean square and standard deviation of the indicators reflecting signal energy and sensitivity to local damage, and the kurtosis and Gini index reflecting the degree of impact:
a) Root mean square:
b) Standard deviation:
c) Kurtosis:
d) Gini index:
2.3. Sensitivity analysis method of performance anomaly evaluation index
In order to evaluate whether the bearing performance degradation index can effectively perform anomaly detection, it is first necessary to clarify whether the proposed index can accurately identify the starting point of the early degradation state, and whether it is sensitive enough to the trend of change during the degradation process. The common evaluation and analysis methods include the introduction of monotonicity, trend and prognostic indicators. In this paper, the proposed evaluation index is to better identify the early damage starting point of the motor bearing shaft current damage and whether it is sensitive enough to the trend of shaft current damage. Assuming that the starting point of early degradation is and the ending point is , the starting point of early degradation is defined and the following two performance degradation feature evaluation criteria are defined.
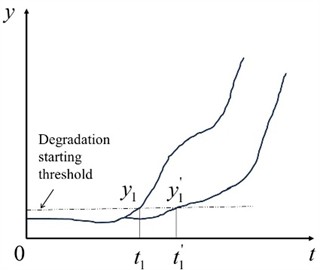
2.3.1. The starting point of early degradation
The starting point of early degradation represents the moment when performance begins to decline due to an early fault. It marks the transition between the health state and the abnormal state of equipment components. In the early stages of bearing degradation, small defects or cracks – especially weak faults caused by electrical current damage – are often obscured by noise in vibration signals. As a result, these faults are challenging to detect using conventional statistical methods for vibration analysis.
Accurately identifying the early degradation starting point is crucial for timely maintenance planning. For a given system, the earlier the degradation starting point is detected, the more effectively preventive measures can be implemented to avoid failures. Early detection enables the formulation of maintenance strategies that mitigate risks and minimize downtime.
In this study, the upper bound of 3 during the initial operational phase is used as the threshold to define the initiation of degradation. This approach ensures sensitivity to weak faults while providing a reliable boundary for distinguishing between normal and abnormal states.
Fig. 3Early degradation starting point diagram
2.3.2. Early degradation sensitivity
In the initial stage of transition from normal state to failure state, the focus is on capturing small changes from normal to abnormal, which is crucial for early fault detection and prevention. In this paper, twice the maximum threshold at the initial stage of operation is set as the demarcation point from the initial degradation stage to the moderate degradation stage. The slope of the degradation index is used to represent the sensitivity of degradation. The larger the slope is, the more sensitive it is, as shown in Eq. (5):
3. Bearing anomaly detection method based on multi-scale sub-band fuzzy entropy manifold fusion index
3.1. Multi-scale sub-band fuzzy entropy
Fuzzy entropy assesses the complexity of time series using fuzzy membership functions. However, for highly complex sequences, the traditional fuzzy entropy approach may not fully capture the data's internal information. Therefore, a multi-scale sub-band fuzzy entropy method is proposed. Firstly, the signal undergoes wavelet packet decomposition to generate multi-scale sub-band signals. Subsequently, the fuzzy entropy is computed for each sub-band signal. This method facilitates a comprehensive exploration of the data’s internal structure, enabling a layered analysis of its eigenvalues and eigenvectors.
Fig. 4Early degradation sensitivity diagram
This approach effectively extracts fault features from complex and subtle data. The specific steps include:
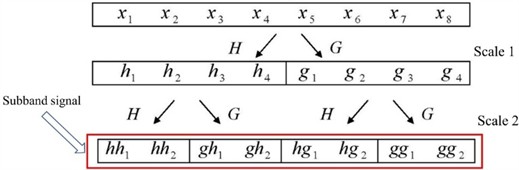
Step 1: The vibration signal is decomposed and reconstructed by layer wavelet packet decomposition and reconstruction, and wavelet packet decomposition and reconstruction sequences are obtained. is the -th sub-band sequence of wavelet packet decomposition of signal by -layer decomposition.
Fig. 5Time series decomposition diagram
Step 2: Let a sub-band be , given dimension , then the sub-band signal is transformed into a set of -dimensional vectors:
where, , is the length of the sub-band sequence.
Step 3: Calculate the distance between each sequence and the rest of the sequence:
where, .
Step 4: Given a threshold value ( is the standard deviation of the original data), ambiguity , through the fuzzy membership function , redefine the distance matrix:
Step 5: Find the average value of all memberships:
Step 6: Increase the dimension to , repeat steps (2)-(5) to get .
Step 7: The fuzzy entropy of is:
Step 8: Repeat steps (2)-(7) to calculate the fuzzy entropy of sub-band respectively.
Step 9: In this paper, the sub-band sequences , are calculated respectively, and the feature matrix is constructed. Then the multi-scale sub-band fuzzy entropy of the fault signal is :
where, is a high-dimensional quantitative description of fault information under different thickness. Repeat steps 3 through 6 until the result converges.
3.2. Fusion index construction based on locality preserving projection
The Locality Preserving Projection (LPP) algorithm [19] addresses the limitations of traditional methods like Principal Component Analysis (PCA), which struggle to capture nonlinear data manifolds effectively. LPP facilitates easier acquisition of low-dimensional projections. In different scale spaces, variations in fault feature thickness result in differing fault information across dimensions, potentially causing feature redundancy in high-dimensional sub-band fuzzy entropy features. Traditional fusion methods often employ PCA without considering the nonlinear manifold structure between features, thus failing to retain optimal fault information. Therefore, employing locality preserving projection in manifold learning is crucial for uncovering hidden manifold structures within Euclidean space and identifying similarities among otherwise elusive features.
The LPP algorithm is a graph-based manifold learning method. For the data set on the original space, let be the data of the original space mapped to the low-dimensional manifold. By constructing the adjacent graph of the sample, the connected points in the adjacent graph remain connected after the manifold mapping, and the minimum error is obtained as the objective function:
A simplified objective function can be obtained:
where, is a diagonal matrix whose diagonal elements are the sum of the corresponding column elements in .
Adding constraint converts the target function to:
Solving the optimization problem of the above formula according to Lagrange multiplier method is to solve the eigenvalue and eigenvector problems of the generalized eigenequation of the following formula:
The transformation matrix is composed of eigenvectors corresponding to the first minimum eigenvalues of the above formula.
The high-dimensional fault feature is set as the input feature matrix, and the feature vector corresponding to the minimum eigenvalue in the transformation matrix is retained to obtain the initial anomaly detection index after manifold fusion.
3.3. Adaptive processing method of abnormal value of index
Because the equipment is easily disturbed by the external environment in the actual operation process, it is likely to appear the index value judged as the fault in the normal operation stage of the bearing. The sudden change value that does not conform to the real health state of the bearing will lead to the wrong prompt of the operation and maintenance system. Therefore, it is necessary to impose a fair penalty on the overestimation and underestimation of bearing health status, and the adaptive processing method of index outliers imposes a greater penalty on the overestimation of health status. Because the overestimation of the health status often leads to low maintenance quality, which poses a greater risk to the safe operation of the equipment. Underestimating the health status of the bearing is more in line with the actual maintenance strategy.
The 3 a criterion, also known as the “triple standard deviation criterion”, is a commonly used statistical quality control method for determining outliers or outliers in data sets. This method is based on the nature of the normal distribution, in which 68 % of the data is within the range of the average value () plus or minus a standard deviation (), 95 % of the data is within the range of the average value plus or minus two standard deviations, and 99.7 % of the data is within the range of the average value plus or minus three standard deviations, and the values beyond this range are extreme outliers.
Fig. 6Index outliers adaptive processing process
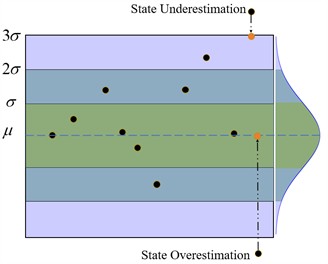
In this paper, an adaptive processing method of index outliers in line with bearing anomaly detection is constructed according to the 3 criteria. The mean correction is performed for the value of the bearing fusion index exceeding the lower bound of 3 (state high estimation), that is, the abnormal value is corrected to the statistical mean. For the value exceeding the upper bound of 3 (state low estimation), it is corrected to the upper bound of 3, as shown in Fig. 6. The reasonable correction of the abnormal value not only eliminates the interference of the external environment, but also ensures the safe operation of the equipment.
3.4. Exponentially- weighted moving average
In order to reduce the lag effect of the anomaly detection index and make the early fault starting point closer to the latest bearing dynamics, a smoothing method of time series data is introduced after the adaptive processing of outliers. Exponential Weighted Moving Average (EWMA), commonly used to predict and analyze trends. It is a weighted moving average, in which the newer data points have a greater weight in calculating the average value, while the older data points have a smaller weight. This makes EWMA more sensitive to recent data and can be used to capture short-term trends and changes in data.
The calculation steps of EWMA are as follows:
Step 1: Given a time series data point set , where represents the -th data point.
Step 2: Choose a smoothing parameter (usually denoted by ) that determines the weight of the new data point. In general, 01. The closer the value of is to 1, the greater the weight of the new data points, and the faster the response speed of the trend.
Step 3: Initializing the first EWMA value is , usually the first data point of the data sequence can be taken, that is .
Step 4: The following formula is usually used to calculate the subsequent EWMA value:
where, is the EWMA value at time , is the data point at time , and is the EWMA value at time .
Step 5: Repeat step 4 to calculate the EWMA value of the entire time series.
By adjusting the value of , the sensitivity of EWMA to data can be controlled. The smaller value will make the average value smoother and have a better filtering effect on noise, but the response to the trend is slower. A larger value will make the average more sensitive and respond faster to changes in trends, but may be subject to noise interference.
3.5. Bearing anomaly detection process based on multi-scale sub-band fuzzy entropy manifold fusion index
Because a single scale is difficult to mine weak information in the early stage of fault, and it is not sensitive enough to the degradation of bearing health status. At the same time, the premise of efficient diagnosis and health status recognition is a sensitive index that can reflect the change of the operating state of the traction motor insulation bearing. The fixed threshold method usually cannot effectively identify the health status of the bearing under different operating conditions. Therefore, how to design a general motor insulation bearing anomaly detection model, and the model needs to have excellent early fault prediction ability and strong sensitivity to faults is an urgent problem to be solved.
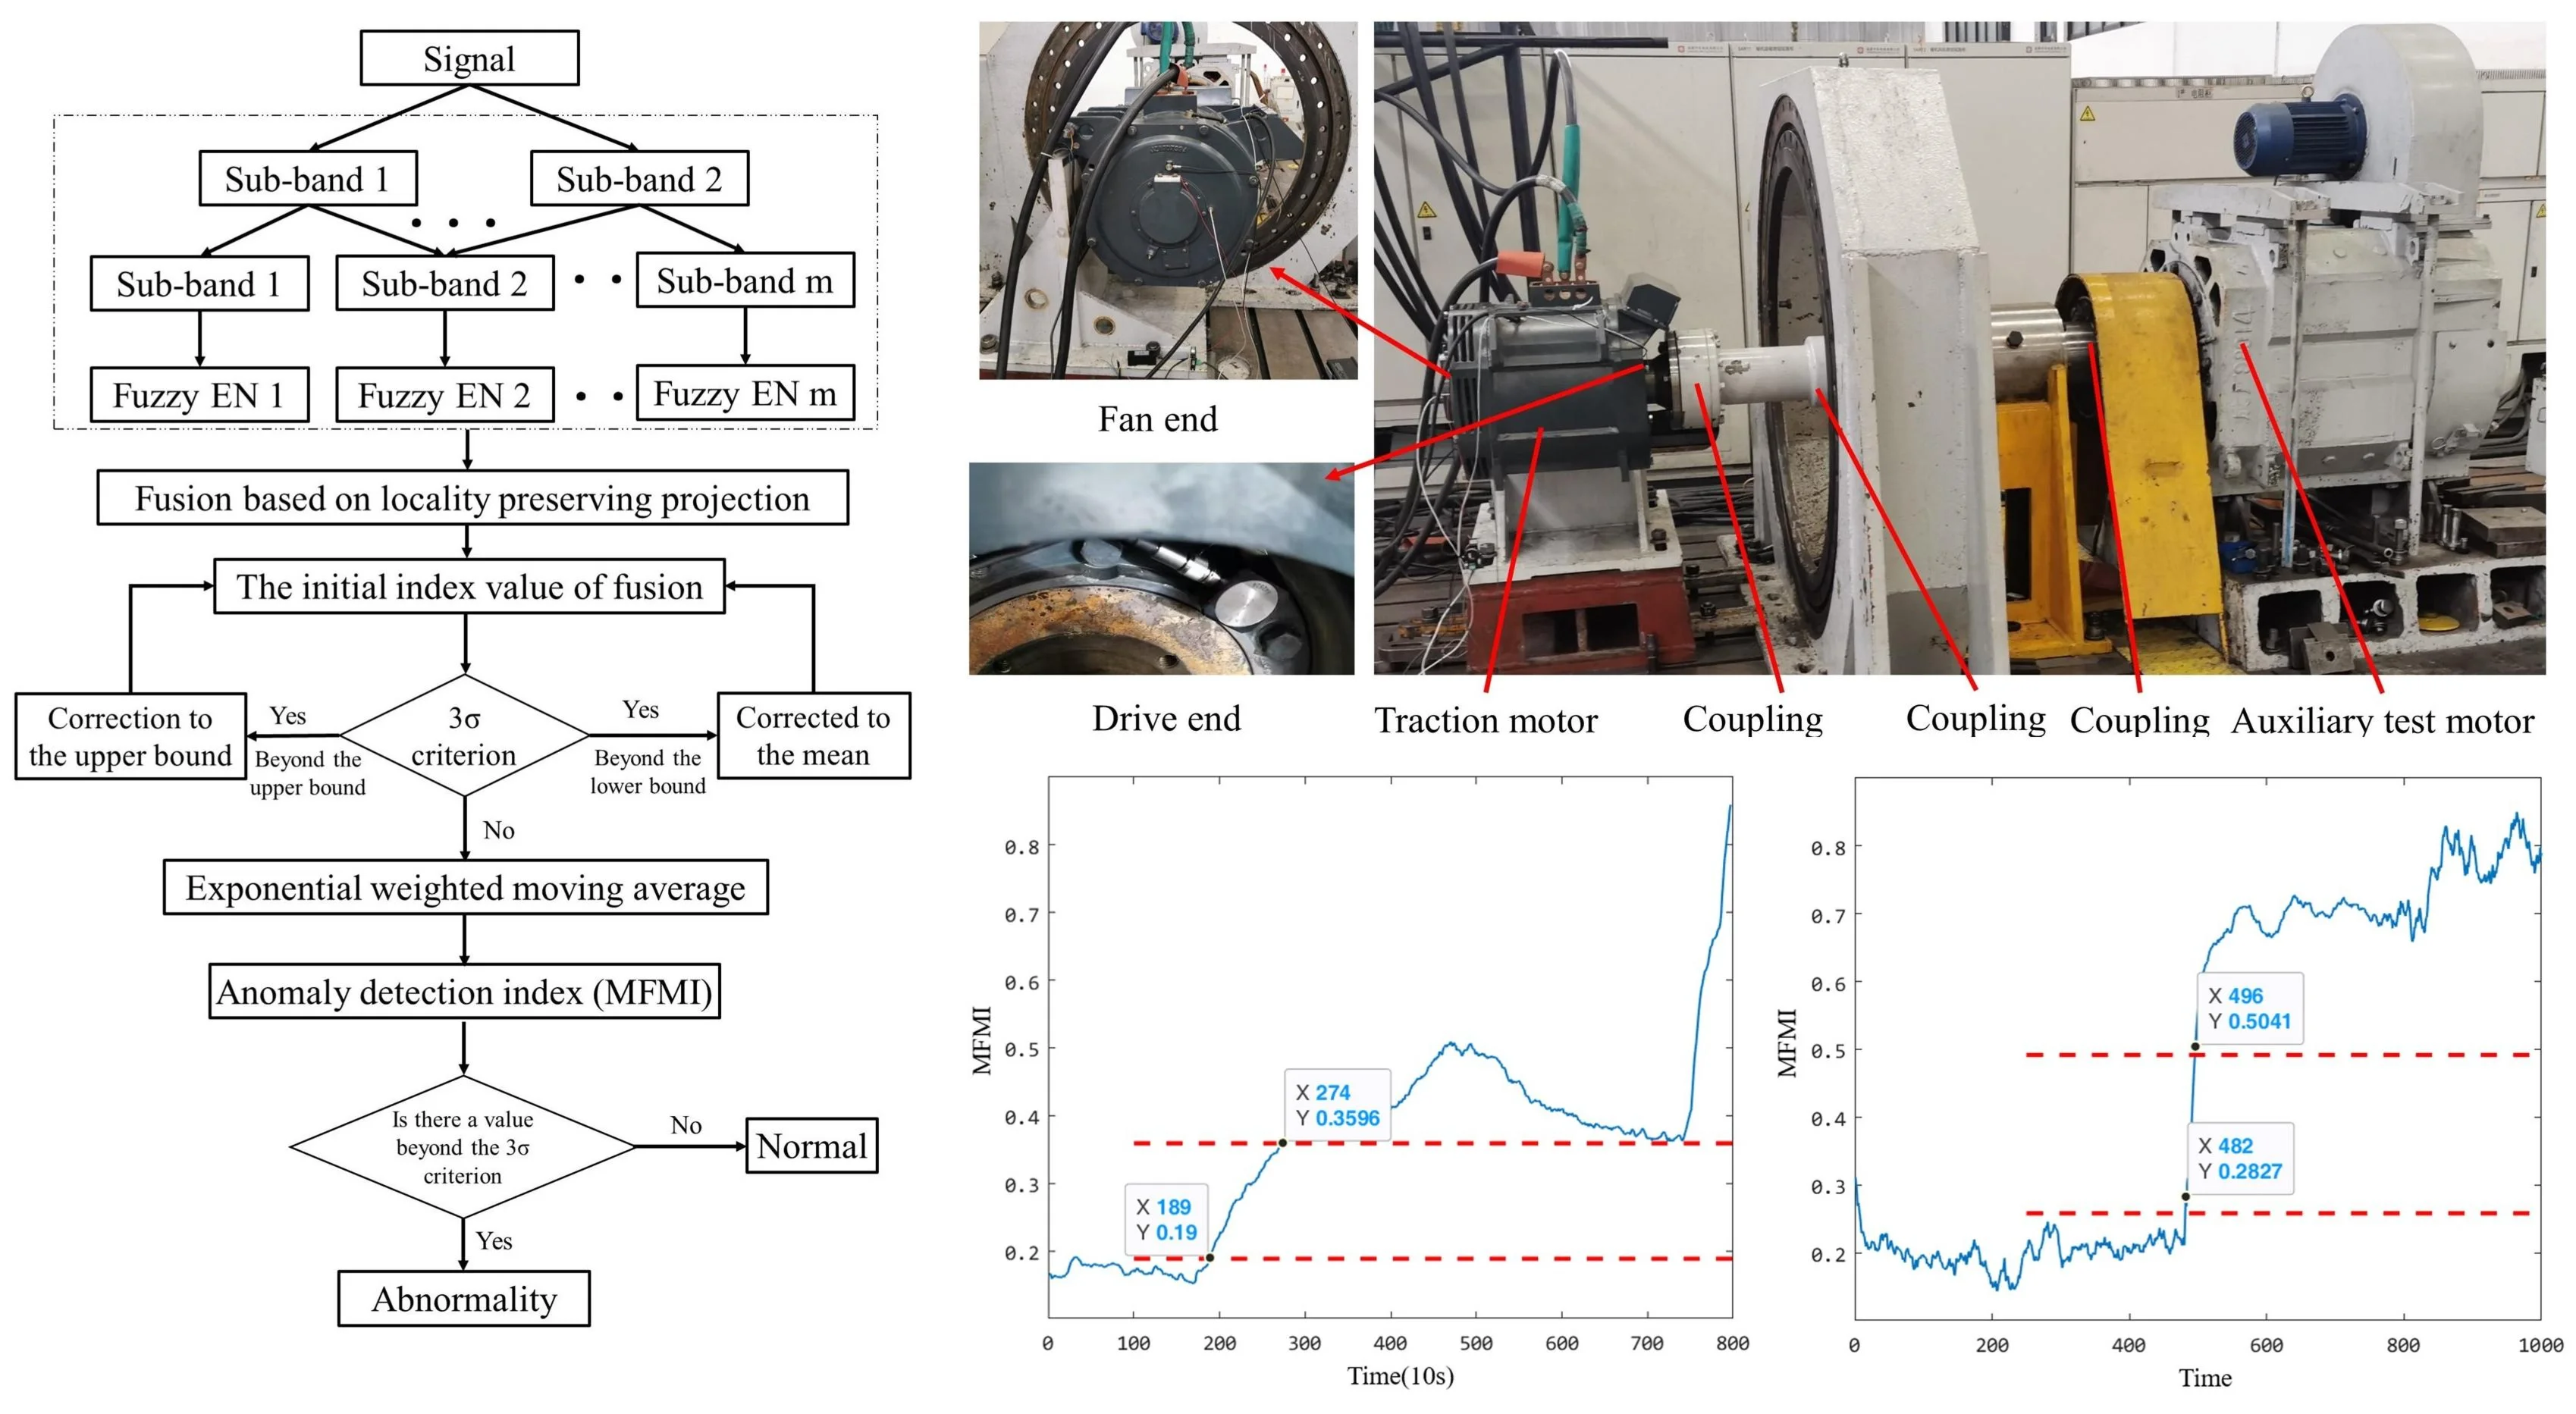
In this chapter, an anomaly detection method based on multi-scale sub-band fuzzy entropy manifold fusion index (MFMI) is proposed to solve the problem that in the early fault of motor bearing, the weak fault signal leads to the difficulty in determining the starting point of early fault and the lack of sensitivity to the fault development trend. Firstly, the vibration signal of the bearing is decomposed at multiple scales to capture the local details of the bearing 's health state. Then, the fuzzy entropy values at each scale are calculated, and the fault information at different scales is quantitatively described. Finally, the unsupervised locality preserving projection method is used to preserve the geometric features of the original nonlinear feature structure while minimizing the multi-scale high-dimensional features. Compared with the traditional abnormal evaluation index, the proposed method can accurately and effectively predict the early fault starting point of the motor bearing, and has a strong sensitivity to the development trend of the fault. The following is the specific steps and pseudo code, as shown in Fig. 7 is the flow chart of the steps.
Fig. 7Process of bearing anomaly detection method based on MFMI
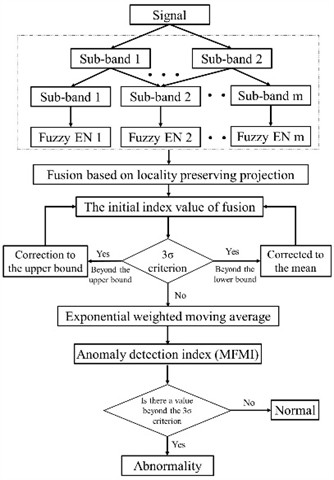
Table 1Algorithm: bearing anomaly detection based on MFMI
Input: Vibration signal Output: Anomaly detection result (Normal/Abnormal) |
1: Pre-process the vibration signal 2: Decompose into multiple sub-bands ⟨Multi-scale decomposition⟩ 3: for each sub-band do 4: Calculate fuzzy entropy value for 5: end for 6: Fuse fuzzy entropy values using locality preserving projection 7: Obtain initial index value from the fusion result 8: Perform adaptive correction: if exceeds upper bound: Correct to the upper bound else if is below lower bound: Correct to the mean 9: Apply Exponentially Weighted Moving Average (EWMA) to the corrected index values 10: Calculate the anomaly detection index (MFMI) using the EWMA results 11: Check if the MFMI value exceeds the 3 criterion: if MFMI > upper bound: Return “Abnormal” else: Return “Normal” |
Step 1: The vibration signal is pre-processed, and the vibration signal of the bearing is decomposed into multiple scales.
Step 2: The fuzzy entropy values at different scales are calculated, and the fault information at different scales is quantitatively described.
Step 3: Through the unsupervised locality preserving projection method, the geometric features of the original nonlinear feature structure are retained while minimizing the multi-scale high-dimensional features.
Step 4: By adaptive processing of the abnormal value of the index, the overestimation and underestimation of the bearing health state are punished, and the abnormal value of the index is corrected.
Step 5: By exponentially weighted moving average, newer data points are given greater weight, more sensitive to recent data, and capture short-term trends and changes in the data.
Step 6: According to the 3 criterion, it is judged whether there is an index value exceeding the upper bound of 3. If it appears, it indicates that the bearing health state is abnormal. This is the starting point of early degradation.
4. Experimental verification
In order to fully demonstrate the effectiveness and generalization ability of the proposed method, in this section, we verify the bearing anomaly detection algorithm through two examples, including the FEMTO open data set and the data set obtained on the traction motor bearing test bench.
4.1. Case 1
In this section, the FEMTO bearing life data set [20] provided by Sherbrooke University in Canada is used to verify the effectiveness of the proposed method. The composition of the test bench is shown in Fig. 8. The specific speed of the test bearing is 1500/1650/1800 rpm, the load is 4000/4200/5000 N, the sampling frequency is 25.6 kHz, and the sampling is 0.1 s every 10 s. The experimental verification part of this paper uses the full life data of Bearing 1_1 and Bearing 2_2 bearings in the data set.
As shown in Fig. 9, the full-life time-domain vibration data of the Bearing 1_1 and Bearing 2_2 bearings in the data set are 1800 rpm/1650 rpm, and the working load is 4000 N/4200 N.
Fig. 8FEMTO bearing data set test bench
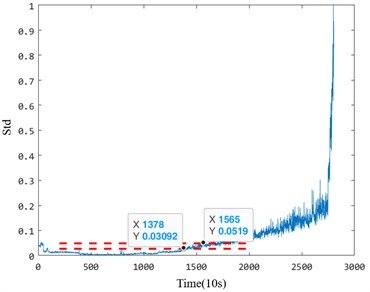
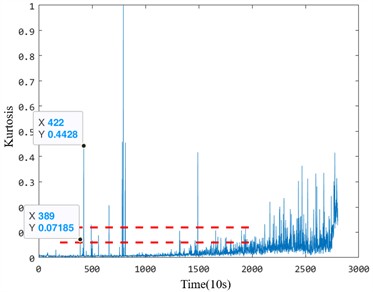
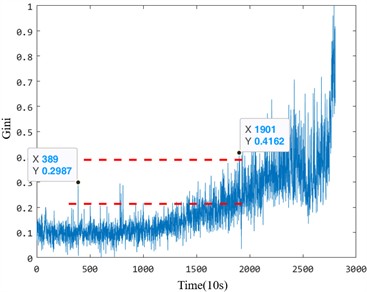
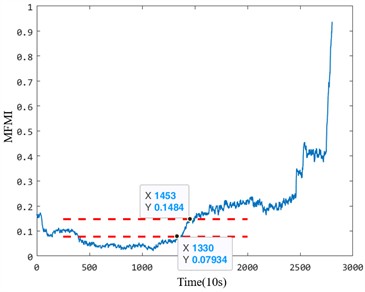
The effective value, standard deviation, kurtosis, Gini index and multi-scale sub-band fuzzy entropy fusion features are calculated for the whole life time domain vibration data. In order to calculate the early degradation sensitivity of the index and facilitate the comparison of different indexes, normalization is needed to eliminate the influence of dimension. At the same time, in order to eliminate the influence of the bearing running-in period, the starting point of bearing fault is determined after 10 % time point. According to the proposed health index sensitivity analysis scheme, the data are analyzed, and the corresponding running state evaluation results of the bearing are obtained. The results are shown in Fig. 10-11.
Fig. 9Original signal
a) Bearing 1_1
b) Bearing 2_2
Fig. 10The anomaly detection results of Bearing 1_1
It can be seen from the multiple health evaluation indexes in the life-cycle data of the two sets of bearings that there will be multiple different health states during the service of the bearings. With the operation of the bearing, the overall health status indicators can reflect the rising trend. First of all, the first stage is the normal operation stage. During the initial operation, the bearing will continue to run in, the surface roughness of the bearing raceway will become smooth, and the lubricating film will become more stable with the continuous operation of the equipment. Therefore, there will be a certain degree of decline in the change of health status indicators. With the operation of the bearing, the small cracks of the bearing are generated, the health status is gradually degraded, and the health index is rising. With the increase and diffusion of the internal defects of the bearing, the rotating bodies contacted between different faults grind each other, and the index decreases steadily, showing a short-term downward trend. The decrease of the index value at this stage is easy to overestimate the health status of the bearing, which brings challenges to the health status identification of the bearing. Finally, due to the accumulation of faults, the bearing degradation process is accelerated until failure.
Fig. 11The anomaly detection results of Bearing 2_2
In the early degradation stage, the five indicators evaluated under the same criterion demonstrate varying degrees of sensitivity to faults. However, the proposed fusion index based on manifold learning exhibits a significant amplitude change during early degradation, allowing it to detect faults much earlier than the other four health indicators. For instance, in the Bearing 1_1 case, the proposed index identified the bearing as abnormal at the 1330th time point, whereas the effective value, standard deviation, kurtosis, and Gini index could only detect early damage after the 1378th time point. This delay highlights the insufficient sensitivity of the comparison indices to early degradation processes. Particularly, the kurtosis and Gini indices, while theoretically sensitive to impacts, are prone to interference from outliers during the normal operation stage, leading to inaccuracies in identifying the exact starting point of degradation.
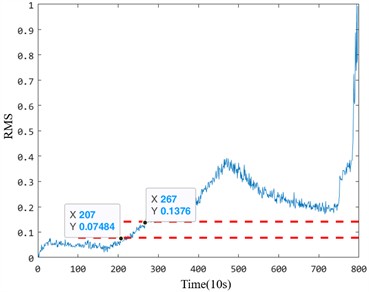
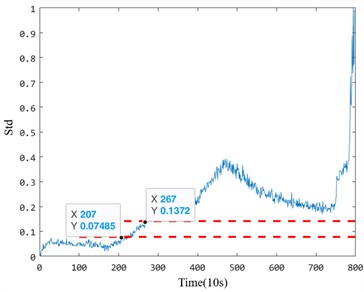
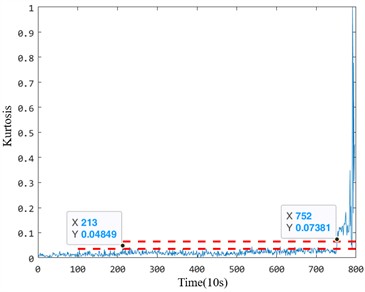
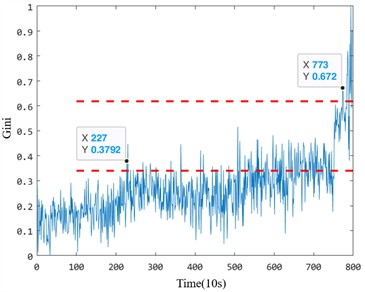
Similarly, for the Bearing 2_2 case, the proposed index detected early anomalies at the 189th time point, whereas the other four indicators detected faults only after the 200th time point. Notably, the Gini index displayed higher sensitivity than kurtosis but was still less effective than the proposed index in capturing early-stage degradation trends. These results emphasize that the proposed method provides a more reliable and accurate indication of early degradation onset.
Table 2Sensitivity analysis of bearing performance degradation evaluation index
Bearing | Index | RMS | Std | Kurtosis | Gini | MFMI |
Bearing 1_1 | Starting point | 1378 | 1378 | – | 1330 | |
Sensitivity | 1.112 | 1.122 | 5.615 | |||
Bearing 2_2 | Starting point | 207 | 207 | 213 | 227 | 189 |
Sensitivity | 100 | 100 | 4.698 | 53.626 | 200 | |
To further analyze the performance differences between the five anomaly detection indices, two evaluation parameters – early degradation starting point and early degradation sensitivity – were used to quantify the characteristics of each indicator. Table 2 presents the detailed calculation results. The results demonstrate that the proposed index outperforms the other indicators in both accurately identifying the early damage onset and maintaining high sensitivity to early degradation trends. For example, the sensitivity of the proposed index (5.615 for Bearing 1_1 and 200 for Bearing 2_2) significantly exceeds that of the Gini and kurtosis indices, which suffer from instability during normal operation and limited responsiveness to early degradation stages.
However, the effective value, standard deviation, and kurtosis indices are more responsive to the performance of late degradation behavior compared to the proposed method. This indicates that these indices may be better suited for applications focusing on advanced degradation stages. Nonetheless, in practical engineering scenarios, where the primary objective is to ensure uninterrupted operation and proactively address potential failures, early-stage detection is more critical. Maintenance and replacement decisions are often made long before a bearing approaches the end of its service life. Consequently, this paper emphasizes the early degradation stage, where the proposed index excels in sensitivity and accuracy.
Moreover, the degradation characteristics after manifold dimension reduction fusion provide a comprehensive reflection of the bearing’s state across its entire lifecycle – from normal operation to damage and eventual failure. The proposed index maintains stability during normal operation, avoids interference from outliers, and shows strong sensitivity to abnormal states. These attributes make the proposed method highly feasible and reliable for identifying the abnormal states of traction motor bearings.
4.2. Case 2
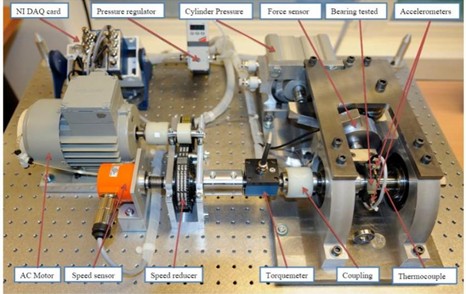
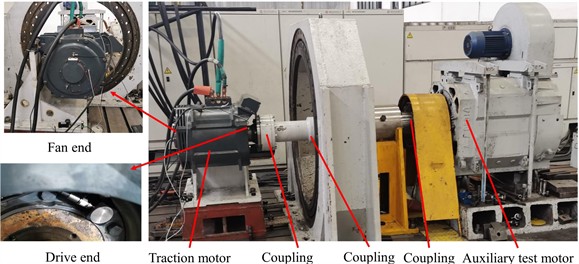
In order to further verify the practicability and superiority of the diagnostic model proposed in this paper, the insulation bearing test of the track traction motor was carried out. The test platform is composed of traction motor and auxiliary test motor. Among them, the test traction motor is the 80 km/h subway traction motor YQ-190. The YQ-190 series subway motor is the main traction motor for subway vehicles in China at present. It has many application achievements, high product quality, reliable performance, rich interface, and meets the market demand. At present, more than 20 models have been derived, which are suitable for A-type and B-type subway vehicles, covering 80 km/h-120 km/h speed grades, and successfully serving multiple subway lines. The type of insulation bearing for motor drive end test is 6215, and the type of insulation bearing for motor non-drive end test is NU216. The test platform is shown in Fig. 12.
Fig. 12FEMTO bearing data set test bench
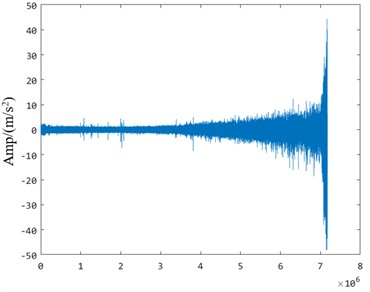
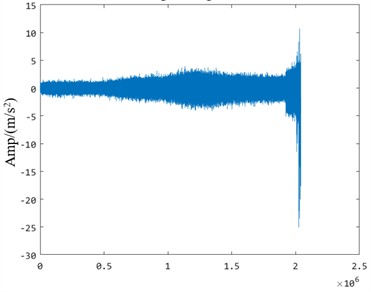
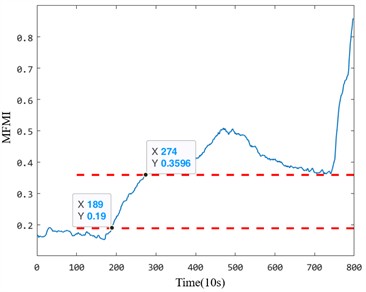
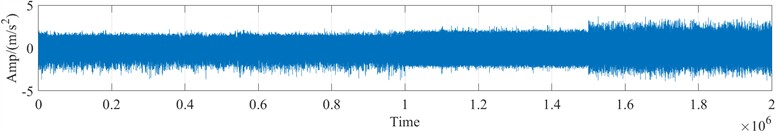
In order to identify the damage accumulation process from the normal state to the early damage of the insulation bearing of the traction motor, the proposed multi-scale fuzzy entropy evaluation index of the health status of the insulation bearing is used to analyze the signals collected by the traction motor test bench. The time domain diagram of the vibration signal of the insulation bearing of the traction motor from normal to raceway damage is shown in Fig. 13.
Fig. 13Time domain diagram of health state degradation vibration of traction motor insulation bearing
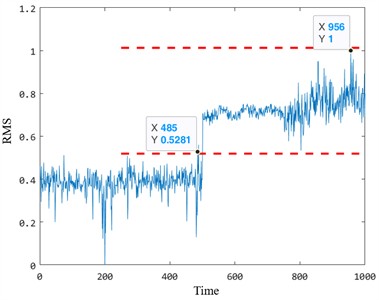
The effective value, standard deviation, kurtosis, Gini index and multi-scale sub-band fuzzy entropy fusion features are calculated for the time-domain vibration data of the health state degradation of the insulation bearing of the traction motor. In order to eliminate the influence of dimension between different features and evaluate the performance of each feature index in early degradation sensitivity, the extracted feature parameters must be normalized in equal proportion. This processing method ensures that all characteristic parameters are compared at the same scale, so as to achieve more effective feature analysis and evaluation. After 250 samples are selected, the starting point of bearing fault is determined, and the data are analyzed according to the proposed health index sensitivity analysis scheme to obtain the corresponding running state evaluation results of the bearing. The results are shown in Fig. 14.
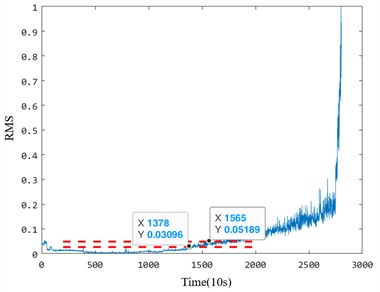
From the multiple health evaluation indicators in the figure, it can be seen that in the degradation stage, according to the same evaluation criterion, the five indicators have undergone major changes at about 500 time points, and they also show different degrees of sensitivity to faults. Among them, the dimension reduction results of manifold learning are relatively stable in the normal operation stage, and the amplitude mutation occurs in the early degradation behavior, and the detected fault occurs much earlier than the other four health indicators. The figure is the proposed multi-scale fuzzy entropy insulation bearing health status evaluation index. It can be seen that according to the proposed early fault starting point determination method, the traction motor insulation bearing is judged to have early damage at the 482-th time point. The effective value, standard deviation, kurtosis and Gini index can only identify the early damage of the bearing after the 482 or 500 time point. And it is obvious that the sensitivity of the comparison index is insufficient, and there is no strong reaction to the early degradation process of the bearing. In order to further compare and analyze the advantages and disadvantages of the five degradation characteristics, two evaluation parameters of early degradation starting point and early degradation sensitivity were used to quantitatively evaluate the five degradation characteristics. Table 3 is the calculation results of five health status evaluation indicators.
Fig. 14Abnormal detection results of insulated bearings
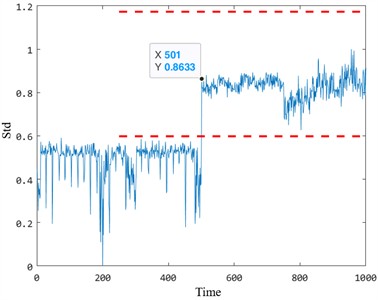
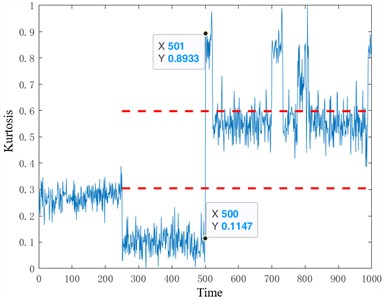
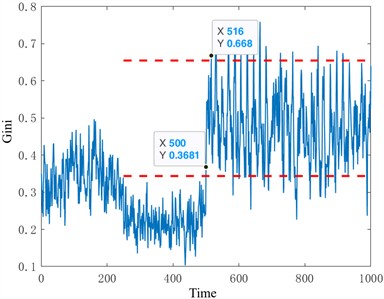
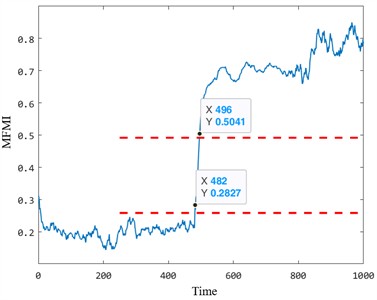
The results in Table 3 demonstrate that the proposed index outperforms the other four indicators in identifying the starting point of early damage in bearings. The proposed method identified early damage at the 482nd time point, earlier than the Gini index (500th time point) and significantly earlier than the standard deviation and kurtosis indices. While the Gini index exhibits slightly higher sensitivity to the early degradation trend (0.0187 compared to 0.0158 for the proposed index), its instability during the normal operation stage diminishes its practical utility in real-world applications. Specifically, the Gini index is prone to fluctuations caused by noise and operational outliers, which can obscure the identification of the true degradation onset.
Additionally, the early degradation stage judgment method proposed in this paper highlights limitations in detecting the end point of early degradation for standard deviation and kurtosis indices. This is primarily due to the significant fluctuations in these indices during the normal operation stage of the traction motor. In contrast, the proposed index remains stable during normal operation, avoiding interference from noise and outliers. This stability, coupled with its ability to detect the early degradation starting point more accurately, underscores the practicality and reliability of the proposed method for health assessment of real traction motor insulation bearings.
Based on the above analysis, the proposed multi-scale sub-band fuzzy entropy fusion degradation index demonstrates the best comprehensive performance. Unlike traditional indicators, it provides a clear and consistent expression of the degradation trend, capturing the essence of fault characteristics while detecting the starting time of performance degradation earlier. These features make it a robust and reliable choice for identifying abnormal states in traction motor bearings, ensuring timely maintenance and minimizing operational disruptions.
Table 3Sensitivity analysis of bearing performance degradation evaluation index
Index | RMS | Std | kurtosis | Gini | MFMI |
Starting point | 485 | 501 | 501 | 500 | 482 |
Sensitivity | 9.8313e-04 | – | – | 0.0187 | 0.0158 |
5. Conclusions
In the early fault detection of motor bearings, weak fault signals make it challenging to pinpoint the initial fault occurrence and to maintain sensitivity to fault progression. To address this, we proposed an anomaly detection method based on the multi-scale sub-band fuzzy entropy manifold fusion index (MFMI). Unlike traditional evaluation metrics, this method captures local details of bearing health through coarse-grained processing, accurately identifying the early fault initiation point and exhibiting strong sensitivity to fault development trends. The effectiveness of the proposed algorithm was validated using the FEMTO bearing life dataset and a traction motor test platform from Sherbrooke University, Canada. Results demonstrate that the MFMI method aligns with the degradation process of mechanical systems, offering significant advantages over traditional approaches in detecting early degradation points, improving sensitivity to fault progression, and providing more detailed fault representations. This makes it particularly effective for identifying anomalies in insulation bearings at an earlier stage.
In future work, we aim to extend the application of MFMI to more complex scenarios, such as detecting diverse early fault types and enabling cross-device model transfer for anomaly detection.
References
-
T. Yan, D. Wang, T. Xia, J. Liu, Z. Peng, and L. Xi, “Investigation on optimal discriminant directions of linear discriminant analysis for locating informative frequency bands for machine health monitoring,” Mechanical Systems and Signal Processing, Vol. 180, p. 109424, Nov. 2022, https://doi.org/10.1016/j.ymssp.2022.109424
-
Z. Zhao, S. Wu, B. Qiao, S. Wang, and X. Chen, “Enhanced sparse period-group lasso for bearing fault diagnosis,” IEEE Transactions on Industrial Electronics, Vol. 66, No. 3, pp. 2143–2153, Mar. 2019, https://doi.org/10.1109/tie.2018.2838070
-
H. Zhou, H. Li, T. Liu, and Q. Chen, “A weak fault feature extraction of rolling element bearing based on attenuated cosine dictionaries and sparse feature sign search,” ISA Transactions, Vol. 97, pp. 143–154, Feb. 2020, https://doi.org/10.1016/j.isatra.2019.08.013
-
I. Howard and I. M. Howard, “A review of rolling element bearing vibration: detection, diagnosis and prognosis,” DSTO Aeronautical and Maritime Research Laboratory, 1994.
-
W. Zhu et al., “Evaluation method of rolling bearing performance degradation based on random matrix theory and principal component analysis,” (in Chinese), Journal of Xi ’an Jiaotong University, Vol. 55, No. 2, pp. 55–63, 2021.
-
X. Wan, W. Sun, K. Chen, and X. Zhang, “State degradation evaluation and early fault identification of wind turbine bearings,” Fuel, Vol. 311, p. 122348, Mar. 2022, https://doi.org/10.1016/j.fuel.2021.122348
-
L. Liao, “Discovering prognostic features using genetic programming in remaining useful life prediction,” IEEE Transactions on Industrial Electronics, Vol. 61, No. 5, pp. 2464–2472, May 2014, https://doi.org/10.1109/tie.2013.2270212
-
N. Zhang, L. Wu, Z. Wang, and Y. Guan, “Bearing remaining useful life prediction based on Naive Bayes and Weibull distributions,” Entropy, Vol. 20, No. 12, p. 944, Dec. 2018, https://doi.org/10.3390/e20120944
-
I. Meddour, S. E. Messekher, R. Younes, and M. A. Yallese, “Selection of bearing health indicator by GRA for ANFIS-based forecasting of remaining useful life,” Journal of the Brazilian Society of Mechanical Sciences and Engineering, Vol. 43, No. 3, pp. 1–14, Feb. 2021, https://doi.org/10.1007/s40430-021-02878-w
-
M. Demetgul, K. Yildiz, S. Taskin, I. N. Tansel, and O. Yazicioglu, “Fault diagnosis on material handling system using feature selection and data mining techniques,” Measurement, Vol. 55, pp. 15–24, Sep. 2014, https://doi.org/10.1016/j.measurement.2014.04.037
-
H. Yang, W. D. Li, K. X. Hu, Y. C. Liang, and Y. Q. Lv, “Deep ensemble learning with non-equivalent costs of fault severities for rolling bearing diagnostics,” Journal of Manufacturing Systems, Vol. 61, pp. 249–264, Oct. 2021, https://doi.org/10.1016/j.jmsy.2021.09.009
-
J. Zhu, N. Chen, and C. Shen, “A new deep transfer learning method for bearing fault diagnosis under different working conditions,” IEEE Sensors Journal, Vol. 20, No. 15, pp. 8394–8402, Aug. 2020, https://doi.org/10.1109/jsen.2019.2936932
-
Zheng, Wang, and Liu, “On-line anomaly detection of wind turbines based on multi-level spatio-temporal graph neural network,” (in Chinese), Power System Automation, Vol. 48, No. 5, pp. 107–119, 2024.
-
Y. Wang et al., “On-line detection method for early faults of rolling bearings based on comparative learning,” (in Chinese), Vibration and Impact, Vol. 42, No. 14, pp. 229–236, 2023.
-
A. Babiker et al., “Initial fault time estimation of rolling element bearing by backtracking strategy, improved VMD and infogram,” Journal of Mechanical Science and Technology, Vol. 35, pp. 425–437, 2021.
-
K. Vos, Z. Peng, C. Jenkins, M. R. Shahriar, P. Borghesani, and W. Wang, “Vibration-based anomaly detection using LSTM/SVM approaches,” Mechanical Systems and Signal Processing, Vol. 169, p. 108752, Apr. 2022, https://doi.org/10.1016/j.ymssp.2021.108752
-
I. El-Thalji and E. Jantunen, “A summary of fault modelling and predictive health monitoring of rolling element bearings,” Mechanical Systems and Signal Processing, Vol. 60-61, pp. 252–272, Aug. 2015, https://doi.org/10.1016/j.ymssp.2015.02.008
-
B. Hou, D. Wang, T. Yan, and Z. Peng, “A comparison of machine health indicators based on the impulsiveness of vibration signals,” Acoustics Australia, Vol. 49, No. 2, pp. 199–206, Mar. 2021, https://doi.org/10.1007/s40857-021-00224-7
-
X. He and P. Niyogi, “Locality preserving projections,” in Advances in Neural Information Processing Systems, 2003.
-
P. Nectoux et al., “PRONOSTIA: An experimental platform for bearings accelerated degradation tests,” in IEEE International Conference on Prognostics and Health Management, 2012.
About this article

Financial support from Guangdong Basic and Applied Basic Research Fund Enterprise Joint Fund (Offshore Wind Power) Project (Grant No. 2022A515240043), Guangdong Natural Science Foundation Project (Grant No. 2023A1515012698) and the Research Project of Lingnan Normal University (Grant No. LT2405) is appreciated.
The datasets generated during and/or analyzed during the current study are available from the corresponding author on reasonable request.
Guangbin Wang: conceptualization, formal analysis, funding acquisition, investigation, project administration, resources, writing-review and editing. Shubiao Zhao: conceptualization, data curation, methodology, software, validation, visualization, writing-original draft preparation. Zhixian Zhong: funding acquisition, project administration, supervision. Ying Lv: formal analysis, funding acquisition. Changsheng Shao: formal analysis, project administration. Hui Zhang: conceptualization, writing-original draft preparation.
The authors declare that they have no conflict of interest.
