Abstract
High order spectrum is a powerful tool for processing the nonlinear and non-Gaussian signals of rotating machinery. As one typical representative of high order spectrum, the bispectrum analysis method has been used widely due to its advantages of low order and effective algorithm. However, traditional bispectrum analysis method based on single channel information often results in inconsistent fault feature extraction results while analyzing the phase coupling of complex vibration signals collected from two different measurement directions at the same measurement point, which will have great negative impact on subsequent rotor dynamic balancing experiment requiring phase information or fault diagnosis. The full vector spectrum analysis method based on dual channel homologous information fusion is an improved method of original two classical homologous information fusion methods (holographic spectrum and full spectrum), which could extract the dual channel fusion features while preserving the original information effectively. To overcome the shortcomings of traditional bispectrum and take advantages of full vector spectrum, a novel bispectrum analysis method based on full vector spectrum analysis is proposed. The proposed method could integrate the dual channel signal information effectively to display the secondary phase coupling comprehensively and accurately, fully reflect the nonlinear feature information contained in the signal, and provide accurate and reliable basis for feature extraction and fault diagnosis in the next step, whose effectiveness and advantage are verified through simulation and experiment.
1. Introduction
Vibration signal processing methods have been used widely in fault diagnosis [1]. However, most of the vibration signal processing methods are based on single channel, and these methods have the disadvantage of missing information, which leads to one-sided diagnosis results. To solve the about problems, kinds of information fusion methods have been proposed, which could be divided into two main categories: feature level fusion and data channel level fusion.
In terms of feature level fusion research, a feature extraction method for mixed faults of inter-shaft bearing based on homologous information and Hjorth parameters is proposed [2]. A multi-information fusion axial attention mechanism is proposed [3], which extracts the feature channel information and the number axis location information simultaneously, retaining and highlighting the response of key fault features while suppressing interference information. Multimodal homologous features of the gearbox vibration measurements are first separated in time, frequency and wavelet modalities, respectively, a Gaussian-Bernoulli deep Boltzmann machine (GDBM) without final output is suggested subsequently to learn pattern representations for features in each modality [4]. A multi-sensor feature-adaptive synchronous weighted fusion algorithm for blade crack damage identification is proposed [5], which combines the advantages of data-level and feature level fusion. To solve the problem of the previous root cause diagnosis methods ignoring the more crucial temporal information between multisensory time series, a novel root cause diagnosis method named as multisensory time-series causality discovery is proposed for industrial processes fault diagnosis [6]. Unfortunately, information fusion at the feature layer is highly likely to result in the loss of key features buried in the original signal [7]. Besides, machine learning is the necessary subsequent step of information fusion at the feature layer to realize fault diagnosis, which leads to low efficiency and has great limitations in engineering applications.
Compared with feature level fusion, data channel level fusion could preserve the original information more effectively while providing comprehensive feature information. Holographic spectrum [8], full spectrum [9] and full vector spectrum [10] are the typical representations of the data channel level fusion. As pointed in reference [11], both the Holographic spectrum and full spectrum have the limitations in expression of maps. Though full vector spectrum solves the above shortcomings of holographic spectrum and full spectrum to some extent, it does not have the ability of fusing nonlinear, non-stationary vibration signals due to the reason that it only takes Fourier transform to obtain the fault feature information. To address the above issue of full vector spectrum, kinds of nonlinear time-frequency analysis methods such as empirical mode decomposition (EMD), wavelet transform (WT) and so on have been proposed based on or combined with full vector spectrum: The local characteristic-scale decomposition is combined with full vector spectrum for gearbox fault diagnosis [12]. A bivariate full vector envelope technique by combining full vector spectrum with complex local mean decomposition is proposed to extract fault feature of rotor [13]. Although its excellent virtues in nonlinear and non-stationary signal processing, EMD has its own inherent problems such as lack of complete theoretical basis, mode mixing, and long computation time etc. [14]. As for WT, it is a non-adaptive decomposition method, whose basic functions and thresholds depend on subjective experience [15]. As one of the non-stationary signal processing methods, high order spectral analysis is a powerful tool for analyzing nonlinear and non-Gaussian signals. It can describe quantitatively the nonlinear phase coupling in signals [16-17]. Among the high-order spectral analysis methods, bispectrum has the lowest order and the simplest processing. Meanwhile, bispectrum contains all the characteristics of high-order spectral, making it being the most widely used high order spectral method in fault diagnosis [18-22]. Inspired by the aforementioned improved full vector spectrum methods and the advantages of bispectrum, this paper attempts to combine the full vector spectrum with bispectrum, and proposes a bispectrum analysis method based on dual channel homologous information fusion. Feasibility and effectiveness of the proposed method is verified through simulation and experiment. The main innovations of the paper are as follows:
1) The shortcomings of traditional single channel information based bispectrum analysis method in analyzing phase coupling phenomenon existed in complex signal is verified.
2) Based on the concept of full vector spectrum, a novel bispectrum analysis method based on dual channel homologous information fusion is proposed, which not only retains the ability of bispectrum in analyzing nonlinear signals but also has effectiveness and advantage in analyzing phase coupling phenomenon existed in complex signal.
The rest of the paper is organized as follows: Section 2 is the basic theory. Section 3 and Section 4 are the simulation and experiment to verify effectiveness and advantage of the proposed method. Conclusion is obtained at Section 5.
2. Basic theory
2.1. Full vector spectrum
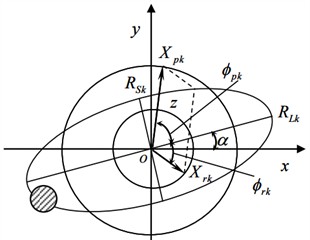
The rotor exhibits vortex phenomena under the combined action of various harmonic frequencies, and its vortex trajectory is the superposition of a series of ellipses, which represent the axis trajectory of the rotor under different rotational harmonics. As shown in Fig. 1, the major axis of an ellipse is defined as under various rotational harmonics, which is named as principal vibration vector. The short axis of an ellipse is defined as , which is named as auxiliary vibration vector. The angle between the principal vector and the -axis is , and the phase angle is while the axis moves along an elliptical trajectory. The motion trajectory of the rotor axis under single harmonic could be determined uniquely and accurately by the above four parameters. The elliptical motion trajectory of the rotor under single harmonic can be regarded kinetically as the synthesis of two circular trajectories with the same frequency but in opposite precession directions. Among them, the circle that coincides with the precession direction of the rotor itself is called the positive precession circle, and its radius is represented by . The circle opposite to the direction of rotor precession is called the anti-precession circle, and its radius is represented by . The initial phase angles of two circles are represented by and respectively. The rotation frequency of the two circles is equal to the rotation frequency of the rotor itself.
Fig. 1Axis trajectory of a composite ellipse with two circles
The relationships among the above-mentioned parameters are as following:
The numerical calculations of full vector spectrum are as follows:
Suppose and () are the discrete sequences in and directions, and their Fourier transforms (FTs) are represented by and (), in which , , , are the real part sequence and imaginary part sequence of and , Then:
Construct complex sequence by using , :
Apply FT on Eq. (3), and the following equation could be obtained by using the characteristics of FT:
Let , represent the real part sequence and imaginary part sequence:
The following relationships could be obtained based on the above equations:
Then:
2.2. Bispectrum
Let be order stationary stochastic process with zero mean, and its order cumulative is defined as:
If is accumulative absolutely:
Then the -order cumulant spectrum is defined as the dimensional discrete Fourier transform of the -order cumulant, i.e:
Bispectrum :
Bispectrum has the following characteristics:
1) Bispectrum is complex value, and it has amplitude and phase:
2) Bispectrum is double periodic function with period :
3) Bispectrum has the following symmetric form:
in which represents complex conjugation.
Bispectrum estimation is an effective method for analyzing the quadratic phase coupling and nonlinear characteristic information of random signals. However, the display of bispectrum method is not intuitive enough and the computational complexity is relatively large. Therefore, the concept of 1 (1/2) dimensional spectrum is proposed.
Let be random variable, and its third-order cumulants is represented by . The one-dimensional FT of the diagonal slices of is defined as 1(1/2) dimensional spectrum, that is :
The Eq. (17) could be rewritten as:
The 1(1/2) dimensional spectrum is actually the diagonal slice of bispectrum, so it is also known as the diagonal slice spectrum of bispectrum. It simplifies the calculation, reduces the computational complexity, and makes the display more intuitive while retaining the excellent performance of bispectrum in suppressing Gaussian noise.
2.3. Bispectrum based on dual channel homologous information fusion
By taking advantages of full vector spectrum and bispectrum, the bispectrum analysis based on dual channel homologous information fusion is proposed, and its details are as follows:
Suppose and () are the discrete sequences in and directions, and their FT are represented by and (), , , , are the real part sequence and imaginary part sequence of and . Then the amplitudes and phases of the harmonics contained in signals and () are as follows:
in which , represent the amplitudes of harmonic in , directions, and , represent the phases of harmonic in , directions.
According to the evaluation method of the full vector rotation energy spectrum, it is easy to know that the fusion rotation energy of each harmonic is the sum of the fusion strength energy of the main vibration vector and the auxiliary vibration vector based on the harmonic trajectory. Moreover, the sum of the squares of the main vibration vector and the auxiliary vibration vector of the harmonic trajectory is equal to the square of the amplitude of the signals in the and directions, that is:
Let Eq. (22) be the amplitude information, and or be the phase information:
Apply inverse Fourier transform on , and the new discrete sequences , are obtained. The sequences , are endowed with amplitude information fused with dual channel homologous signals without changing the phase information contained in the signal, which could reflect the energy intensity of each harmonic more accurately.
Apply two-dimensional discrete FT on and respectively, which are the corresponding third-order cumulants of and , and the follows are obtained:
where and are the bispectrum analysis results of and based on homologous information fusion, which could be estimated by using the following equations:
in which , are the Fourier transform of new sequences , , and represents complex conjugation.
3. Simulation
Bispectrum analysis preserves the phase and non-Gaussian information buried in the signal, and has a strong ability to suppress Gaussian noise. It is a powerful tool for processing a large number of nonlinear and non-Gaussian signals of rotating machinery. However, there are still shortcomings in bispectrum analysis. The traditional bispectrum analysis method only bases on the single channel information processing, which will lead to inconsistencies in the structure and energy of the bispectrum analysis results while analyzing signals from different channels of the same origin. The following simulation verifies its above-mentioned shortcomings.
The vibration signal often exhibits strong nonlinearity when failure arises in mechanical systems, and the quadratic phase coupling is a typical nonlinear phenomenon. Suppose that the frequencies of three sine components are , , , and their phases are , , . If , , then sine component 1 is generated by the quadratic phase coupling of component 2 and 3, and this phenomenon is called quadratic nonlinearity. Therefore, the problem of testing quadratic nonlinearity could be solved by determining whether there is quadratic phase coupling, and bispectrum is one of the most commonly used methods for testing quadratic phase coupling.
Supposing and represent two homologous signals being measured on the same location:
where , , , 30 Hz, 80 Hz, 110 Hz, 45 Hz, 135 Hz, 180 Hz, , , , are the independent random variables distributed in , and , .
It can be seen that both homologous signalsandcontain 6 components with different frequencies. Due to , , , , the component with frequency is generated by component with frequency and component with frequency through quadratic phase coupling, and the component with frequency is generated by component with frequency and component with frequency through quadratic phase coupling. In theory, all the frequency components , , , , , participating in coupling should appear on the bispectrum analysis result of signal and signal clearly.
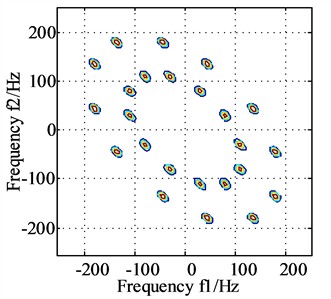
Fig. 2The bispectrums of signal x and signal y
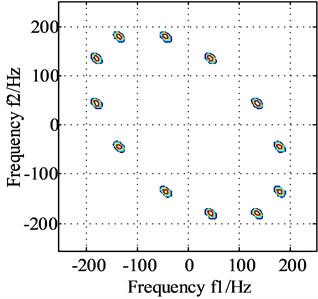
a) Bispectrum of signal
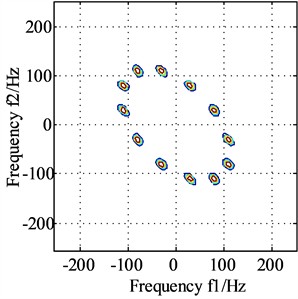
b) Bispectrum of signal
The bispectrum analysis results of signal and signal are presented in Fig. 2(a) and Fig. 2(b) respectively, and the bispectrum peaks of signal appear at frequencies (45, 135) and (135, 45), which verifies that the frequencies involved in coupling are , and . The bispectrum peaks of signalappears at frequencies (30, 80) and (80, 30), which verifies that the frequencies involved in coupling are , and . It could be concluded that the frequencies components of the two signals and signal involved in coupling are not consistent based on Fig. 2(a) and Fig. 2(b).
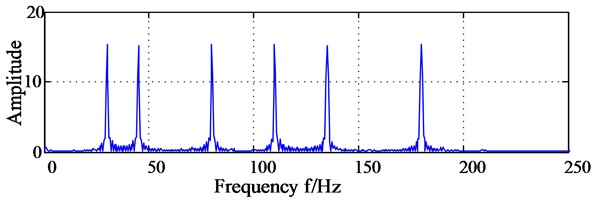
In order to observe the bispectrum differences between signal and signalmore intuitively, the diagonal slice spectrum analysis of signal and signal are made and the corresponding results are shown in Fig. 3(a) and Fig. 3(b), based on which the three spectral lines locating at 45 Hz, 135 Hz, 180 Hz are observed clearly on Fig. 3(a). Unfortunately, the spectral lines locating at , and are not displayed fully due to too weak energy. Similarly, the three spectral lines locating at 30 Hz, 80 Hz, 110 Hz are observed clearly on Fig. 3(b), and the spectral lines locating at , and are not displayed fully due to too weak energy.
Fig. 3The diagonal slice spectrum analysis results of signal x and signal y
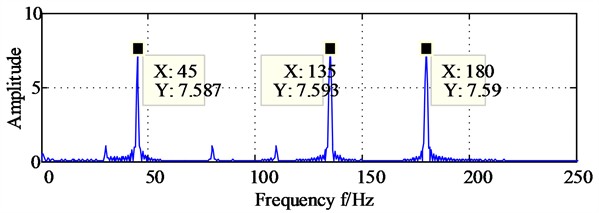
a) The diagonal slice spectrum analysis of signal
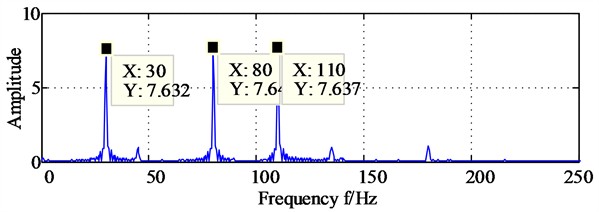
b) The diagonal slice spectrum analysis of signal
It could be found that there are significant differences in energy distribution and structure on their bispectrum analysis results between the homologous signals and , which could not fully express the secondary phase coupling information in the signals. These preliminarily verifies the problem existing in traditional bispectrum analysis based on single channel information.
The same homologous signalsandas shown in Eq. (29) are analysed by using the proposed method, and the corresponding results are presented in Fig. 4(a) and Fig. 4(b) respectively. It could be observed that the coupling frequencies are same in Fig. 4(a) and Fig. 4(b), and their spectrum peaks all appears at frequencies (45, 135), (135, 45), (30, 80) and (80, 30), which verifies that the frequencies involved in coupling are the six frequency components contained in the same source homologous signals and , and these fully complies with the expected theoretical results.
The diagonal slice spectrum analysis results of signals and after dual channel information fusion are shown in Fig. 5(a) and Fig. 5 (b) respectively, based on which the six obvious spectral lines locating on 30 Hz, 80 Hz, 110 Hz, 45 Hz, 135 Hz, 180 Hz are observed, which further indicates that all the six frequency components participate in secondary phase coupling, and these are completely consistent with the theoretical analysis results.
Fig. 4The bispectrums of signals x and y after dual channel information fusion
a) Bispectrum of signal after dual channel information fusion
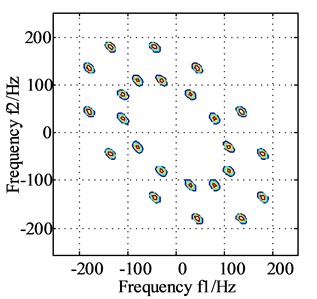
b) Bispectrum of signal after dual channel information fusion
Fig. 5The diagonal slice spectrum analysis results of signals x and y after dual channel information fusion
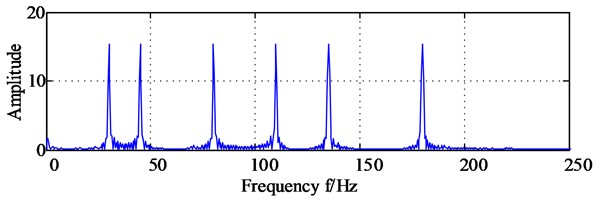
a) The diagonal slice spectrum analysis results of signal after dual channel information fusion
b) The diagonal slice spectrum analysis results of signal after dual channel information fusion
Based on the above analysis, it can be concluded that the traditional bispectrum analysis method only stays on the basis of single channel information processing, which will lead to structural and energy inconsistencies in the bispectrum analysis results of signals from different channels of the same origin. The reason is that due to the combined effect of various harmonic frequencies on the rotor, there is a vortex phenomenon, and its vortex trajectory is the superposition of a series of ellipses. When collecting vibration information in different directions on the same section of the rotor, significant differences in frequency structure and amplitude are inevitably generated, which leads to inconsistent results in the bispectrum analysis of signals from different channels, thereby affecting the accuracy and reliability of feature extraction and diagnosis. The essence of the proposed method is to introduce the full vector spectrum, one of the information fusion techniques, into the bispectrum analysis method. Firstly, the full vector spectrum technology is used to effectively fuse the dual channel signals of rotating machinery. Then, through bispectrum analysis, the nonlinear features contained in the signals are fully and accurately reflected.
4. Experiment
The test bench is shown in Fig. 6, in which the gearbox is secondary fixed axis cylindrical parallel gear, and the parameters of the gears are given in Table 1. The rotating speed of the motor is 1500 RPM, and the torque is 10 N·m. The sampling frequency is 10240 Hz with the sampling length being set as 16384 points. Machining broken teeth on the 2nd level small gear. Install sensors in both vertical and horizontal directions on the gearbox as close as possible to the faulty gear, and the corresponding time domain waveforms of the collected data in two directions are presented in Fig. 7.
Fig. 6Test bench and the broken teeth gear
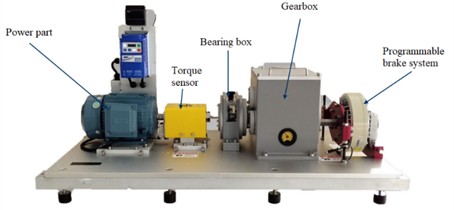
a) Test bench
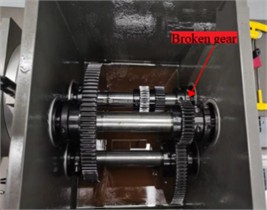
b) The broken gear
Table 1Parameters of test gears
Teeth number of the small gear on 1st level | Teeth number of the big gear on 1st level | Teeth number of the small gear on 2nd level | Teeth number of the big gear on 2nd level |
29 | 95 | 28 | 90 |
Fig. 7Time domain waveforms of the broken teeth gear in vertical and horizontal directions
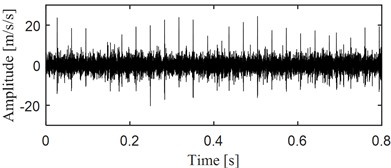
a) Time domain waveform of the broken teeth gear in vertical direction
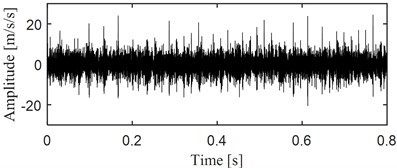
b) Time domain waveform of the broken teeth gear in horizontal direction
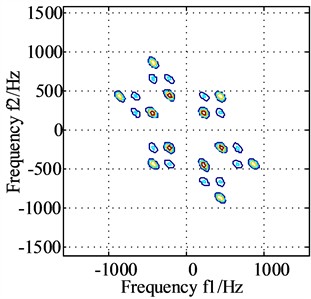
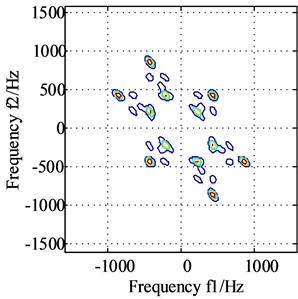
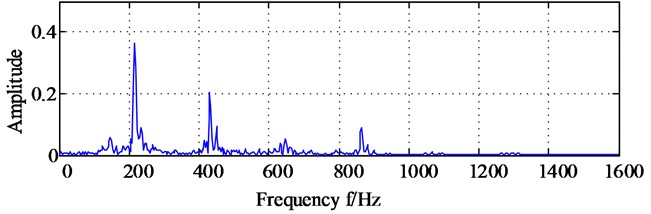
Fig. 8(a) and Fig. 8(b) are the bispectrum analysis results corresponding to the horizontal signal and the vertical direction signal. The bispectrum peaks in Fig. 8(a) and Fig. 8(b) mainly appear at frequencies (215, 215) and frequencies (430, 430) respectively, and the peaks at other frequencies are not obvious. Besides, it is easy to notice that there are significant structural differences in the nonlinear phase coupling information displayed in Fig. 8(a) and Fig. 8(b), and it is difficult to imagine that these two images come from a group of homologous signals. Fig. 9(a) and Fig. 9(b) show the diagonal slice spectra of the two channel signals. In Fig. 9(a), it can be clearly seen that the frequency component of 215 Hz is more prominent. Though there are high-order harmonics appearing in Fig. 9(a), their amplitudes are relatively smaller compared to the amplitude locating at 215 Hz. In Fig. 9(b), the frequency components of 431 Hz and 862 Hz are prominent, while other frequency components are not obvious. It can be seen that the main frequencies displayed in the two diagonal slice spectrals as shown in Fig. 9(a) and Fig. 9(b) also have significant structural differences.
Fig. 8The bispectrum of signals collected from horizontal and vertical directions
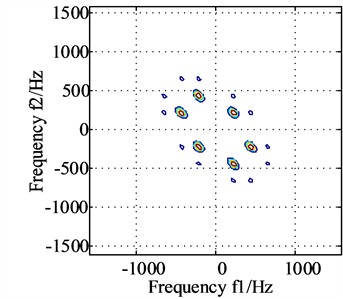
a) Bispectrum of horizontal direction signal
b) Bispectrum of vertical signal
Fig. 9The diagonal slice spectrum analysis results of signals collected from horizontal and vertical directions
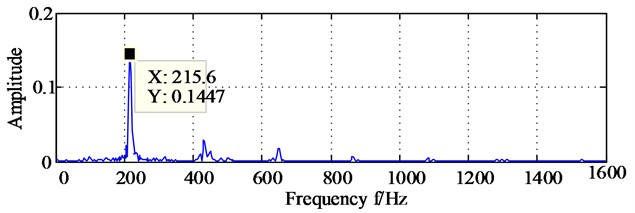
a) The diagonal slice spectrum analysis of horizontal direction signal
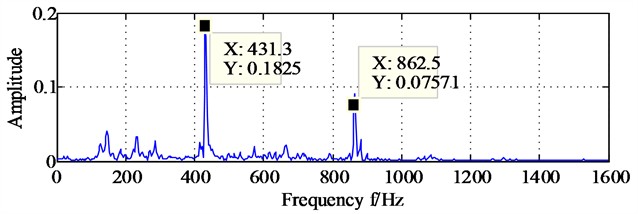
b) The diagonal slice spectrum analysis of vertical direction signal
The above experimental results further demonstrate the problems existing in traditional bispectrum analysis based on single channel information: Although the two channel signals are homologous collected on the same point with different directions, their respective bispectrum analysis results are not consistent and cannot fully express the nonlinear phase coupling information contained in the gearbox signal. If we only use the result of bispectrum analysis based on single channel as the basis for extracting fault features, different results may be obtained in different channels, which may affect the accuracy and reliability of fault diagnosis result in the next step.
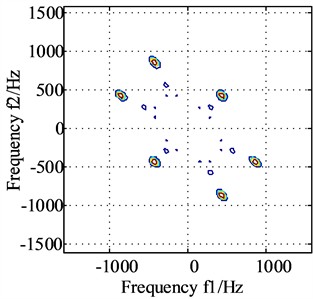
Fig. 10(a) and Fig. 10(b) are the bispectrum analysis results of horizontal direction signal and vertical direction signal after dual channel information fusion, based on which the peaks appear at frequencies (215, 215) and frequencies (430, 430) simultaneously, and the slight difference between Fig.10 (a) and Fig. 10(b) is only the energy intensity distribution. In order to express the result more intuitively, the diagonal slice spectrum analysis results of horizontal direction signal and vertical direction signal after dual channel information fusion are shown in Fig. 11(a) and Fig. 11(b) respectively, based on which the two main frequencies (215 Hz and 431 Hz) are expressed clearly, and the virtues of the proposed method are further verified.
Fig. 10The bispectrum analysis results of horizontal direction signal and vertical direction signal after dual channel information fusion
a) Bispectrum of horizontal direction signal after dual channel information fusion
b) Bispectrum of vertical direction signal after dual channel information fusion
Fig. 11The diagonal slice spectrum analysis results of horizontal direction signal and vertical direction signal after dual channel information fusion
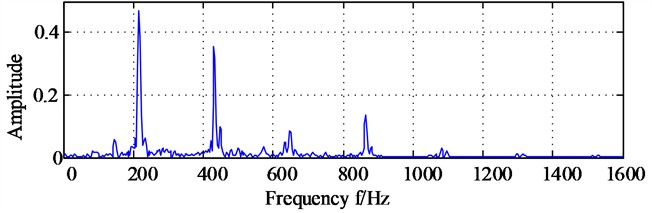
a) The diagonal slice spectrum analysis results of horizontal direction signal after dual channel information fusion
b) The diagonal slice spectrum analysis results of vertical direction signal after dual channel information fusion
5. Conclusions
The article proposes a new bispectrum analysis method based on dual channel homologous information fusion, which is based on the idea of full vector spectrum. The traditional single channel based bispectrum method usually has the problem of phase coupling phenomenon while analyzing complex signals in two different acquisition directions at the same measurement point, and this phenomenon not only can be manifested in the bispectrum time-frequency diagram, but also could be revealed much more effectively by diagonal slice spectrum analysis method. The proposed method could overcome the above problem effectively, and the following conclusions could be drawn from the analysis results of simulation and experiment:
1) The proposed method achieves almost identical feature extraction results when analyzing the phase coupling phenomenon of complex signals in two different acquisition directions at the same measurement point after fusing the same source information. This effect can be effectively verified on both the bispectrum analysis results and the diagonal slice spectrum analysis results after dual channel information fusion.
2) The proposed method could extract the frequencies features of the components participating in secondary phase coupling, and the corresponding extraction accuracy could reach 100 % in simulation verification. In experiment verification, the extraction accuracy will be decreased slightly due to the interference of background noise.
This article currently studies the bispectrum analysis method based on the full vector spectrum, and plans to investigate the bispectrum analysis method based on two other homologous information fusion methods (holographic spectrum and full spectrum), as well as other time-frequency analysis methods based on the full vector spectrum. It is expected to further improve the research level in data channel level information fusion.
References
-
Q. Li, Y. Tang, and L. Chu, “Generative adversarial networks for prognostic and health management of industrial systems: A review,” Expert Systems with Applications, Vol. 253, p. 124341, Nov. 2024, https://doi.org/10.1016/j.eswa.2024.124341
-
M. Yu, M. Fang, X. Ge, and B. Qiao, “Feature extraction of mixed faults of intershaft bearing based on homologous information and Hjorth parameters,” Measurement, Vol. 196, p. 111253, Jun. 2022, https://doi.org/10.1016/j.measurement.2022.111253
-
X. Duan, L. Xue, C. Lei, and J. Li, “Rolling bearing fault diagnosis method based on multi-information fusion characteristics under complex working conditions,” Applied Acoustics, Vol. 214, p. 109685, Nov. 2023, https://doi.org/10.1016/j.apacoust.2023.109685
-
C. Li, R.-V. Sanchez, G. Zurita, M. Cerrada, D. Cabrera, and R. E. Vásquez, “Multimodal deep support vector classification with homologous features and its application to gearbox fault diagnosis,” Neurocomputing, Vol. 168, pp. 119–127, Nov. 2015, https://doi.org/10.1016/j.neucom.2015.06.008
-
T. Zhang, F. Xu, and M. Jia, “A centrifugal fan blade damage identification method based on the multi-level fusion of vibro-acoustic signals and CNN,” Measurement, Vol. 199, p. 111475, Aug. 2022, https://doi.org/10.1016/j.measurement.2022.111475
-
S. Wang, Q. Zhao, Y. Han, and J. Wang, “Root cause diagnosis for process faults based on multisensor time-series causality discovery,” Journal of Process Control, Vol. 122, pp. 27–40, Feb. 2023, https://doi.org/10.1016/j.jprocont.2022.12.006
-
N. Xiong and P. Svensson, “Multi-sensor management for information fusion: issues and approaches,” Information Fusion, Vol. 3, No. 2, pp. 163–186, Jun. 2002, https://doi.org/10.1016/s1566-2535(02)00055-6
-
J. Gu et al., “Holospectrum analysis for bearing cage behaviour,” Journal of Vibroengineering, Vol. 17, No. 5, pp. 2291–2301, 2015.
-
R. Jia, F. Ma, H. Wu, X. Luo, and X. Ma, “Coupling fault feature extraction method based on bivariate empirical mode decomposition and full spectrum for rotating machinery,” Mathematical Problems in Engineering, Vol. 2018, pp. 1–10, Jan. 2018, https://doi.org/10.1155/2018/4598706
-
X. Gong, L. Ding, and W. Du, “Application of the full vector spectrum to local rub-impact fault diagnosis in rotor systems,” Journal of Residuals Science and Technology, Vol. 13, No. 8, pp. 3211–3215, 2016.
-
H. Yu, H. Li, Y. Li, and Y. Li, “A novel improved full vector spectrum algorithm and its application in multi-sensor data fusion for hydraulic pumps,” Measurement, Vol. 133, pp. 145–161, Feb. 2019, https://doi.org/10.1016/j.measurement.2018.10.011
-
X. Zhang, W. Sun, and G. Wen, “Lcd denoise and full vector mutual information in application of gear fault diagnosis under different working conditions,” Acta Energiae Solaries Sinica, Vol. 38, No. 9, pp. 2582–2588, May 2017.
-
C. Huang, “Full vector envelope technique based on complex local mean decomposition and its application in fault feature extraction for rotor system,” Journal of Mechanical Engineering, Vol. 52, No. 7, p. 69, Jan. 2016, https://doi.org/10.3901/jme.2016.07.069
-
X. Jiang, L. Wu, and M. Ge, “A novel faults diagnosis method for rolling element bearings based on EWT and ambiguity correlation classifiers,” Entropy, Vol. 19, No. 5, p. 231, May 2017, https://doi.org/10.3390/e19050231
-
Y. Wang, H. Li, and P. Ye, “Fault feature extraction of hydraulic pump based on CNC de-noising and HHT,” Journal of Failure Analysis and Prevention, Vol. 15, No. 1, pp. 139–151, Nov. 2014, https://doi.org/10.1007/s11668-014-9903-6
-
G. J. Shen, M. Stephen, Y. C. Xu, and P. White, “Theoretical and experimental analysis of bispectrum of vibration signals for fault diagnosis of gears,” Mechanical Systems and Signal Processing, Vol. 43, No. 1-2, pp. 76–89, Feb. 2014, https://doi.org/10.1016/j.ymssp.2013.08.023
-
F. Gu, T. Wang, A. Alwodai, X. Tian, Y. Shao, and A. D. Ball, “A new method of accurate broken rotor bar diagnosis based on modulation signal bispectrum analysis of motor current signals,” Mechanical Systems and Signal Processing, Vol. 50-51, pp. 400–413, Jan. 2015, https://doi.org/10.1016/j.ymssp.2014.05.017
-
G. Dong, J. Chen, and F. Zhao, “A frequency-shifted bispectrum for rolling element bearing diagnosis,” Journal of Sound and Vibration, Vol. 339, pp. 396–418, Mar. 2015, https://doi.org/10.1016/j.jsv.2014.11.015
-
X. Zou, H. Zhang, Z. Jiang, K. Zhang, and Y. Xu, “Toward accurate extraction of bearing fault modulation characteristics with novel time-frequency modulation bispectrum and modulation Gini index analysis,” Mechanical Systems and Signal Processing, Vol. 219, p. 111629, Oct. 2024, https://doi.org/10.1016/j.ymssp.2024.111629
-
D. Yang, K. Wang, J. Zhang, Y. Yuan, Y. Liu, and F. T. K. Au, “Micro-crack localization for steel strands using nonlinear vibro-acoustic modulation based on modified signal bispectrum analysis,” Measurement, Vol. 233, p. 114746, Jun. 2024, https://doi.org/10.1016/j.measurement.2024.114746
-
C. Grover and N. Turk, “A novel fault diagnostic system for rolling element bearings using deep transfer learning on bispectrum contour maps,” Engineering Science and Technology, an International Journal, Vol. 31, p. 101049, Jul. 2022, https://doi.org/10.1016/j.jestch.2021.08.006
-
Y. Mao, M. Jia, and X. Yan, “A new bearing weak fault diagnosis method based on improved singular spectrum decomposition and frequency-weighted energy slice bispectrum,” Measurement, Vol. 166, p. 108235, Dec. 2020, https://doi.org/10.1016/j.measurement.2020.108235
About this article

The authors have not disclosed any funding.
The datasets generated during and/or analyzed during the current study are available from the corresponding author on reasonable request.
B. C. Chen: partial program implementation, write the paper thoroughly. H. C. Wang: overall concept of the paper, principle guidance.
The authors declare that they have no conflict of interest.
