Abstract
Wind power towers located in the intertidal zone are not only influenced by wind load but also affected by the rising and falling of the tides. Little research examining the dynamic characteristics of wind power towers under multi-factor coupling loads has been conducted. Based on the finite element method and field testing, dynamic characteristics of the wind towers under complex loads were studied. Change laws of natural frequencies of wind power towers under different water levels were analyzed, and change laws of acceleration, displacement, strain and failure characteristics of a wind power tower under the coupling load of wind and tide levels were analyzed. The wind tower blade in expansion and deformation characteristics of two types of feathering were analyzed. The results showed that the influence of water levels on the low order natural frequency of a wind power tower structure was slight, but the influence on the high order frequency was higher. The maximum displacement of a wind power tower structure under a fluctuating wind load increased with increasing height. In extreme cases, a wind power tower will appear to have buckling instability destruction when the blades are in a state of suitable slurry. The top displacement of a wind power tower was less than a state displacement. Field monitoring results validate the correctness of the numerical simulation analysis.
1. Introduction
Wind load is the main load for the wind power tower structure, and it changes with increasing time. The marine environment is more complex, and the stress of the wind power tower under wind load and other loads may be more complicated [1-3]. In the vast intertidal area in China, for example, the resources for the construction of offshore wind farms is more abundant than the offshore deep water area. More and more wind power towers are constructed in the intertidal zone. However, wind power towers in the intertidal zone are affected by the rising and falling of the tides. In addition, for the process of engineering construction, foundation construction, transportation, and equipment shift, there exists no successful experience in the world to reference. New requirements for vibration situation of wind power tower are put forward. Especially during the normal operation of a wind power tower, tower stress is very complex. The wind power tower is affected by wind turbines, the engine room, and its weight function as well as the external load, including wind load, wave, tidal and scouring effects [4-6]. Therefore, to ensure the security and stability of wind power tower structures at normal operation and to develop wind power towers under the complex environment of dynamic characteristics analysis and field monitoring, the dynamic characteristics of wind towers under complicated loads are of great significance.
Offshore wind technology is far more complicated than wind power on land. In the process of designing and manufacturing offshore wind turbines, the wind resource’s features, as well as current, wave, tidal and seabed conditions, must be considered. Such factors as the joint scouring role and stress distribution are more complicated. In China, the generation technology of wind power towers is still in its infancy. Research on key technologies, especially support structure design, cannot meet the needs of wind power technology’s rapid development due to the complicated loading conditions combined with the structural form and the basic conditions. Thus, it is necessary to conduct further research work. In the research of wind tower support structure design, the wind loads and dynamics research of the theoretical calculation formula for the tower drum is too simple, and the standard involved in the calculation method of the horizontal and vertical ground motion is not complete. The related research on the influence of the dynamic characteristics on the wind power tower aspects is carried out at home and abroad. N. Bazeos et al. [7] (2002) consider the wind load as a static load: the wind – earthquake characteristics of the wind tower are studied. However, the wind load is a random vibration load, which is simplified as a static load: this approximation cannot be considered to set the ripple effect of the wind load. Lymon et al. [8] (2008) and Pekka [9] (2008) have analyzed the wind tower design method of pile foundation, but they have not analyzed the effect of the wind power tower pile foundation on the dynamic characteristics of power tower. Zhou Bo et al. [10] (2004) studied the dynamic characteristics of the wind tower based on the finite element method (fem). The wind loads are calculated by wind machine cones on the natural frequencies of the tower and the probability of resonance analysis of the tower. However, only the natural vibration characteristics of the wind power tower and modes was analyzed; a dynamic response analysis of wind power tower was not conducted. Xu Heyong et al. [11] (2004) have made a series of wind tunnel experiments on wind turbines, but their research only remained in the laboratory stage. They did not validate the experiments through field monitoring. In terms of the dynamic response of a wind power tower, F. Papp [12] simplified the wind tower as a post and beam structure and set up a simple method for analysis on the dynamic characteristics of wind power tower, which reduced calculation time. Li et al. [13] have analyzed the dynamic characteristics of the support structure system for wind power tower. Liu Xianshan et al. [14] (2016) studied the influence laws of topography on the wind power tower, and the results indicated that the mean square root of the displacement and acceleration has not varied very obviously. Liu Xiang et al. [15] (2015) studied wind vibration response and wind vibration coefficient of the tower under dynamic wind, and the results show that fluctuating wind load had a significant effect on the tower, which should be paid great attention to the process of design. Dai Kaoshan et al. [16] (2015) studied the structural responses of wind turbine tower under different loading scenarios, and the results show that time domain analysis on the wind turbine tower should be made while the frequency domain analysis based on the specification is unsafe for the large proportion of the cabin and leaf quality to the wind power tower. Chen Yang et al. [17] (2015) studied the effect of soil mass on the interaction of wind power tower, and the results show that the soil effect enlarged the numerical value of earthquake acceleration and reduce the damage to the structure stress. In the above references, the influence laws of wind load, tidal water, foundation style, boundary condition and analysis method on wind power tower are studied, however, the factors are researched separately, and coupling effect of the factors are not considered. Especially the wind power tower model was simplified, and the cabin and leaf are not considered. In addition, the current studies on offshore wind tower mostly focused on single factors and ignored the offshore wind tower complex environment, such as the tides, scouring and impeller rotation factors, and the dynamic response of offshore wind tower. The research at home and abroad focused on theoretical analysis and numerical simulation. The variability of wind speed had a great influence on the performance of wind turbine tower drums. Wind turbines generate incentive frequency change with wind speed, and their monitoring technology demand is higher. However, the monitoring of offshore wind tower occurs less frequently at home and abroad.
In addition, wind power tower blade rotation situation has a significant influence on the dynamic response of a wind power tower [18-20]. A wind turbine tower should inherit the gravity load on the wind turbines and engine room, and its own gravity load and the wind load on the wind turbines also needs to bear the dynamic load of rotor rotation. In the process of wind turbine work, wind turbines and tower coupling vibration may occur. When analyzing the safety of towers, consideration of the incentive effect of wind turbines on the tower is necessary. For the wind machine to work properly, the rotor blades under the wind load around the rotating wheel hub center easily cause blade fatigue damage. Thus, in the design of the tower, blade rotation safety should be considered. Generally, the study of the dynamic characteristics of wind power towers mainly includes theory analysis, the finite element method and the field monitoring method [21, 22]. The finite element method and the field monitoring method are relatively common in their usage. The field monitoring method can comprehensively reflect the influence of the complex wind power tower environment and can consider the actual dynamic response of the tower to impeller rotation. In this paper, the finite element method and the field monitoring method have been combined to study the dynamic response of the tower and the impact of impeller rotation on the dynamic characteristics of the wind tower.
This paper combines practical engineering methods of the offshore wind tower structure model to set up the wind field model, the wave load model, the model of wind power towers, and the dynamic characteristics of wind power tower structures under the complex load. The dynamic characteristics test is studied based on field monitoring, which is significant in the optimization of offshore wind tower structure design, to provide a technical reference for vibration diagnosis.
2. Numerical analysis of wind power tower under the wind load
2.1. The finite element model of wind power tower
The distribution of wind direction of the site is scattered, and the leading direction of the wind is SE. The highest tide level of the site is 8.42 m, and the lowest low water level is 0.21 m. The average tidal ranges up to 4.61 m. Due to the influence of sandbars and wide range shoal, small waves have the advantage, and the height of the effective wave is less than 0.3 m, and the average period is 4.0-4.9 s.
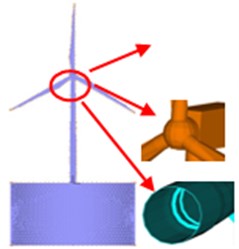
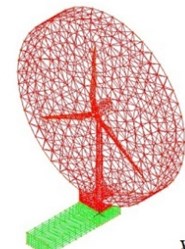
Based on the large finite element software Adina, a refinement model of wind power towers was established by considering a pile-tower drum-engine-wind turbine as a research unit. The SHELL element is adopted to establish the flange of the pile foundation transition section, which is at the bottom of the tower drum. A three-dimensional solid model was used to establish the soil. Mohr-Coulomb constitutive relation is adopted to simulate the soil. A pile foundation is used as a three-dimensional shell element to simulate the setting contact element between pile and soil. The soil model for a cylindrical shape had a diameter of 50 m (10 times the diameter of the pile) and a soil thickness of 50 m. The soil boundary uses a viscoelastic artificial boundary: that is, an artificial boundary spring element and damper are set. An incompressible fluid is used to simulate the wind field model. Establishing a three-dimensional fluid model of wind power tower structure with applied inlet velocity boundary conditions, the simulation speed is in accordance with the measured wind speed. The size of the solid wall is set in the sides of the wind field conditions.
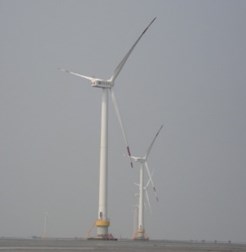
Fig. 1Overall model of offshore wind turbine system
a) Finite element model
b) Wind field

c) Side-view of wind field
d) Wind tower
The wind field fluid model is adopted to exert load to simulate the wave load speed, and the wave load is generated by the periodic compression wave plate flow descent. Wave plate and boundary conditions for the flow of the fluid-solid coupling conditions and other liquid-surface boundary conditions are set to limit speed conditions. Unsteady wind is adopted in the simulation. The wind field finite element model with 22935 set units is shown in Fig. 1.
SHELL element which is used in this paper is eight nodes element, and the calculated precision and effect is greater than other shell element. However, the result of eigenvalue buckling analysis is influenced by the grid mesh density of the shell. In order to determine reasonable mesh density, buckling eigenvalue under different grid mesh density is calculated, as shown in Fig. 2.
As shown in Fig. 2, the calculated precision of eigenvalue buckling of wind power tower increases with the ratio of the radius of the tower drum and the length of the unit increasing. When the ratio of the radius of the tower drum and the length of the unit is above 6.25, the calculated precision of buckling eigenvalue of wind power tower is within 15 %. And when the ratio of the radius of the tower drum and the length of the unit is above 18.75, the calculated precision of buckling eigenvalue of wind power tower can reach 95 %. Thus, the ratio of 25 is used in this paper, which meets the precision.
Model material parameters of the tower drum, flange and pile foundation adopt Q345 steel material properties parameters: the material yield strength is 345 MPa, the elastic modulus 2.06×10¹¹ Pa, and the Poisson’s ratio is 0.3. The density is 420.52 kg/m3. Material stress-strain relations are shown in Fig. 3.
Fig. 2Relation graph between the ratio of the radius of the tower drum and the length of the unit and the buckling eigenvalue
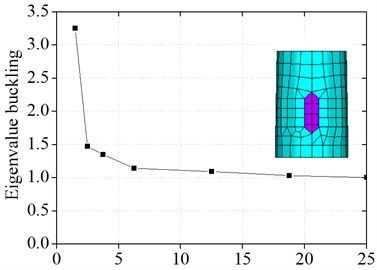
Fig. 3Bilinear curve model between stress and strain
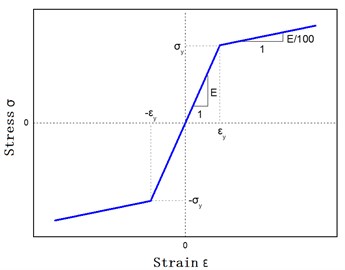
Table 1The physical and mechanical parameters of soil
Name of layer | Thickness / m | Cohesion / kPa | Internal friction angle / deg | Specific gravity of soil particle | Void ratio |
Silt | 6.5 | 3.8 | 32 | 2.69 | 0.713 |
Floury soil | 1 | 9.5 | 30.7 | 2.7 | 0.684 |
Layer of floury soil | 3 | 17.3 | 14.3 | 2.73 | 1.133 |
Layer of floury soil | 5.5 | 17 | 14 | 2.73 | 1.112 |
Layer of floury soil | 4 | 17.3 | 14.3 | 2.73 | 1.133 |
Silt | 5.5 | 3.7 | 32.6 | 2.69 | 0.752 |
Silty clay | 3 | 41 | 18.1 | 2.73 | 0.715 |
Thin layer of silty clay silt | 7.5 | 9 | 27 | 2.71 | 0.796 |
Silt | 5 | 5 | 32 | 2.69 | 0.616 |
Silty-fine and | 9 | 2.9 | 34.1 | 2.69 | 0.679 |
2.2. Modal analysis of wind power tower
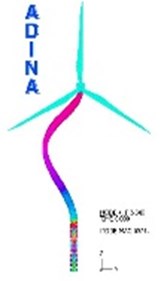
Before the dynamic analysis of the wind turbine tower drum, the modal analysis should be conducted first in order to determine the natural vibration characteristics of wind turbine tower, as shown in Fig. 4.
As shown in Fig. 4, a wind turbine tower drum structure of the first order mode has bending deformation about the direction, and the second order mode has bending deformation about the direction. The third order mode has bending deformation about the direction and torsion deformation about the axis. The fourth order mode has bending deformation about the direction and torsion deformation about the axis.
Fig. 4The modes of the wind power tower
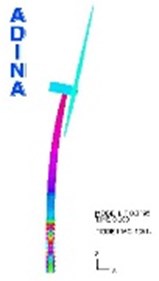
a) First-stage
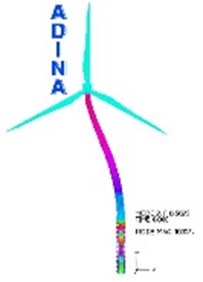
b) Second-stage
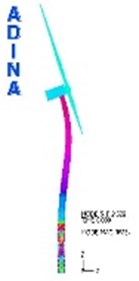
c) Third-stage
d) Fourth-stage
2.3. The influence of different water depths on the natural frequency of a wind power tower
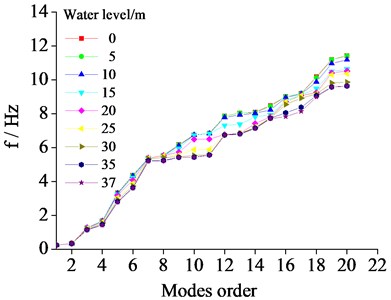
As the tide is changing, a wind power tower’s inherent frequency will change. The natural frequencies of the wind tower structure at different depths are calculated, as shown in Fig. 5.
As shown in Fig. 5, with the increase of water depth, wind power tower vibration frequency values decrease gradually, but the decline is not large. This shows that the influence of the water depth on the lower natural frequency of vibration is smaller, and the influence on the high order frequency is greater. Thus, it can be observed that the influence of different water depths on the wind power tower structure vibration frequency is limited. For high wind power tower structures that are thin-walled and “top-heavy”, the influence of the water depth on high-order vibrational frequencies should be considered in the general engineering design and vibration analysis.
Fig. 5Different water depths on natural frequency of wind tower
2.4. Dynamic response of wind tower under different wind speeds
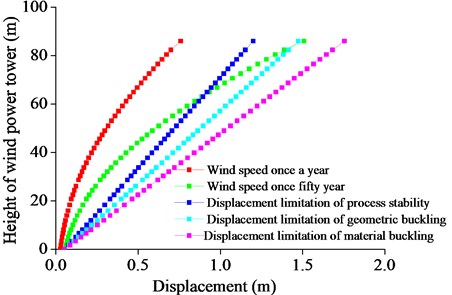
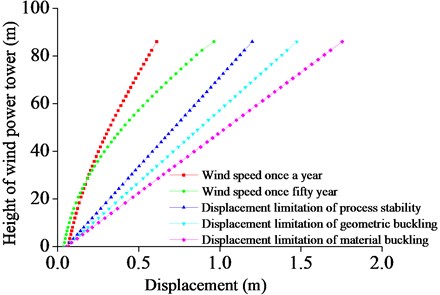
In order to study the dynamic characteristics of wind power towers under different wind speeds, wind vibration response of the wind turbine tower structure under the different wind speeds is analyzed. According to the requirements for the design of wind turbines (JB/T 10300-2001), wind turbines should be designed in accordance with wind speed that occur once every 50 years. For offshore wind towers, it is common for wind speeds to appear once every year. Thus, this paper selected wind speed once a year and once every 50 years to study the wind load, as shown in Fig. 6.
Fig. 6The maximum displacement with respect to the tower height under different wind speeds
a) State of leaf expansion
b) Leaf blade along the plasma state
As shown in Fig. 6, the displacements of structure under wind speed once a year and 50 years with respect to the height of the tower drum have the same change trends. With increasing height, the displacement increased gradually. In the state of leaf expansion, displacement at the top of the tower drum under wind speed once every 50 years was 0.75 m higher than that under wind speed once a year. If the wind tower is under the action of the wind for a long time, the wind power tower will have buckling instability destruction. When the blade is in a state of suitable slurry, the displacement of the top of the wind power tower obviously decreases, reducing to 0.96 m, and the structure is in a safe and stable state. The displacement value (1.147 m) increases by 16 %, and the stress value is permitted within 37.72 %. Thus, the displacement is the main controlling factor for the wind power tower structure. Maintaining the suitable slurry could effectively prevent structure damage under extreme wind load.
Because the wind tower is in a safe condition under wind speed once every year, this article will focus on researching structure safety performance under wind speed once every 50 years in extreme wind load.
As shown in Fig. 7, the maximum stress change of the wind tower meets the 50 years extreme wind speed along the height of the tower drum. The position of the maximum stress was in the middle of the tower drum. Under the action of extreme wind speed per 50 years, the windward surface tension, lee side compression, and the leeward surface stress are greater. The maximum stress structure material yield value has not been achieved. The structure is at the elastic stage, but its geometrical structure stress cross the buckling stress value, leading to structure buckling failure.
Therefore, when the 50 years wind speed is reached, the tower has not reached the material buckling destruction. However, geometric buckling damage can occur, and the present damage location for the tower height of 5/15-6/15 location. Thus, the height should be considered as an important protective position under the wind load.
Fig. 7The maximum stress under extreme wind speed per 50 years
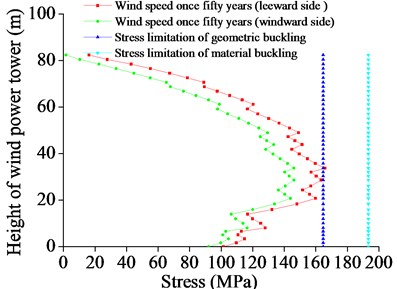
Fig. 8Arrangement of monitoring instrument of wind power tower
a) Field testing instrument and points
b) Geometric figure of the monitoring point arrangement
3. Field monitoring experiment
3.1. Layout of the supervision point
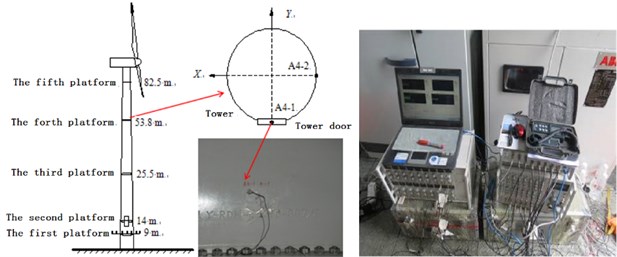
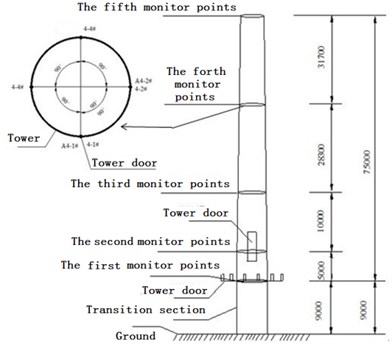
To obtain a more real wind vibration response of the tower, wind power field monitoring of the tower was carried out. Along the vertical length of the wind power tower, acceleration sensors and strain gauges were arranged. Different monitoring points could be divided into five groups according to the elevation of the monitoring. Monitoring points of the same elevation were placed into the same group: each group has four strain gauges. Monitoring stations and two acceleration sensors are shown in Fig. 8.
3.2. Testing the natural frequency of a wind power tower
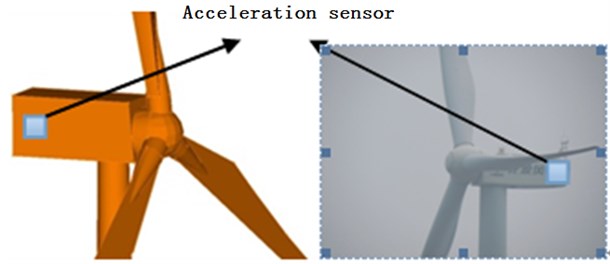
In order to test the natural frequencies of the wind power tower, the halt test method is used for the test. When the emergency brake is used in the normal operation of a wind power tower, it can be applied on the wind motor, which is equivalent to a pulse force. At the same time, the vibration signal of the wind turbine tower drum is collected. A total of two braking experiments were carried out. For both, the sampling time was every 10 min. Because the greatest vibration response takes place at the top of the engine room location, acceleration sensors were arranged on the engine room, as shown in Fig. 9.
Fig. 9Acceleration sensor located in the cabin
The comparison of the field monitoring of the natural frequency in the wind turbine tower drum and the results of numerical simulation are shown in Table 2.
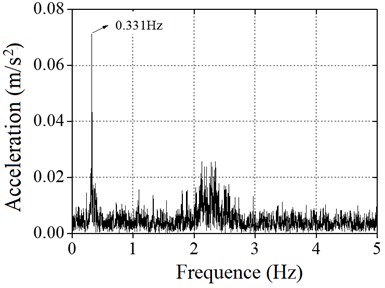
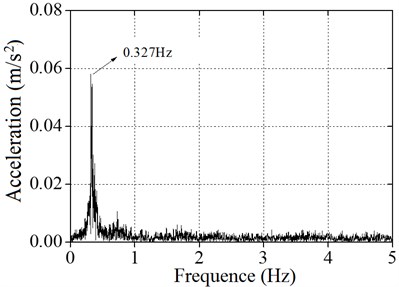
As shown in Table 2, the natural frequencies of the wind power tower calculated by the numerical simulation method were similar to the field monitoring measurement method, and the difference was within 5 %. The reason for the error is mainly the wire signal attenuation in the process of testing. The error of the overall fit is better. The vibration signals of the top of the wind tower were obtained through the field test for treating wind, and the spectrum is obtained by Fourier transform analysis, as shown in Fig. 10.
Table 2The contrast of numerical simulation and field monitoring
Model | Numerical simulation (Hz) | The first test | The second test | ||
Determination of frequency values (Hz) | Deviation ratio (%) | Determination of frequency values (Hz) | Deviation ratio (%) | ||
Wind tower | 0.320 | 0.331 | 3.32 | 0.327 | 2.14 |
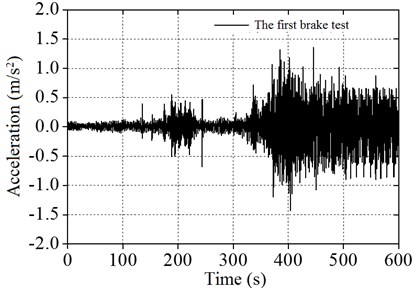
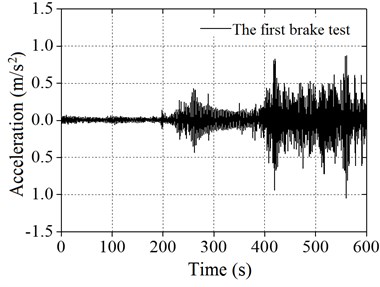
Fig. 10 shows the acceleration response of the wind power tower cabin measured through two brake tests. A Fourier transform was performed to obtain the values of the vibration signals. It can be concluded that the natural frequencies of the wind power tower are 0.331 Hz and 0.327 Hz. The errors of the two brake tests are within the 1.2 % range.
3.3. Acceleration response analysis of wind power tower
Scenes of the wind power tower at low and high tide during the acceleration and strain test are shown in Fig. 11.
Fig. 10Spectral analysis diagram of wind power tower: a) the first time of brake test, b) the second time of brake test
a1)
a2)
b1)
b2)
Fig. 11Low and high tide of the tower of wind power
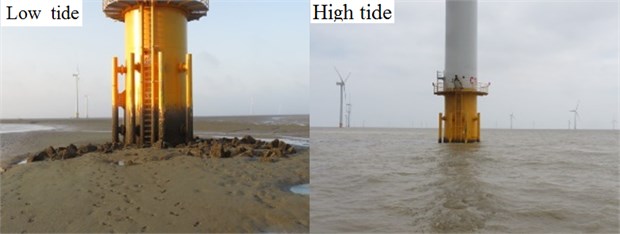
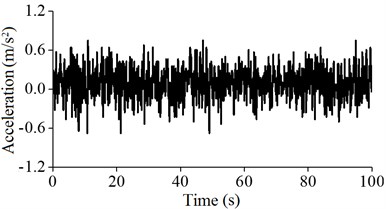
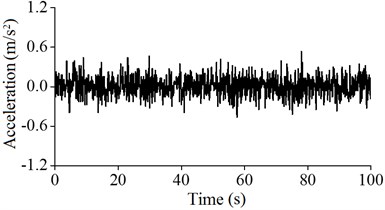
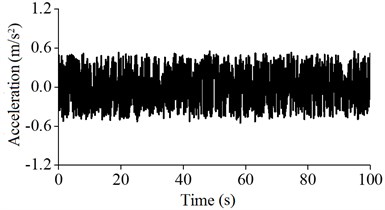
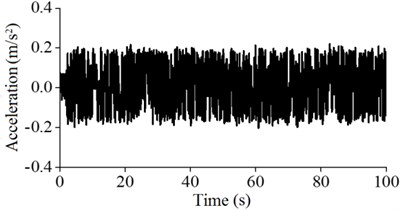
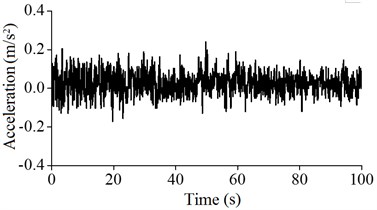
In this paper, according to the most unfavorable status of the wind power tower in the running state, the acceleration of the wind tower under the conditions of low and high tide was monitored. The acceleration signals of A5, A4, A3 and A2 of the monitoring values are as shown from Fig. 12 to Fig. 15.
As shown in these figures, after considering the influence of the tide level, the maximum acceleration values at the different heights of the wind power tower are greater than those that do not consider the tide, and the monitoring vibration intensity of the wind power tower after considering the influence of tide at different locations decreases. The results show that after considering the influence of waves and tide, the dynamic response increased, leading to harmful impacts on the wind power tower.
Fig. 12Acceleration vibration signals of A5
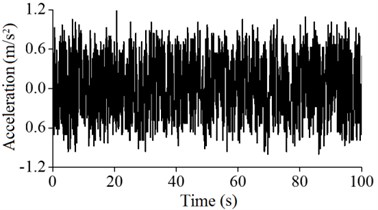
a) Low tide
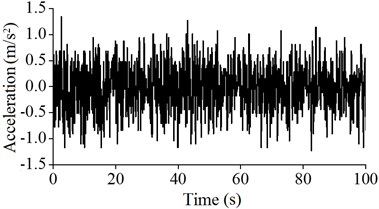
b) High tide
Fig. 13Acceleration vibration signals of A4
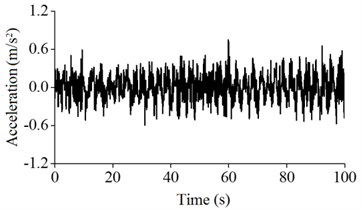
a) Low tide
b) High tide
Fig. 14Acceleration vibration signals of A3
a) Low tide
b) High tide
Fig. 15Acceleration vibration signals of A2
a) Low tide
b) High tide
3.4. Strain test of wind power tower
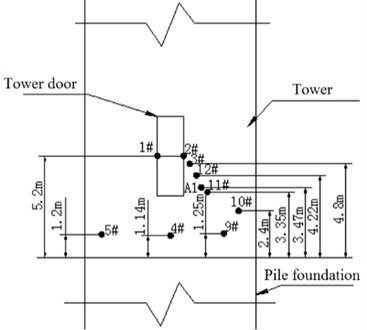
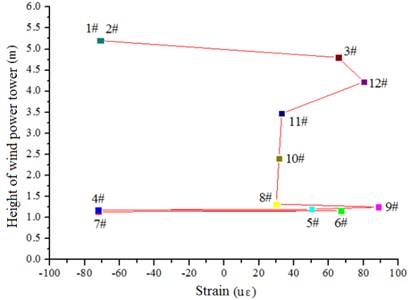
Because the maximum strain easily occurs at the openings and the bottom of the wind power tower, more strain gauges were placed in the openings to monitor the strain of the wind tower under the wind load. The strain data of the wind power tower for wind speed in the range from 7-8 m/s are shown in Fig. 16.
Fig. 16Stress of wind power tower
a) Monitoring location
b) Monitoring value
Through the monitoring analysis on the structural strain of the wind tower, the maximum strain of the wind power tower was shown to be 92 με when the wind speed is 7.4 m/s (see Fig. 16). The maximum strain was produced near the openings of the wind tower. It is concluded that the wind power tower opening easily produces the stress concentration phenomenon, causing a larger strain value. Therefore, more attention should be paid to the opening position of the wind tower under the wind load in the engineering design.
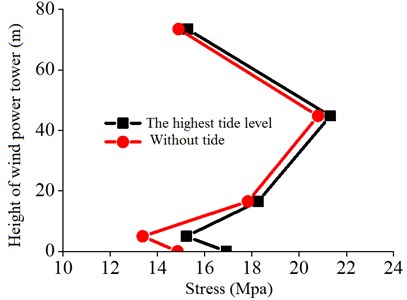
In addition, in order to obtain the changing laws of strain along the wind tower height, the testing was conducted with and without the tide, as shown in Fig. 17.
Fig. 16 shows that the structure stress of the wind power tower first increases and then decreases along the elevation of the wind tower, which is mainly composed of a tower drum structure of variable wall thickness and diameter. The wind turbine tower drum diameter and wall thickness decreases along the length of the wind tower, which leads to stress changes that follow the trend of first increasing and then decreasing.
Fig. 17Comparison of stress of the tower of wind power under low and high tide
4. Comparison and analysis of field monitoring and numerical simulation
This paper has chosen strain measuring points and the accelerations of the main vibration direction as the monitoring data. The comparison between monitoring data from the wind power tower drum structure in stop state without the tide and numerical simulation results were analyzed. The acceleration results are shown in Table 3, and the strain results are shown in Table 4.
Table 3 and Table 4 show that the errors between the value of monitoring and the value of numerical simulation results are mostly within 15 %, but the greatest deviation is within 25 %. The main reason is that the numerical simulation cannot simulate the internal equipment cable of the tower drum. In addition, there are sensor resolution limits. The smaller the acceleration vibration signals are, the greater the error is. Calculation results and the actual monitoring results of the sampling position have a certain gap. The reasons are monitoring instrument measurement error and artificial operation error. Additionally, the wire is too long, and it can produce certain influences on the result. Thus, there will be a certain error.
Table 3Comparison of acceleration monitoring data and the numerical simulation
Testing points | Monitoring of the acceleration (m/s2) | Simulation of the acceleration (m/s2) | Deviation ratio (%) |
A5-1 | 4.2×10⁻¹ | 5.2×10⁻¹ | 19.23 |
A5-2 | 2.4×10⁻² | 2.8×10⁻² | 14.29 |
A4-1 | 2.9×10⁻¹ | 3.7×10⁻¹ | 21.62 |
A4-2 | 1.9×10⁻² | 2.2×10⁻² | 13.63 |
A3-1 | 1.9×10⁻¹ | 2.2×10⁻¹ | 13.64 |
A3-2 | 1.2×10⁻² | 1.5×10⁻² | 20.00 |
A2-1 | 0.9×10⁻¹ | 1.2×10⁻¹ | 25.00 |
A2-2 | 0.7×10⁻² | 0.9×10⁻² | 22.22 |
A1-1 | 0.45×10⁻¹ | 0.55×10⁻¹ | 18.18 |
A1-2 | 0.5×10⁻² | 0.6×10⁻² | 16.67 |
Table 4Comparison of acceleration monitoring data and the numerical simulation
Testing points | Monitoring of the strain (µE) | Simulation of the strain (µE) | Deviation ratio (%) |
5-1 | 45.9 | 37.2 | 18.95 |
5-2 | 12.5 | 11.0 | 12.00 |
5-3 | –4.43 | –3.96 | 10.61 |
5-4 | 24.3 | 23.1 | 4.94 |
4-1 | 26.1 | 29.3 | 10.92 |
4-2 | 19.4 | 18.2 | 6.19 |
4-3 | 8.6 | 7.47 | 13.14 |
4-4 | 29.1 | 25.6 | 12.03 |
3-1 | 17.3 | 19.1 | 9.42 |
3-2 | 17.7 | 15.4 | 13.00 |
3-3 | 13.2 | 11.4 | 13.64 |
3-4 | 20.4 | 18.5 | 9.31 |
2-1 | 10.2 | 11.8 | 13.56 |
2-2 | 15.6 | 13.8 | 11.54 |
2-3 | 15.3 | 13.8 | 9.80 |
2-4 | 15.9 | 13.9 | 12.28 |
1-1 | 6.84 | 7.68 | 17.45 |
1-2 | 8.4 | 7.7 | 8.33 |
1-3 | 12.3 | 11.0 | 10.57 |
1-4 | 10.8 | 10.2 | 5.56 |
Above all, 15 % deviation in engineering design for engineering applications is allowed, and the deviation further verified the accuracy of the numerical simulation in this paper. Therefore, the results of numerical simulation and field monitoring can be considered as two types of methods that complement each other in the design of wind power towers. Each can make up for the two methods in the design of the wind tower under the wind load.
5. Discussion and analysis
In order to judge the stability of the wind power tower system, it needs to be observed whether the system's inherent frequency and the frequency of the external excitation on the coupling and vibration are compatible. According to the requirements for design of wind turbines (JB/T 10300-2001) in 5.3.16.4.2 regulation: frequency of the wind power tower must be greater than 10 % of the frequency of the rotor whose order is one and less than 10 % frequency of the rotor whose order is three. Generally, for wind power tower groups, the key point to guarantee the stability of the wind tower is to avoid meeting the first order natural frequency of the system.
Wind turbines under the rated speed of excitation frequency are given by: , is the order number, is the rotor blade number, and is the rated speed of the wind turbines.
Field work speed of the wind tower wind turbines is 6 RPM-17 RPM, and the corresponding working frequency is 6/60 = 0.1 Hz. Thus, one time of the rotor rotation frequency is from 0.1 Hz to 0.28 Hz, and three times frequency is from 0.3 Hz to 0.85 Hz. According to the first-order natural frequency ( tower first-order) of the tower, it can be divided into three categories: rigid tower, tower, and super flexible tower. The first-order natural frequency of a rigid tower is greater than three times the wind turbine’s first-order natural frequency, and the first-order is greater than 3 ( tower of wind turbines first-order). Flexible towers meet the tower of first-order natural frequency between double rotor first-order natural frequency and three times the wind turbine’s first-order natural frequency, and the (3 wind turbine’s first-order first-order is considerably greater than the frequency of a wind turbine tower of first-order). Super flexible towers that meet towers of first-order natural frequency are less than one times the wind turbine’s first-order natural frequency. Namely, wind turbines first-order > tower first order. Wind turbines can be calculated by numerical modeling of the first-order natural frequency 0.320 for the flexible tower wind power tower.
The first order natural frequency of wind power tower group vibration is obtained, as shown in Fig. 18.
Fig. 18The vibration Campbell diagram of wind power tower group
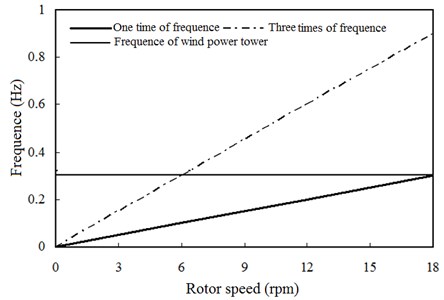
As shown in Fig. 18, the first order natural frequency is with no rotor rotating frequency of the 2 times frequency and 3 times frequency range overlap. Because the working speed is within the scope of [6.2 RPM, 6.5 RPM], the running time and the natural frequency of the tower system are in the process of the wind power tower group startup, which should be quick to control the wind power tower group in order to avoid long running time within this range.
The relationship between structure height and the attenuation coefficient is shown in Fig. 19.
As shown in Fig. 19, with increasing height, the attenuation coefficient for the same type of structure decreases.
Through numerical simulation analysis and field monitoring, the analysis of the monitoring data of the wind power tower and structural natural vibration characteristics can be concluded:
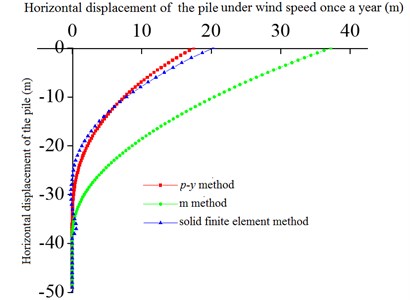
1) The soil geological conditions affect the vibration of the structure, and the soil constraint function is weak. The vibration of the structure is more significant, as shown in Fig. 20.
Fig. 19The relationship between structural height and the attenuation coefficient
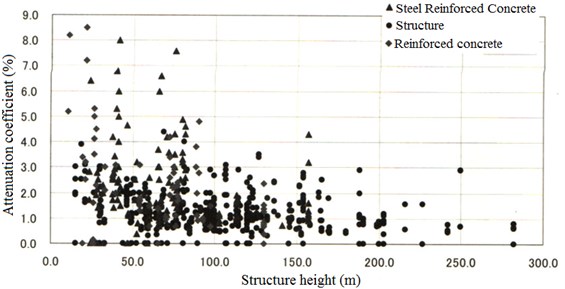
Fig. 20The soil displacement of pier foundation under different constraint method along with the height
2) The relationship between the natural frequency and rotor rotating frequency affect the strength of vibration. The wind power tower drum work condition value is close to the natural frequency of the rotor spinning double frequency, and the power generation process produces the tower drum and rotor blade resonance phenomenon (Fig. 18).
3) The higher the structure of the total height is, the more significant vibration is. The attenuation coefficient decreases with the increase of height, and the structure vibration attenuation degree decreases (Fig. 19).
According to related standards at home and abroad, combined with finite element analysis, the following measures to reduce the vibration of the structure should be taken:
1) Wind power tower in the wind turbines low speed range easily produces the resonance phenomenon (Fig. 18), and therefore, the rotor blade in the low speed range running time should be controlled.
2) The structure stiffness should be increased, finite element analysis of wind power tower structure should be used to study the stability, and measures should be taken to strengthen local stiffness through buckling characteristic research.
3) To increase structural damping, to absorb wind load or wave load of wind power tower vibration waves, and to reduce the vibration of the wind power tower, the concrete can be improved by engineering measures.
4) The upper soil layer should be strengthened for its constraint function, and the foundation stiffness should be increased. In turn, the overall stiffness of the structure will be increased.
6. Conclusions
1) With increasing of water depth, wind power tower vibration frequency values decrease gradually. The depth of the low order natural frequency of wind power tower has a smaller effect, but the influence of the high order frequency is great. The influence of high water depths on high-order vibration frequency of “top-heavy” and thin-walled structure should be considered.
2) With the increasing of the tower drum height, the displacement of the wind tower under the wind load increased gradually. The wind power tower will appear to have buckling instability destruction under the action of the wind speed for a long time. When the blade is in a state of suitable slurry, the displacement of the wind power tower decreases obviously, and the structure is in the safe and stable state. Thus, the displacement control is the main control factor, and the blades in a suitable slurry can effectively prevent destruction under extreme wind load.
3) The soil geological conditions affect the vibration of the structure, and the soil constraint function is weak. The upper soil layer should be strengthened for its constraint function, and the foundation stiffness should be increased. In turn, the overall stiffness of the structure will be increased.
4) The maximum values of stress of the wind power appear in the middle of the tower drum under wind speed once every 50 years, and the structure is in the elastic stage. The stress of the geometric structure meets the buckling stress value, causing the structure buckling failure. Accordingly, the turbine tower structure is incomplete under the action of the wind load once in 50 years. Buckling damage could occur, and the damage location is at elevations of approximately 30-36 m. Thus, it is necessary to take some reinforcement measures.
5) After considering the influence of tide levels, the maximum acceleration values of the different heights of wind power towers are greater than those not consider tide, and the monitoring vibration intensity of the wind power tower considering the influence of tide decreases. When considering the influence of waves and tide, its dynamic response increased, and it had a harmful impact on the wind power tower.
References
-
Kocer Fatma Y., Arora Jasbir S. Design of prestressed concrete transmission poles: optimization approach. Journal of Structural Engineering, Vol. 122, Issue 7, 1996, p. 804-814.
-
Kocer Fatma Y., Arora Jasbir S. Standardization of steel pole design using discrete optimization. Journal of Structural Engineering, Vol. 123, Issues 3-3, 1997, p. 345-349.
-
Kocer Fatma Y., Arora Jasbir S. Optimal design of latticed towers subjected to earthquake loading. Journal of Structural Engineering, Vol. 128, Issue 2, 2002, p. 197-204.
-
Lu X., McElroy M. B., Kiviluoma J. Global potential for wind-generated electricity. Proceedings of the National Academy of Sciences of the United States Vol. 106, Issue 27, 2009, p. 10933-10938.
-
Murtagh P. J., Basu B., Broderick B. M. Response of wind turbines including soil-structure interaction. Proceedings of the 10th International Conference on Civil, Structural and Environmental Engineering Computing, Vol. 270, 2005, p. 1-17.
-
Negm Hani M., Maalawi Karam Y. Structural design optimization of wind turbine towers. Computers and Structures, Vol. 74, Issue 2000, 1999, p. 649-666.
-
Bazeos N., Hatzigeorgiou G. D. Static seismic and stability analyses of a prototype wind turbine steel tower. Engineering Structures, Vol. 4, Issue 2002, 2002, p. 1015-1025.
-
Lymon Reesel C., Shin Tower Wang Design of foundations for a wind turbine employing modern principles. Research to Practice in Geotechnical Engineering Congress, 2008, p. 351-365.
-
Pekka Maunu Design of Wind Turbine Foundation Slabs. Alulae University of Technology, 2008, p. 128.
-
Zhou Bo, Fei Chaoyang, Chen Changzhen Study on vibration characteristics of the tower for wind turbine. Journal of Vibration Engineering, Vol. 17, 2004, p. 903-905.
-
Xu Heyong, Ye Zhengyin, Wang Gang, Shi Aiming Numerical simulation of rotor forward flight flow based on the unstructured dynamic patched grid. Acta Aerodynamica Sinica, Vol. 9, 2004, p. 311-318.
-
Papp F. An automatic procedure for computer aided design of steel beam-column. Journal of Constructional Steel Research, Vol. 46, 1998, p. 380-381.
-
Li L., Cao H. J. Research on wind-induced vibration control for large-span transmission tower with buckling-restrained braces. Water Resources and Power, Vol. 28, Issue 6, 2010, p. 121-149.
-
Liu Xianshan, Xiong Weihong, Xiao Zhengzhi Research on wind vibration response of 500Kv transmission towers in complex mountain area. Engineering Journal of Wuhan University, Vol. 49, Issue 5, 2016, p. 668-673.
-
Liu Xiang, Yin Yanjie Analysis and research of wind vibration response and wind vibration coefficient cone tower. Steel Construction, Vol. 30, Issue 6, 2015, p. 50-54.
-
Dai Kaoshan, Sheng Chao Wind turbine tower structural responses under typhoon loads. Structural Engineers, Vol. 31, Issue 6, 2015, p. 98-105.
-
Chen Yang, Zhang Fuzheng Research on dynamic characteristics of wind power tower under different boundary conditions. Special Structure, Vol. 32, Issue 5, 2015, p. 4-6.
-
Li J., Zhang Y. C. Finite element method of the elastic-plastic stability and hysteric property analysis of axially loaded steel components. Journal of Harbin University of Civil Engineering and Architecture, Vol. 32, Issue 3, 1999, p. 34-38.
-
Wang Z. The Practical Way of an Analysis of Stability Capacity of Steel Beam-Columns. Wuhan University of Technology, 2008.
-
Baumgart A. A mathematical model for wind turbine blades. Sound and Vibration, Vol. 251, 2002, p. 1-12.
-
Schafer W., Asce M. Local, distonional and Euler bucking of thin-walled columns. Journal of Structure Engineering, Vol. 128, 2002, p. 289-299.
-
Dubina Vungureallu D. Imperfections on numerical simulation of instability behavior of cold-fomed steel members. Thin-Walled Structure, Vol. 40, 2002, p. 239-262.
About this article
This work is financially supported by the Major Special Project Fund of Science and Technology in Guizhou Province [2015] 6003, the Science and Technology Plan Projects in Guizhou Province [2015] 4004, the Beijing talents Fund (2015000057592G270) and a research grant from Institute of Crustal Dynamics, China Earthquake Administration (No. ZDJ2016-12).
