Abstract
Compressed air energy storage stands as a highly promising technology within the realm of energy retention. The piston expander finds applicability in smaller-scale compressed air energy storage systems. In compressed air energy storage systems, the expansion process is critical in energy discharge and significantly impacts overall performance. Isothermal expansion techniques are effective in enhancing the operational efficiency of piston expanders, in contrast to adiabatic expansion methodologies. Previous simulations by our research group show that the isothermal expansion model has a lower power output than the adiabatic expansion model due to its higher exhaust pressure. To further validate the accuracy of the simulation results, an experimental platform was constructed and the uncertainty of the experimental system as well as the measured data was evaluated. This study conducted experimental research using the single-variable method, focusing on different load conditions and spray parameters. The study findings indicate that the exhaust pressure during isothermal expansion consistently exceeds that of adiabatic expansion. The exhaust pressure of isothermal expansion increased by 3.85 % to 14.9 %. Under varying load conditions, the average rotational speed and output power of isothermal expansion were noted to be inferior to those of adiabatic expansion. Despite changes in nozzle diameter or spray temperature when the spray timing is set at 0°-180°, the average rotational speed and output power of isothermal expansion remain lower than that of adiabatic expansion. The average output power of isothermal expansion decreased by 1.29 % to 5.24 %. Nevertheless, if the spray timing is set between 0°-120°, the average output power of the isothermal expansion surpasses the adiabatic expansion with an improvement of 1.84 %.
Highlights
- This is the first time in the research field that an isothermal expansion model has been applied to the entire working engineering of an single-cylinder two-stroke piston expander and examined its effect on the single-cylinder two-stroke piston expander's output power.
- A study was conducted using a single-variable approach to examine how nozzle diameter, spray timing and spray temperature impact single-cylinder two-stroke piston expander performance in an isothermal expansion model.
- To further validate the accuracy of the simulation results, an experimental platform was constructed and the uncertainty of the experimental system as well as the measured data was evaluated.
- The study shows that the isothermal expansion models can increase exhaust pressure. However, the power output of the single-cylinder two-stroke piston expander decreased by 2-3% when the spray timing was 0°-180°, regardless of changing the nozzle diameter or spray temperature.
1. Introduction
In the persistent promotion of the “double carbon” strategy, China's installed capacity for renewable energy has demonstrated substantial annual growth. According to the renewable energy installed capacity data released by the National Energy Administration (NEA) [1], the newly installed capacity in 2022 reached 1.52×10⁸ kW, constituting 76.2 % of the recently added power generation capacity. This has evolved into China's predominant component of newly installed power capacity.
The inherent intermittency and uncertainty of renewable energy pose challenges to grid-connected consumption, impeding the attainment of an economically balanced power supply and demand [2, 3]. Consequently, there arises a pressing necessity for one or more electric energy storage technologies to address the complexities inherent in the processes of renewable energy electricity production, storage, and consumption. In contrast to alternative energy storage technologies, compressed air energy storage (CAES) boasts distinct advantages encompassing an extended lifespan, environmentally benign characteristics, robust safety and reliability, and expansive application potential. The inaugural commercially operational CAES power plant, Huntorf in Germany, marked a pioneering achievement. Presently, the system achieves an output power of 321MW. An additional milestone in the realm of CAES is the inaugural megawatt-level isothermal system, realized by the American company SustainX, demonstrating a commendable operational longevity of up to two decades [4].
The compressor/expander is a pivotal element of the CAES system, and with the premise of dealing with the thermal aspects of compression/expansion [5], CAES technology is demarcated into diabatic CAES (D-CAES), adiabatic CAES (A-CAES without Thermal Energy Storage (TES), A-CAES with TES) and isothermal CAES (I-CAES). In the ideal I-CAES cycle, using the isothermal compress/expand process can reduce compressing power and increase expanding power compared to the adiabatic process [6, 7]. Attaining isothermal compression/expansion of gases through conventional mechanical apparatus has, until now, posed a formidable challenge [8]. The majority of mechanical devices find themselves situated between adiabatic compression/expansion and isothermal compression/expansion, occupying a realm often described as near-isothermal compression/expansion [9]. The primary obstacle in realizing near-isothermal compression/expansion lies in effectively facilitating swift heat transfer during air compression/expansion. Current technologies addressing rapid heat transfer predominantly involve liquid piston heat transfer [10] and water spray heat transfer.
The piston expander exhibits characteristics of low speed and high torque. Research indicates the piston expander's superior suitability for small CAES systems [11, 12]. Nevertheless, challenges arise from the inefficiency of the conventional adiabatic expansion model (AEM), leading to suboptimal expander efficiency and susceptibility to freezing and clogging at the exhaust port, hindering widespread application in CAES systems. Presently, there is a notable scholarly focus on enhancing expander output performance through the application of the aforementioned heat transfer technology.
In terms of heat transfer of liquid pistons, Andrew et al. [13] optimized the power and efficiency based on the air compression and expansion process of liquid piston, and obtained the optimal value of heat transfer coefficient and heat transfer area under the specified volume. Due to the limited heat transfer area of the liquid piston, many scholars have introduced porous media and water spray heat transfer into the liquid piston I-CAES system to increase the heat transfer area, so that compression/expansion is closer to the isothermal process. Jacob et al. [14] investigated experimentally the effect of the introduction of porous media on the efficiency and power density of a liquid piston gas compression/expansion machine under high-pressure conditions and showed that the efficiency reached 93 %. Under the same conditions, the compression and expansion working power densities were 10 and 20 times higher than the power density without the introduction of porous media, respectively. Chen et al. [15] achieved efficient continuous near-isothermal compression energy storage and expansion energy release of air by using two pressure vessels with liquid pistons and intensifying the isothermal compression/expansion process by spraying water mist into the two pressure vessels, and the indicated and round-trip efficiencies of the system were obtained as high as 98 % and 76 %, respectively, and the temperature rise during air compression and temperature drop during air expansion were within 5 °C. Zhao et al. [16] also make use of the similar pressure vessel mentioned above, but discard the gas storage device in the compressed air energy storage system. After one isothermal compression/expansion of each pressure vessel, the system completes one cycle, achieving a stable output power of the system. The research results show that the round-trip efficiency of the system is 61.42 %, and the energy density is 0.2015 kWh/m3. Although the liquid piston improves the efficiency of heat exchange in the expansion process, the gas brought into the hydraulic system will cause a reduction in the elastic modulus of the liquid, increased noise and vibration, increased wear, and cavitation in the low-pressure region, affecting its further application. The coupling of liquid pistons with various heat transfer methods leads to complex system structures and high production costs.
In terms of heat transfer of water spray, SustainX (USA) has compared experimental data of AEM and isothermal expansion model (IEM) in its 2015 technical report [17]. Under the same air quality, the gas temperature after expansion of without water mist gas is 175 °C lower than the initial ambient temperature, and the adiabatic efficiency is 54 %. The difference between the gas temperature after expansion with water mist and the initial ambient temperature is 15 °C, the isothermal efficiency is 95 %, and the output time of the same constant power is 65 % longer than the expansion time without water mist. The above experiment requires a slower expansion stroke. Zhang et al. [18] conducted an experimental test on a single-valve reciprocating expander and verified the correctness of the AEM. Then, the water mist-air heat transfer equation was introduced to achieve near-IEM of gas. The simulation results show that the temperature difference of near-IEM is only 10% of that of AEM, and the specific energy increases by 15.7 %. However, the near-isothermal model has not been verified by experiments. Braasch et al. [19] built an experimental device that could measure the parameters of the gas expansion process, and the experimental test showed that near-IEM of gas could be achieved by spraying water mist into the atmosphere with nitrogen or helium gas. The results show that the output work of the isothermal process can reach 94.2 %. Although Braasch al. proved the effectiveness of near-IEM of gas by using water mist heat transfer through experiments, they did not apply it to a real expander to analyze the whole process. Our research group [20] has simulated the single-cylinder two-stroke piston expander (SCTS-PE) based on spray heat transfer in the early stage and found that the injection of high-temperature water mist during the expansion of compressed air can effectively restrain the air temperature drop and increase the air pressure in the cylinder. As the heat transfer through water mist leads to the increase of gas pressure in the exhaust process, the output power and efficiency are reduced.
Based on the previous research conducted by our research group, this study aims to further validate the accuracy of the simulations by investigating the performance of a single-cylinder, SCTS-PE based on in-cylinder spray heat transfer through experimental research. The main focus is on studying the effects of three parameters: nozzle diameter, spray temperature, and spray timing on the expander. This is also the first time that IEM has been applied to the entire working process of a SCTS-PE.
The rest of this paper is organized as follows: Section 2 provides a detailed explanation of the working principles of the SCTS-PE and its ideal isothermal/adiabatic thermodynamic cycle. Section 3 describes in detail the experimental equipment and experimental procedures of the experimental bench, as well as the uncertainty assessment of the measured parameters. Section 4 is about the results and discussion of the experiment. Finally, Section 5 provides a summary of the experimental findings.
2. Description of the SCTS-PE and the ideal IEM/AEM thermodynamic cycle
2.1. Working principle of SCTS-PE
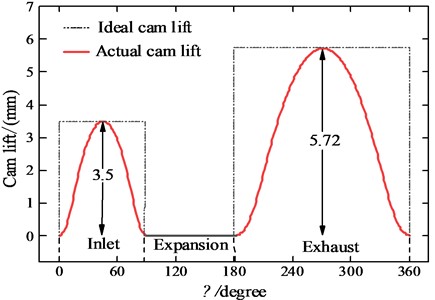
This study selected the third-generation SCTS-PE prototype developed by our research group and the prototype of this SCTS-PE and its section diagram of valve timing mechanism [21] are shown in Fig. 1. As with conventional internal combustion engines, a mechanically driven valve timing mechanism is used to control the gas flow during the intake and exhaust processes. The valve timing mechanism is composed of valve combination (valve, valve seat, valve guide, valve spring) and valve transmission group (camshaft, camshaft transmission mechanism). The working process of SCTS-PE can be divided into the intake process, expansion process, and exhaust process. The motion cycle is shown schematically in Fig. 2. The kinematic scheme and detailed mathematical modeling of this SCTS-PE have been published in the literature [20]. The cam lift curve of the valve timing mechanism should be rectangular in ideal condition, that is, the maximum lift can be reached when the valve is opened, and the maximum lift is always maintained within the intake duration angle, but it is closed immediately when it is closed so that the throttling loss of the expander will be reduced. The optimal maximum lift of intake and exhaust valves and the optimal gas distribution phase have been obtained in the simulation optimisation process [22]. In the actual operation of the piston expander, the time of a single gas distribution cycle will change depending on the rotational speed, but the gas distribution phase and the maximum lift of the valves will not change. Due to the good followability of the cam-based gas distribution system, we considered the cam lift during its operation to be the same as that obtained from the simulation optimisation. The intake and exhaust valve lift curves obtained from the simulation optimisation are shown in Fig. 3.
Fig. 1The prototype of SCTS-PE and its section diagram of the valve timing mechanism
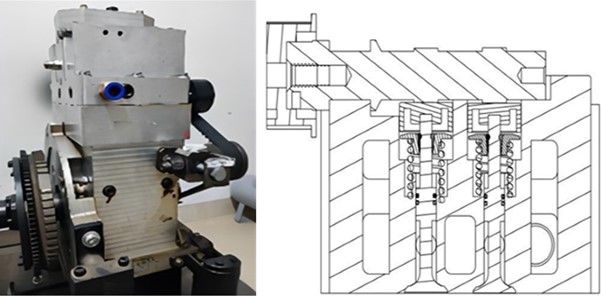
Fig. 2Schematic diagram of SCTS-PE work cycle
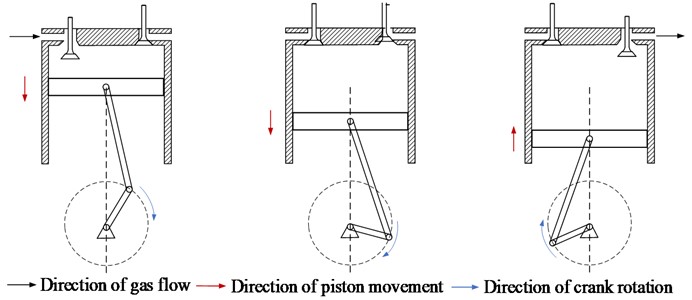
Fig. 3Lift curve of intake and exhaust valves
2.2. Thermodynamic cycle of IEM/AEM
When the valve structure is in the form of an ideal opening and closing (ideal CAM lift shown in Fig. 3), the thermodynamic cycle of the SCTS-PE is shown in Fig. 4. The ideal IEM/AEM thermodynamic cycle of the SCTS-PE consists of an equal mass isentropic/isothermal process: 3-4, 3-4′; two variable-mass isentropic processes: 1-2 and 4-5; and two variable-mass isobaric processes: 2-3 and 5-1.
Fig. 4The p-V diagram of ideal IEM/AEM
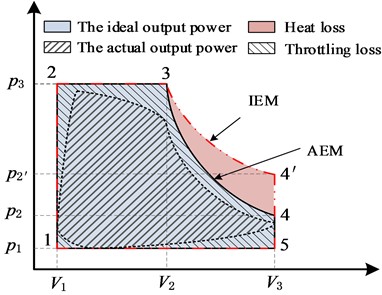
In stages 1-2, the intake valve is opened, compressed air enters the cylinder and quickly fills the cylinder clearance , making the gas pressure in the cylinder rise rapidly to . At this time, the piston is stationary at the top dead center (TDC) and the gas does not work on the piston. In the actual process (actual lift curve of intake and exhaust valves shown in Fig. 3), due to the intake valve not directly reaching the maximum lift, the pressure in the cylinder clearance should be lower than .
In stages 2-3, compressed air flows continuously into the cylinder to keep the pressure in the cylinder constant and the piston moves from TDC to bottom dead center (BDC). When the cylinder content volume changes from to , the intake valve closes quickly, and the external work done at this stage can be expressed by Eq. (1). Of course, in the actual process, certain throttle loss will be caused when the intake valve is opened and closed. The pressure in the cylinder at stages 2-3 is not constant and the pressure of the gas in the cylinder is less than :
In stages 3-4/ 3-4′, the intake valve and exhaust valve are closed, and the gas in the cylinder with a constant mass pushes the piston to do work. If the gas does not exchange heat with the outside world, it is an ideal AEM, such as stages 3-4 in the figure, whose external output work can be expressed by Eq. (2), where is the gas adiabatic index. If the temperature of the gas is constant in the expansion process, that is, IEM, the pressure of the gas in the cylinder will decrease at a slower rate and improve the mechanical work output. As shown in Fig. 4, stages 3-4′, the external output mechanical work of IEM can be expressed by Eq. (3). Ideal AEM results in heat loss compared to IEM. AEM results in an increase in the volume of the gas and a decrease in the pressure during expansion due to the lack of heat exchange with the outside world during expansion, which also results in a decrease in temperature. In IEM, the gas inside the cylinder can exchange heat and the temperature inside the cylinder remains constant. In realistic SCTS-PE in the gas expansion process, the gas is difficult to achieve absolute isothermal/adiabatic expansion, the pressure curve is lower than the IEM pressure curve is higher than the AEM pressure curve:
In stages 4-5/ 4-5′, when the piston reaches BDC and the exhaust valve opens, the fluid from the cylinder is discharged when the piston is fixed at BDC, resulting in a rapid drop in cylinder pressure and no work done by the gas on the piston. In the actual process, this stage is analogous to the 1-2 stage, the air pressure in the cylinder of this process is much larger than .
In stages 5-1, the compressed gas within the cylinder is discharged out of the cylinder, but at this time the gas temperature and pressure are reduced, and the energy contained in it is correspondingly reduced, the role of the outside world can be expressed in Eq. (4). Of course, in the actual process, when the exhaust valve is closed, certain throttling loss will be caused. The pressure in the cylinder at the 5-1 stage is also not a constant and the pressure of the gas in the cylinder is greater than , and the hindering force of the real gas on the piston is greater:
The AEM output work () and IEM output work () of SCTS-PE under one operating cycle can be expressed by the Eq. (5):
The above is the adiabatic/isothermal output work of the ideal valve lift. The area included in the - of the actual SCTS-PE is within the area included in the adiabatic/isothermal -, the actual output power is shown in Fig. 4.
3. Experiments
3.1. Description of the test bench
Fig. 5 shows the schematic diagram of the IEM system test platform, which is mainly composed of an air expansion system, a high-pressure water mist system, and a data acquisition system.
Air expansion system: The atmosphere is compressed, filtered, and separated by the air compressor and stored in the gas tank. The high-pressure air in the gas tank is decompressed by the manual pressure-reducing valve and then enters the SCTS-PE to push the piston to do work. During operation, the magnetic powder brake provides a stable load for the SCTS-PE.
Fig. 5The schematic diagram of the system test platform: 1 – constant temperature box; 2 – water mist generator; 3 – high-frequency solenoid valve; 4 – data processing computer; 5 – Data acquisition system; 6 – exhaust valve stem; 7 – high-pressure nozzle head; 8 – micro dynamic pressure transmitter; 9 – intake valve stem; 10 – manual pressure-reducing valve; 11 – air storage tank; 12 – air compressor; 13 – serial port converter; 14 – hall sensor; 15 – piston head; 16 – magnetic powder brake; 17 – coupling; 18 – torque sensor; 19 – coupling; 20 – signal flywheel; 21 – crankshaft; 22 – exhaust channel; 23 – nozzle channel; 24 – pressure sensor channel; 25 – intake channel, A-A cylinder head cross-sectional view
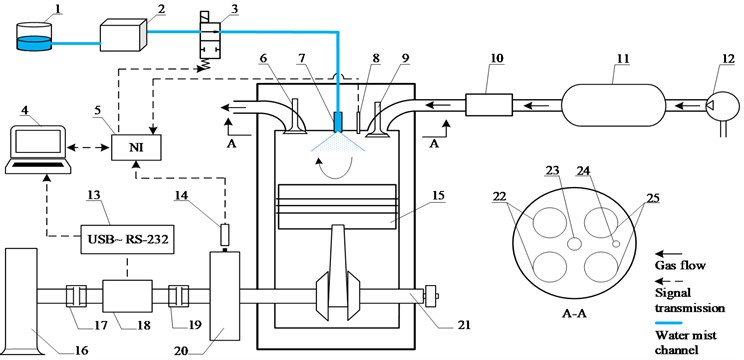
High-pressure water mist system: The opening and closing of the high-frequency ringing solenoid valve are controlled by the crankshaft phase angle signal collected by the Hall sensor. When the high-frequency solenoid valve is in the open state, the high-temperature water flow of the constant temperature tank is pressurized by the water mist generator and flows into the nozzle to atomize the water. The atomized water flow contacts with the gas in the cylinder for heat transfer.
Data acquisition system: The torque sensor mounted on the crankshaft collects the speed, torque, and power data during operation, and the data is collected on the computer through a serial converter. The miniature dynamic pressure transmitter is used to collect the air pressure in the cylinder and output the analog quantity to the NI data acquisition card. The data is displayed and stored in real time by LabVIEW.
Table 1Main components selection summary
Sensor and system components | Model number | Error range | manufacturer |
Manual pressure-reducing valve | IR3020-04 | 0.2 % F.S | SMS |
Magnetic powder brake | CZ-20 | ±0.5 N·m | Hangyu |
High-frequency solenoid valve | XYGY-5P-100G | 120 Hz | Shanghai Xinyi |
Water mist generator | PC-2801 | – | Suzhou Haijing |
Hall sensor | MBE10-G4S25-NO3X | 1...5% | Shengyixin |
Miniature dynamic pressure transmitter | AE-S-G-H3-NMGKJDX | ±0.5 % FS | Aierchuanggan |
Torque sensor | GB-DTS | < ±0.5 F.S% | SMC |
NI data acquisition card | NIUSB-6211 | — | Siemens |
Magnetic powder brake controller | WLK-3A | 0.5 % | Jiangsu Hangtian |
Torsion, speed, and power display instrument | GB-ZNM | ±0.1%FS | Beijing Gongbiao |
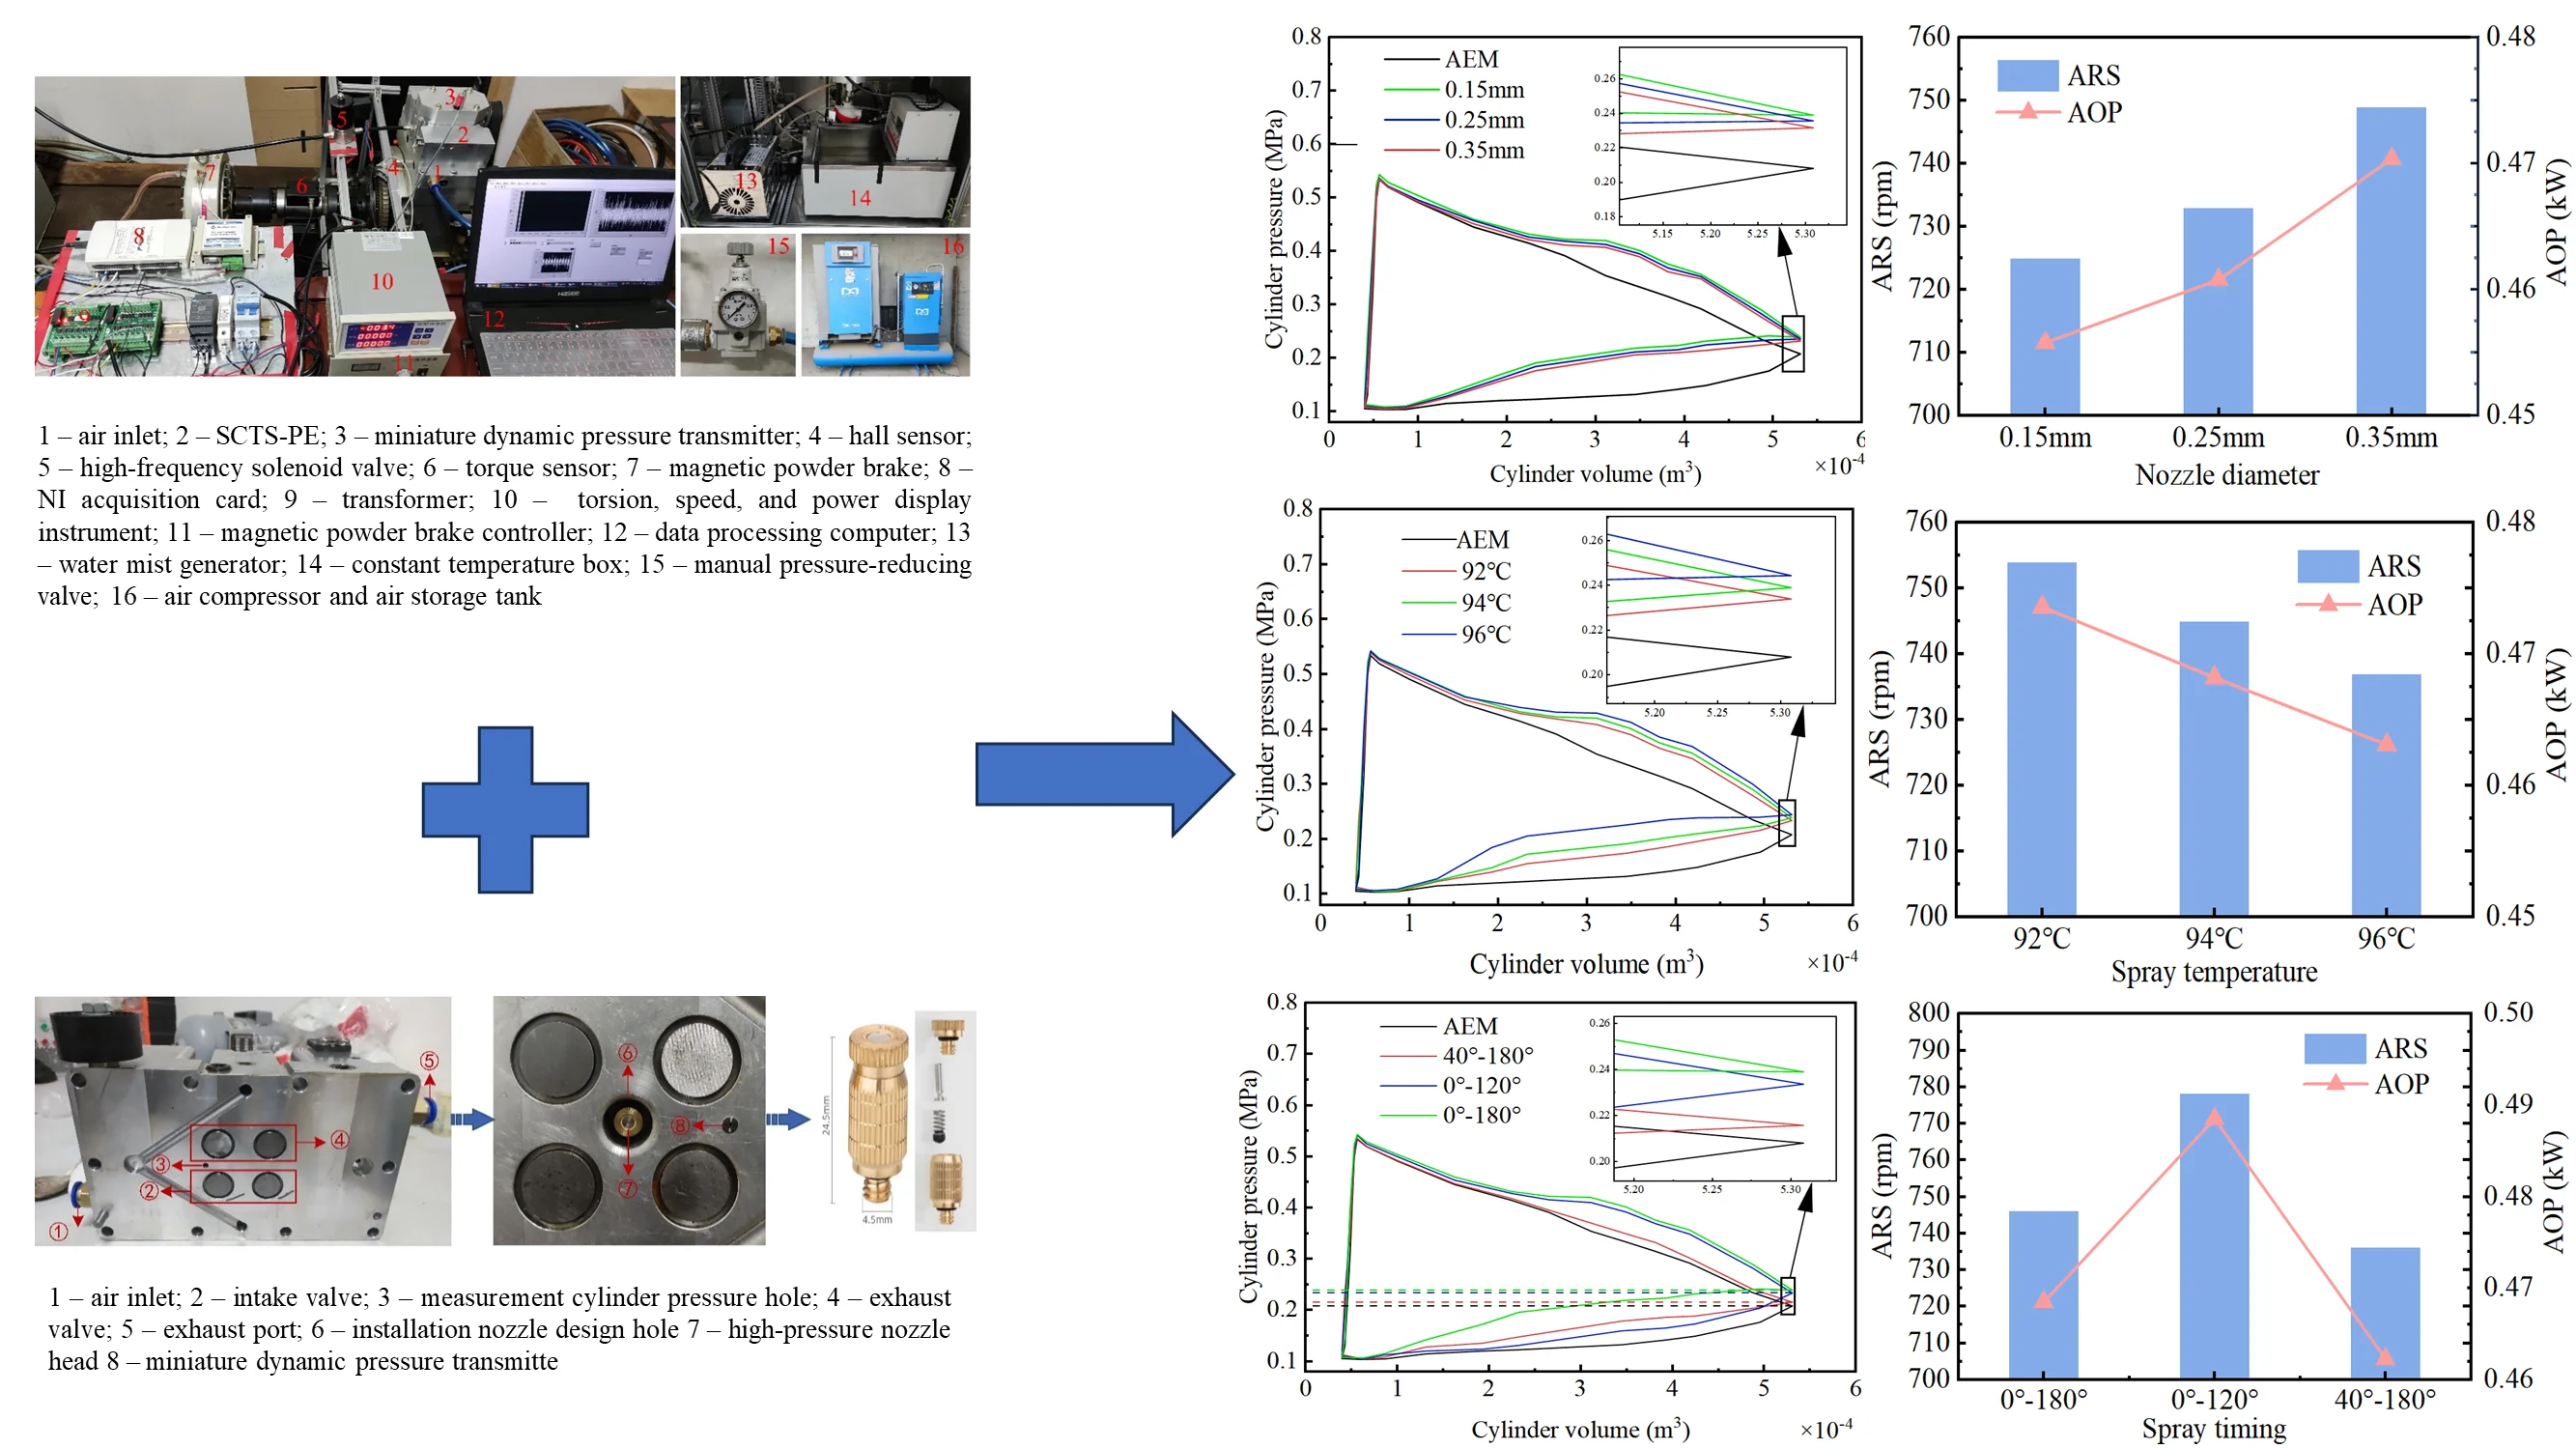
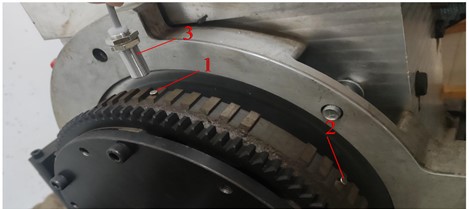
The test bench is shown in Fig. 6, and the selection of main components is summarized in Table 1. The cylinder diameter of the single-cylinder two-stroke PE is 0.085 m, the cylinder stroke is 0.088m, and the cylinder clearance is 3.97×10⁻⁵ m. The cylinder head of the expander is equipped with a nozzle head and a miniature dynamic pressure transmitter, and the cylinder head is shown in Fig. 7. The droplet diameter can be adjusted by changing different nozzle models. The micro-dynamic pressure transmitter can measure conventional gas/liquid to meet the needs of the working conditions.
Fig. 6Physical picture of the test system: 1 – air inlet; 2 – SCTS-PE; 3 – miniature dynamic pressure transmitter; 4 – hall sensor; 5 – high-frequency solenoid valve; 6 – torque sensor; 7 – magnetic powder brake; 8 – NI acquisition card; 9 – transformer; 10 – torsion, speed, and power display instrument; 11 – magnetic powder brake controller; 12 – data processing computer; 13 – water mist generator; 14 – constant temperature box; 15 – manual pressure-reducing valve; 16 – air compressor and air storage tank
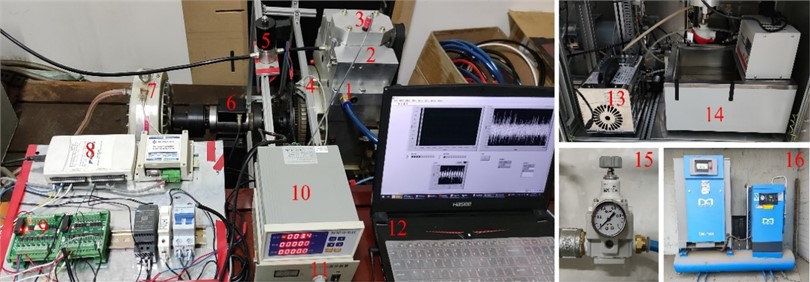
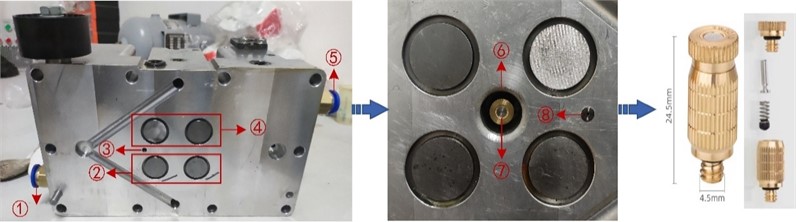
Fig. 7Installation design drawing of high-pressure nozzle head: 1 – air inlet; 2 – intake valve; 3 – measurement cylinder pressure hole; 4 – exhaust valve; 5 – exhaust port; 6 – installation nozzle design hole 7 – high-pressure nozzle head 8 – miniature dynamic pressure transmitte
The injection of water mist in the exhaust process will increase gas pressure in the cylinder and affect the output performance of the SCTS-PE, so it is necessary to control the injection time of water mist. Since the SCTS-PE outputs rotary motion during operation, each position of the flywheel signal plate edge corresponds to a crankshaft angle. Therefore, the signal of the crankshaft angle is collected to control the high-pressure water mist system. The induction magnet and unlocking magnet are pasted at different crankshaft angles. When the flywheel rotates rapidly, the induction magnet first moves to the lower part of the induction terminal of the hall sensor to generate electricity. After sustained power generation, the unlocking magnet loses power, forming the cyclic signal acquisition of the hall sensor, and the installation position diagram of the hall sensor is shown in Fig. 8. The 5 V electrical signal collected by the hall sensor is transferred to the NI acquisition card. LabVIEW control program is used to control the output signal of the solenoid valve controlled by the NI acquisition card. The solenoid valve with a frequency response of 120 Hz is switched on and off by the transformer as a DC 24 signal, to control the duration of water spray injection into the cylinder.
4. Experimental process
Preceding the experiment, the thermostatic chamber undergoes heating to attain the targeted experimental temperature. Throughout the experiment, adjustments to the output current of the electromagnetic powder brake controller are made to variably modify the analog load facilitated by the electromagnetic powder brake. Control over the spray temperature is achieved by modulating the water temperature within the thermostatic chamber, while diverse spray timings are attained by manipulating the position of the induced magnet and the unlocking magnet. The alteration of the nozzle diameter is facilitated by its replacement. Subsequently, the ensuing steps delineate the particulars of each experiment:
1) Throughout each experimental trial, the intake pressure is meticulously regulated to attain a level of 0.6 MPa through the precise adjustment of the pressure relief valve.
2) Before each experiment, measurements are taken for the idle rotational speed and the rotational speed under a load of 4 N·m. The variation in speed from the initial experiment was utilized to standardize the speed difference for each set, guaranteeing uniform conditions for all experiments
3) Initially, employing a spray temperature of 94 ℃, a nozzle diameter of 0.15 mm, and a spray timing spanning from 0° to 180°, the investigation focused on assessing the impact of diverse loads on the AOP of the SCTS-PE by systematically varying the applied load.
4) Subsequently, employing a load of 6 N·m, a spray temperature of 94 ℃, and a spray timing spanning from 0° to 180°, the investigation delved into the ramifications of varying nozzle diameters on the SCTS-PE. Furthermore, maintaining a load of 6 N·m, a nozzle diameter of 0.15 mm, and a spray timing from 0° to 180°, the scrutiny extended to examining the influences of different spray temperatures on the SCTS-PE. Finally, under a load of 6 N·m, a spray temperature of 94 ℃, and a nozzle diameter of 0.15 mm, the exploration probed into the repercussions of altering spray timing on the SCTS-PE.
5) Throughout each experimental process, the real-time storage of pressure data and rotational speed data is executed on the computer’s E drive.
Fig. 8Installation position diagram of hall sensor: 1 – induced magnet; 2 – unlocking magnet; 3 – hall sensor
4.1. Uncertainty assessment of experimental systems
To accurately assess the reliability of the results of this experimental system, the entire experimental system is required to carry out uncertainty assessment. this section is mainly on the load torque, the in-cylinder pressure, the rotational speed and the output power to carry out the uncertainty assessment, by the literature [23] can be obtained from the uncertainty assessment in the main assessment equation. The standard uncertainty calculation equation is:
where is the half-width of the confidence interval, is the confidence factor, and the selection of is related to the probability distribution and confidence level. When a measurement parameter is influenced by multiple factors, its synthetic standard uncertainty needs to be calculated, and the equation for is:
where is one of the standard uncertainty components and is the number of standard uncertainty components in the system. The extended uncertainty is calculated by the Eq. (8):
When calculating the extended uncertainty, the confidence level is taken as 95 %, and the table shows that the confidence factor is taken as 2.
4.2. Uncertainty analysis and calculation of cylinder pressure and load torque
After analysis, the main uncertainty components affecting the in-cylinder pressure include the uncertainty component of the fluctuation amplitude of the inlet pressure and the uncertainty component of the pressure measuring equipment, both of which belong to the uncertainty category B. The main uncertainty components affecting the load torque include the uncertainty component of the equipment providing the load torque and the uncertainty component of the equipment controlling the load torque, both of which also belong to the uncertainty category B.
Category B uncertainty component is mainly caused by the accuracy error of measuring equipment. In the calculation of category B uncertainty, assuming that it is a homogeneous distribution, according to the table, the confidence factor is taken as , and according to the accuracy of the measuring equipment in Table 1, the above category B uncertainty can be calculated through Eq. (6), respectively. Through Eqs. (7-8), the synthetic standard uncertainty and extended uncertainty can be calculated respectively. The results of uncertainty calculations for cylinder pressure as well as load torque are shown in Table 2.
Table 2Uncertainty analysis with different nozzle diameters
Uncertainty of cylinder pressure | Uncertainty of load torque | ||||||
0.116 % | 0.289 % | 0.312 % | 0.624 % | 0.289 % | 0.289 % | 0.408 % | 0.816 % |
4.3. Uncertainty analysis and calculation of rotational speed and output power
After analysis, the main uncertainty components affecting the rotational speed include the uncertainty component of the rotational speed measuring equipment, which belongs to category B uncertainty, and the uncertainty component caused by repeated measurements, which belongs to category A uncertainty.
The calculation of category B uncertainty component is shown in Eq. (9):
In the calculation of category A uncertainty component , the sensor under the same experimental conditions, the output rotational speed of repeated measurements, each experiment on which 100 measurements are analyzed, the group of data for the average value of , and calculate the standard deviation , you can evaluate the uncertainty caused by repeated measurements under the conditions of the experiments, the calculation of the equation is as follows:
According to the power calculation Eq. (15), it can be seen that the average output power is calculated indirectly through the equation, so its uncertainty needs to be calculated through the uncertainty transfer equation, which is calculated as Eq. (16):
where is the rotational speed and is the load torque:
Based on the above analysis, Tables 3-5 show the mean , standard deviation , and uncertainty of the rotational speed under different experimental conditions, and the uncertainty of the output power was also calculated.
Table 3Uncertainty analysis with different nozzle diameters
Nozzle diameters (mm) | (rpm) | (rpm) | ||
AEM | 764 | 27 | 2.72 % | 0.033 % |
0.15 | 725 | 28 | 2.82 % | 0.031 % |
0.25 | 733 | 26 | 2.62 % | 0.032 % |
0.35 | 749 | 27 | 2.72 % | 0.033 % |
Table 4Uncertainty analysis with different spray temperatures
Spray temperatures (℃) | (rpm) | (rpm) | ||
AEM | 764 | 29 | 2.92 % | 0.033 % |
92 | 754 | 28 | 2.82 % | 0.033 % |
94 | 745 | 29 | 2.92 % | 0.032 % |
96 | 737 | 30 | 3.02 % | 0.032 % |
Table 5Uncertainty analysis with different spray timings
Spray timings (°) | (rpm) | (rpm) | ||
AEM | 764 | 28 | 2.82 % | 0.033 % |
40-80 | 746 | 27 | 2.72 % | 0.032 % |
0-120 | 779 | 28 | 2.82 % | 0.034 % |
0-180 | 735 | 26 | 2.62 % | 0.032 % |
5. Experimental results and analysis
5.1. Effect of the load on the AOP of the SCTS-PE
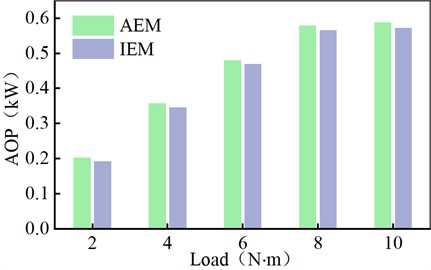
Amidst diverse loads, the operational parameters of the SCTS-PE exhibit variation, consequently influencing the output performance. To ensure the steadfast operation of the SCTS-PE at a consistent pace, loads of 2 N·m, 4 N·m, 6 N·m, 8 N·m, and 10 N·m were judiciously chosen for this experiment. In this study, the impact of IEM and AEM on the AOP of the SCTS-PE was initially explored under distinct loads. Fig. 9 shows the comparative analysis of AOP between IEM and AEM across varying loads.
Fig. 9Comparison of AOP under different loads
In scrutinizing the impact of diverse parameters on output power, the initial step involves ascertaining the stage of stable operation for the SCTS-PE through the collection of speed data. The procedural sequence is as follows: leveraging insights from our research group’s antecedent simulation studies, it is established that the theoretical rotational speed curve manifests sinusoidal oscillations during stable operation. Post-experiment, the gathered rotational speed data is graphically represented as a rotational speed curve, and if the difference between adjacent maximum and minimum rotational speeds falls within 10 rpm, it is deemed that the SCTS-PE has entered the stable operation phase. By calculating the average rotational speed over this period, the average output power can be calculated by Eq. (15).
The computational outcomes are visually presented in Fig. 9. In contrast to the AEM, the IEM exhibits a reduction in AOP by 2.22 %, 3.30 %, 2.08 %, 2.32 %, and 2.84 %, respectively. This discrepancy arises due to the higher gas pressure inside the IEM cylinder during the exhaust phase compared to AEM, resulting in increased resistance for the gas to perform work on the piston during exhaust. This effect outweighs that of the intake and expansion phases, thereby yielding a diminished AOP for IEM. Under a 6 N·m load, calculations unveil an ARS of 764 rpm and an AOP of 0.4797 kW for AEM, serving as foundational data for subsequent comparisons with IEM in the ensuing discussion.
5.2. Effect of nozzle diameter on the SCTS-PE
The nozzle diameter plays a pivotal role in determining the size of water mist droplets. If the droplets are excessively large, it impedes their ability to adequately exchange heat with the gas inside the cylinder upon initial entry. This, in turn, diminishes the efficiency of gas-liquid heat exchange. Conversely, reducing the droplet size augments the surface area available for contact between the liquid and gas, thereby enhancing the rate of heat transfer. Consequently, nozzle diameters are configured at 0.15 mm, 0.25 mm, and 0.35 mm, respectively. The ensuing discussion delves into the detailed impact of nozzle diameter on cylinder pressure, ARS, and AOP of the SCTS-PE.
5.3. Effect of nozzle diameter on the cylinder pressure of the SCTS-PE
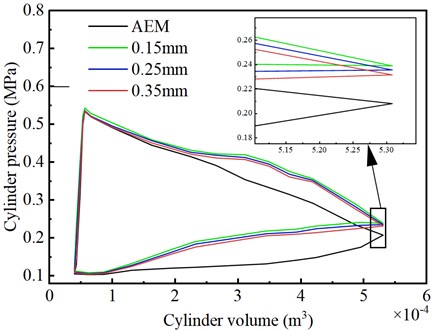
The main factor affecting SCTS-PE performance is cylinder pressure. The cylinder pressure directly determines the output power of the SCTS-PE, thus influencing its overall performance. Fig. 10 shows the - diagram illustrating the effect of nozzle diameter on the cylinder pressure.
From Fig. 10, it can be observed that during the intake process, the cylinder gas pressure of the IEM is slightly higher than that of the AEM. This is because compressed air primarily transfers energy to drive the piston during the intake process, resulting in a smaller decrease in air temperature. As a result, the temperature difference between the water mist and the air is small, and the heat supplied by the water mist to the air is less. The cylinder gas pressure for the IEM with nozzle diameters of 0.15 mm, 0.25 mm, and 0.35 mm are relatively similar, indicating that the size of water droplets has little impact on the gas pressure during the intake process. During the expansion phase, the cylinder gas pressure for IEM is significantly higher than that of AEM. The exhaust pressure of IEM is always higher than the exhaust pressure of AEM. The exhaust pressure for AEM is 0.208 MPa. For IIEM, when the nozzle diameter is 0.15 mm, 0.25 mm, and 0.35 mm, the exhaust pressures are 0.239 MPa, 0.236 MPa, and 0.232 MPa, respectively. These values indicate an increase of 14.9 %, 13.46 %, and 11.54 % compared to AEM. This is because compressed air primarily expands to drive the piston during the intake process, and AEM leads to heat absorption by the gas, reducing the output of mechanical energy. In contrast, IEM utilizes the water mist for reheating, suppressing the temperature drop of the expanding air and allowing for more mechanical energy output. This indicates that spray heat transfer can achieve isothermal expansion of the gas, resulting in higher output pressure during the expansion phase. Smaller water droplet diameters lead to higher cylinder gas pressures during the expansion process, suggesting that smaller water droplet diameters are more favorable for heat exchange between water mist and air. During the exhaust phase, the cylinder gas pressure for IEM is also significantly higher than that of AEM. This is because although the water mist is not sprayed into the cylinder during the exhaust phase, after the heat exchange between the water mist and the air during the intake and expansion processes, the water mist still retains heat and exchanges heat with the gas during the exhaust phase.
Fig. 10Comparison of p-V diagrams for different nozzle diameters
5.4. Effect of nozzle diameter on the ARS and AOP of the SCTS-PE
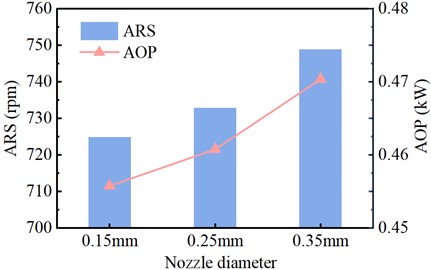
When studying the influence of nozzle diameter on the ARS and AOP of the SCTS-PE, the data used are from the stable operation of the SCTS-PE. Fig. 11 shows the comparison of the effects of AEM on the ARS and AOP of the SCTS-PE under different nozzle diameters.
From Fig. 11, it is possible to see that the ARS of the IEM is lower than that of the AEM. The ARS of the AEM is 764 rpm, while the ARS of the IEM are 725 rpm, 733 rpm, and 749 rpm respectively. As the nozzle diameter increases, the ARS of the IEM increases. This is mainly because a smaller nozzle diameter facilitates heat transfer between the high-temperature mist and the gas in the cylinder, resulting in higher pressure inside the cylinder. As shown in Fig. 10, the pressure inside the cylinder has a significant influence on the exhaust phase, leading to greater gas resistance to piston work during the exhaust process. Therefore, with a nozzle diameter of 0.15 mm, the ARS displays a relatively lower value.
Similarly, it is possible to observe that the AOP of the IEM with different nozzle diameters is lower than that of the AEM. The AOP of the IEM increases with the increase in the nozzle diameter. The main reason, as shown in Fig. 10, is that in the IEM, the area bounded by the - diagram is smaller than that of the AEM. This bounded area represents the work done on the surroundings. Therefore, the AOP of the IEM is lower than that of the AEM. When the nozzle diameter is 0.15 mm, the minimum AOP is 0.4558 kW, which is 5.24 % lower than the AEM power of 0.4797 kW. With nozzle diameters of 0.25 mm and 0.35 mm, the AOPs are 0.4608 kW and 0.4704 kW respectively, representing decreases of 4.1 % and 1.98 % compared to AEM.
Fig. 11Comparison of the effect of nozzle diameter on output performance
5.5. Effect of spray temperature on the SCTS-PE
The variation in spray temperature leads to different amounts of heat transferred by the injected water mist into the cylinder during a cycle, directly affecting the heat transfer rate between the gas and liquid. The following will elaborate in detail on the influence of spray temperature on the cylinder pressure, ARS, and AOP of the SCTS-PE.
5.6. Effect of spray temperature on the cylinder pressure of the SCTS-PE
The cylinder pressure of IEM is different under different spray temperatures. Fig. 12 shows the p-V diagram illustrating the impact of nozzle diameter on the cylinder pressure.
Fig. 12Comparison of p-V diagrams for different spray temperature
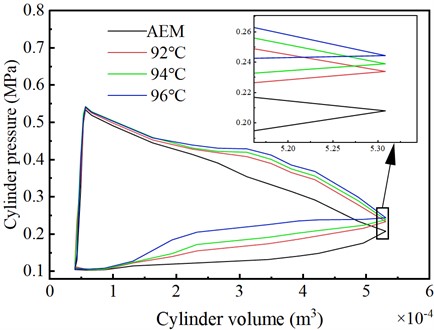
From Fig. 12, during the intake process, the cylinder air pressure of the different spray temperatures in the IEM is generally similar and slightly higher than that of the AEM. This indicates that different spray temperatures have a minor impact on the gas in the intake phase. During the expansion process, the cylinder air pressure of the different spray temperatures in the IEM is higher than that of the AEM. The higher the temperature of the injected water mist, the slightly higher the cylinder air pressure during the expansion phase of the IEM. The exhaust pressure for AEM is 0.208 MPa. For the IEM, when the spray temperature is 92 ℃, 94 ℃, and 96 ℃, the exhaust pressures are 0.235 MPa, 0.239 MPa, and 0.244 MPa, respectively. These values indicate an increase of 12.98 %, 14.9 %, and 17.31 % compared to the AEM. During the exhaust phase, the higher the spray temperature, the higher the cylinder gas pressure in the IEM. This leads to stronger resistance from the gas to the piston’s work during the exhaust phase. These findings indicate that higher spray temperatures of the injected water mist effectively enhance the heat transfer rate from the liquid to the gas.
5.7. Effect of spray temperature on the ARS and AOP of the SCTS-PE
When studying the influence of spray temperature on the ARS and AOP of the expander, the data used are from the stable operation of the SCTS-PE. When the spray temperature is too low, the heat provided may not be sufficient to meet the energy required for internal tax exchange in the cylinder, resulting in suboptimal heat exchange efficiency. On the other hand, when the temperature is too high, the remaining heat may interfere with the expansion phase, impeding the piston’s positive work. Therefore, the spray temperatures adopted in this experiment are 92 °C, 92 °C, and 92 °C, respectively. Fig. 13 shows the comparison of the effects of AEM on the ARS and AOP of the SCTS-PE under different spray temperatures.
Fig. 13Comparison of the effect of spray temperature on output performance
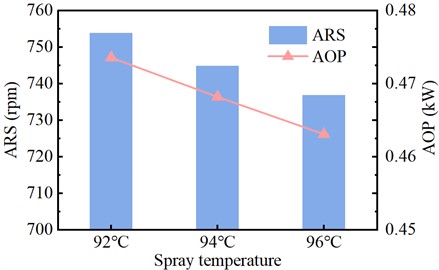
From Fig. 13, it can be observed that the ARS of the IEM is lower than that of the AEM. The ARS of the AEM is 764 rpm, while the ARS of the IEM are 754 rpm, 745 rpm, and 737 rpm respectively. The ARS of the IEM decreases as the spray temperature increases. This is mainly because a higher spray temperature can effectively improve the heat transfer rate of the liquid water. As a result, the pressure inside the SCTS-PE cylinder increases. However, due to the significant influence of cylinder pressure on the exhaust phase, the gas resistance to piston work during the exhaust process increases. Therefore, when the spray temperature is 96 °C, the ARS is relatively lower.
Under a constant load condition, the larger the ARS of the SCTS-PE, the greater the AOP of the SCTS-PE according to the power calculation formula. Fig. 13 illustrates the influence of different spray temperatures on the AOP of the SCTS-PE. From the figure, it can be seen that the AOP of the IEM at different spray temperatures is lower than that of the AEM. The AOP of the IEM decreases as the spray temperature increases. The main reason, as shown in Fig. 12, is that in the IEM, the area bounded by the - diagram is smaller than that of the AEM. This enclosed area represents the work done on the surroundings. Therefore, the AOP of the IEM is lower than that of the AEM. When the spray temperature is 96 °C, the minimum AOP is 0.4631 kW, which is 3.58 % lower than the AEM of 0.4797 kW. At spray temperatures of 92 °C and 94 °C, the AOPs achieved are 0.4736 kW and 0.4682 kW respectively, representing decreases of 1.29 % and 2.45 % compared to AEM.
5.8. Effect of spray timing on the SCTS-PE
The spray timing refers to the duration of injecting water mist during one cycle of system operation. The duration of injecting water mist can be controlled by the crankshaft angle formed by the rotation of the crankshaft. Starting and stopping the water mist at different crankshaft angles will have different effects on the system. Selecting the appropriate spray timing can enhance the output power of air expansion. The following will elaborate in detail on the influence of spray timing on the cylinder pressure, ARS, and AOP of the SCTS-PE.
5.9. Effect of spray timing on the cylinder pressure of the SCTS-PE
The different spray timing has a greater impact on the cylinder pressure. Fig. 14 shows the - diagram illustrating the impact of the cylinder pressure.
Fig. 14Comparison of p-V diagrams for different spray timing
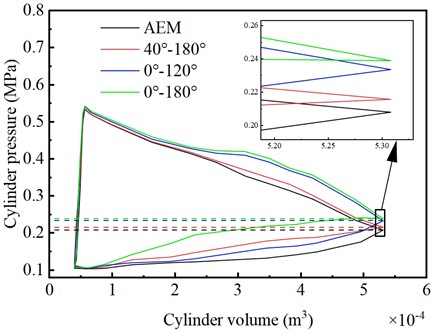
From Fig. 14, it can be observed that the exhaust pressure for the AEM is 0.208 MPa. However, for the IEMs with spray timings of 0°-180°, 0°-120°, and 40°-180°, the exhaust pressures are 0.239 MPa, 0.233 MPa, and 0.216 MPa, respectively. Compared to AEM, these values increased by 14.9 %, 12.02 %, and 3.85 %, respectively. Before the exhaust stage begins, the cylinder pressure of the IEM with a spray timing of 40°-180° is similar to that of the AEM. This is because the IEM injects less water mist during the intake stage with a spray timing of 40°-180°, resulting in insufficient heat exchange between the water mist and the air. On the other hand, compared to the AEM, the IEMs with spray timings of 0°-180° and 0°-120° have higher cylinder pressures during the intake stage, exceeding those of the IEM with a spray timing of 40°-180°. This is mainly because the water mist exchanges heat with the cylinder air throughout the entire intake stage. These results indicate that injecting a fine mist at the beginning of the intake process is more favorable for gas expansion, which also leads to higher cylinder pressure during the exhaust stage in the IEM compared to the AEM. This is because the injected water mist in the IEM participates in heat exchange with the cylinder air during the exhaust stage.
5.10. Effect of spray timing on the ARS and AOP of the SCTS-PE
When studying the influence of spray timing on the ARS and AOP of the SCTS-PE, the data used are from the stable operation of the SCTS-PE. Fig. 15 shows the comparison of the effects of AEM on the ARS and AOP of the SCTS-PE under different spray timing.
From Fig. 15, it can be seen that when the spray timing is 0°-120°, the ARS of the IEM is higher than that of the AEM. When the spray timing is 0°-180° and 40°-180°, the ARS of the IEM is lower than that of the AEM. The main reason is that under the 0°-120° spray timing, less water mist is injected during the intake and expansion phases, which promotes efficient heat exchange between the water mist and air. Only a small amount of residual water mist enters the exhaust phase, resulting in minimal impact on the exhaust phase and less negative work done by the gas on the piston. In contrast, in the other two spray timings, a large amount of residual water mist enters the exhaust phase and undergoes heat exchange with the gas, resulting in higher pressure inside the cylinder and more negative work done. Therefore, the ARS is lower in the IEM compared to the AEM.
Fig. 15Comparison of the effect of spray timing on output performance
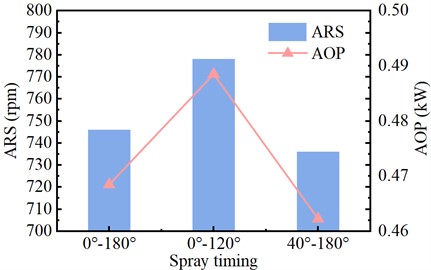
Under a constant load condition, the larger the ARS of the expander, according to the power calculation formula, the greater the AOP of the SCTS-PE. Fig. 15 illustrates the influence of different spray timings on the AOP of the SCTS-PE. When the spray timing is 0°-120°, the AOP of the IEM is 0.4885 kW, which is a 1.84% increase compared to AEM. When the spray timing is 0°-180° and 40°-180°, the AOP of the IEM is 0.4685 kW and 0.4623 kW, representing decreases of 2.39 % and 3.76 % respectively compared to AEM. The main reason for these results, as seen in Fig. 14, is that in the IEM, the area enclosed by the p-V diagram for the 0°-120° spray timing is larger than that of the AEM. The enclosed area represents the work done on the surroundings. Therefore, under this spray timing, the AOP of the IEM is greater than that of the AEM. On the other hand, the area enclosed by the p-V diagram for the 0°-180° and 40°-180° spray timings is smaller than that of the AEM. Hence, the AOP of the IEM is lower than that of the AEM for these two spray times.
6. Conclusions
This paper presents an experimental study on SCTS-PE based on in-cylinder spray heat transfer. Firstly, the influence of different load torques on the SCTS-PE output power is investigated. Then, a single-variable analysis is conducted on three parameters of the spray system: nozzle diameter, spray temperature, and spray timing. The study examines the effects of these individual parameters on cylinder pressure, ARS, and AOP. The following conclusions are drawn from the experimental analysis:
1) Under the influence of different loads, both the AOP of the IEM and the AEM increase with increasing load. Moreover, the AOP of the IEM is lower than that of the AEM, with reductions of 2.22 %, 3.30 %, 2.08 %, 2.32 %, and 2.84 % as the load increases.
2) Under the influence of different nozzle diameters, the exhaust pressure of the IEM is higher than that of the AEM, with increases of 14.9 %, 13.46 %, and 11.54 % respectively. However, the cylinder pressure during the exhaust phase remains higher in the IEM, with a greater impact compared to the intake and expansion phases. Consequently, the ARS and AOP of the IEM are lower than those of the AEM. The AOP decreases by 5.24 %, 4.10 %, and 1.98 % respectively for different nozzle diameters, while the AOP of the IEM increases with larger nozzle diameters.
3) Under the influence of different spray temperatures, the exhaust pressure of the IEM is higher than that of the AEM, with increases of 12.98 %, 14.9 %, and 17.31 % respectively. The ARS and AOP of the IEM are lower than those of the AEM. The AOP decreases by 1.29 %, 2.45 %, and 3.58 % respectively for different spray temperatures, while the AOP of the IEM decreases with increasing spray temperature.
4) Under the influence of different spray timings, the exhaust pressure of the IEM is higher than that of the AEM, with increases of 14.9 %, 12.02 %, and 3.85 % respectively. However, during the exhaust phase, the cylinder pressure is significantly higher for a spray timing of 40°-180° compared to the other two timings. When the spray timing is 0°-120°, the AOP of the IEM is higher than that of the AEM, with an increase of 1.84 %. When the spray timing is 0°-180° and 40°-180°, the AOP of the IEM is lower than that of the AEM. The minimum AOP is 0.4623 kW for a spray timing of 40°-180°, representing a reduction of 3.76 % compared to AEM.
5) The IEM can increase the pressure in the cylinder, but it has a greater impact on the exhaust stage. Excessive exhaust pressure reduces the AOP of the SCTS-PE, but the AOP of the IEM with appropriate spray timing can be greater than that of the AEM. The ideal spraying timing is 0°-120°, and the AOP of IEM has increased by 1.84 %.
References
-
Y. Shi, “China’s annual wind and photovoltaic power generation has reached a historic high,” (in Chinese), Petroleum and New Energy, Vol. 35, No. 1, pp. 12–16, 2023.
-
Z. Tong, Z. Cheng, and S. Tong, “A review on the development of compressed air energy storage in China: Technical and economic challenges to commercialization,” Renewable and Sustainable Energy Reviews, Vol. 135, p. 110178, Jan. 2021, https://doi.org/10.1016/j.rser.2020.110178
-
S. W. Mei et al., “Research and engineering practice of non-supplementary combustion compressed air energy storage: Taking Jintan national demonstration project as an example,” (in Chinese), Experimental Technology and Management, Vol. 39, No. 5, pp. 1–8, 2022.
-
B. Huang, X. Qiu, W. Wang, H. Li, and W. Zhou, “Overview of research situation and progress on compressed air energy storage technology,” in IOP Conference Series: Earth and Environmental Science, Vol. 295, No. 2, p. 012020, Jul. 2019, https://doi.org/10.1088/1755-1315/295/2/012020
-
M. Budt, D. Wolf, R. Span, and J. Yan, “A review on compressed air energy storage: Basic principles, past milestones and recent developments,” Applied Energy, Vol. 170, pp. 250–268, May 2016, https://doi.org/10.1016/j.apenergy.2016.02.108
-
M. Heidari, M. Mortazavi, and A. Rufer, “Design, modeling and experimental validation of a novel finned reciprocating compressor for Isothermal Compressed Air Energy Storage applications,” Energy, Vol. 140, pp. 1252–1266, Dec. 2017, https://doi.org/10.1016/j.energy.2017.09.031
-
C. Qin and E. Loth, “Simulation of spray direct injection for compressed air energy storage,” Applied Thermal Engineering, Vol. 95, pp. 24–34, Feb. 2016, https://doi.org/10.1016/j.applthermaleng.2015.11.008
-
Q. He and K. Wang, “Research progress of isothermal compressed air energy storage technology,” Thermal Power Generation, Vol. 51, No. 8, pp. 11–19, 2022.
-
O. N. Igobo and P. A. Davies, “Review of low-temperature vapour power cycle engines with quasi-isothermal expansion,” Energy, Vol. 70, pp. 22–34, Jun. 2014, https://doi.org/10.1016/j.energy.2014.03.123
-
E. M. Gouda, Y. Fan, M. Benaouicha, T. Neu, and L. Luo, “Review on liquid piston technology for compressed air energy storage,” Journal of Energy Storage, Vol. 43, p. 103111, Nov. 2021, https://doi.org/10.1016/j.est.2021.103111
-
W. He and J. Wang, “Optimal selection of air expansion machine in compressed air energy storage: a review,” Renewable and Sustainable Energy Reviews, Vol. 87, pp. 77–95, May 2018, https://doi.org/10.1016/j.rser.2018.01.013
-
X. Zhang, Y. Xu, J. Xu, H. Xue, and H. Chen, “Study of a single-valve reciprocating expander,” Journal of the Energy Institute, Vol. 89, No. 3, pp. 400–413, Aug. 2016, https://doi.org/10.1016/j.joei.2015.02.013
-
A. T. Rice, P. Y. Li, and C. J. Sanckens, “Optimal efficiency-power tradeoff for an air compressor/expander,” Journal of Dynamic Systems, Measurement, and Control, Vol. 140, No. 2, p. 02101, Feb. 2018, https://doi.org/10.1115/1.4037652
-
J. Wieberdink, P. Y. Li, T. W. Simon, and J. D. van de Ven, “Effects of porous media insert on the efficiency and power density of a high pressure (210 bar) liquid piston air compressor/expander – an experimental study,” Applied Energy, Vol. 212, pp. 1025–1037, Feb. 2018, https://doi.org/10.1016/j.apenergy.2017.12.093
-
H. Chen, Y.-H. Peng, Y.-L. Wang, and J. Zhang, “Thermodynamic analysis of an open type isothermal compressed air energy storage system based on hydraulic pump/turbine and spray cooling,” Energy Conversion and Management, Vol. 204, p. 112293, Jan. 2020, https://doi.org/10.1016/j.enconman.2019.112293
-
P. Zhao, Y. Lai, W. Xu, S. Zhang, P. Wang, and J. Wang, “Performance investigation of a novel near‐isothermal compressed air energy storage system with stable power output,” International Journal of Energy Research, Vol. 44, No. 14, pp. 11135–11151, Aug. 2020, https://doi.org/10.1002/er.5633
-
B. Bollinger, “Demonstration of isothermal compressed air energy storage to support renewable energy production,” Office of Scientific and Technical Information (OSTI), Technology performance report, Jan. 2015.
-
X. Zhang et al., “A near-isothermal expander for isothermal compressed air energy storage system,” Applied Energy, Vol. 225, pp. 955–964, Sep. 2018, https://doi.org/10.1016/j.apenergy.2018.04.055
-
C. Braasch, W. Nieratschker, M. Nadler, and D. Nett, “Experimental and numerical investigation of heat transfer by water spray injection into pressurized gas atmospheres,” Applied Thermal Engineering, Vol. 214, p. 118682, Sep. 2022, https://doi.org/10.1016/j.applthermaleng.2022.118682
-
Q. Yu, X. Li, Y. Geng, and X. Tan, “Study on quasi-isothermal expansion process of compressed air based on spray heat transfer,” Energy Reports, Vol. 8, pp. 1995–2007, Nov. 2022, https://doi.org/10.1016/j.egyr.2022.01.019
-
Q. Yu, M. Cai, Y. Shi, and Q. Xu, “Optimization study on a single-cylinder compressed air engine,” Chinese Journal of Mechanical Engineering, Vol. 28, No. 6, pp. 1285–1292, Jul. 2015, https://doi.org/10.3901/cjme.2015.0520.072
-
Q. Yu, M. Cai, Y. Shi, and Z. Fan, “Optimization of the energy efficiency of a piston compressed air engine,” Strojniški vestnik – Journal of Mechanical Engineering, Vol. 60, No. 6, pp. 395–406, Jun. 2014, https://doi.org/10.5545/sv-jme.2013.1383
-
Z. F. Huang, W. Tan, S. J. Jiang, Y. H. Ding, S. Zheng, and Q. Y. Hou, “Vortexer flow test uncertainty evaluation and optimal formula validation,” Measurement & Control Technology, Vol. 43, No. 7, pp. 55–64, 2024.
About this article

The research work presented in this paper is financially supported by a Grant (52065054) from the National Natural Science Foundation of China and a Grant (2022LHMS05023) from the Natural Science Foundation of Inner Mongolia.
The datasets generated during and/or analyzed during the current study are available from the corresponding author on reasonable request.
Qihui Yu: conceptualization, formal analysis, funding acquisition, resources, writing-review and editing. Jiabao Zhang: writing-original draft preparation, investigation, supervision. Xiaodong Li: methodology, validation. Guoxin Sun: visualization. Ripeng Qin: software. Feng Li: project administration.
The authors declare that they have no conflict of interest.
