Abstract
In the process of modifying titanium alloy oral implants using cavitation water jet, the collapse of bubbles releases significant energy. This phenomenon is accompanied by micro-jets and shock waves, which induce changes in the three-dimensional microscopic morphology of the implant surface. The loose and porous surface of the implant will increase the adhesion area of the cells, which is more conducive to the combination of the oral implant with the surrounding bone tissue. In order to explore the coupling mechanism between the instantaneous energy of bubble collapse and the surface deformation of titanium metal, based on different flow field and solid field model parameters, the numerical analysis software Ansys and the fluid-structure coupling simulation method are used to establish the numerical simulation model of single bubble collapse on the near curved wall. In order to explore the coupling mechanism between the instantaneous energy of bubble collapse and the surface deformation of titanium metal, the bubble growth process is ignored. Based on different flow field and solid field model parameters, this paper adopts the numerical analysis software Ansys and the fluid-structure coupling simulation method to establish the numerical simulation model of single bubble collapse on the near curved wall. The effects of flow field parameters and wall morphology on the transient flow field of bubble collapse and the effect of metal surface modification are revealed. The results show that when the initial bubble diameter is 180 μm, the instantaneous collapse high pressure reaches 7.24 GPa, and the maximum stress on the titanium surface is 689 MPa, which is 1.57 times higher than that under the bubble diameter of 60 μm. When the bubble collapses away from the wall, due to the weakened constraint of the wall, more intense energy is released, but the energy decays rapidly in the propagation process, and the energy loss when it reaches the wall is more serious. In this paper, the surface micromorphology is simplified into a near-curved shape. After the modification, the flow obstruction on the near-curved concave wall inhibits bubble collapse, resulting in an increase in bubble collapse time. The stress and deformation caused by a single bubble collapse are concentrated within a radius of 1mm and a depth of 5 μm.
Highlights
- A numerical simulation model of single bubble collapse on curved wall is established
- The transient characteristics of the flow field and the stress and strain law of the solid field are analyzed
- Reveal the interaction law between the bubble collapse flow field and the titanium surface
1. Introduction
Titanium oral implants have excellent performance and are widely favored in the market, but their processing is complex and cumbersome. A research group [1], [2], proposed using cavitation water jet technology to modify the implant surface, which can increase the contact surface area, promote osseointegration and biocompatibility, and at the same time has the advantages of being efficient, clean, and pollution-free. Through the treatment of titanium oral implants by cavitation water jet, the microscopic mechanism shows that the cavitation releases huge energy on the titanium surface, resulting in the formation of a large number of dense pits on the titanium surface. Therefore, it is very important to explore the law between the cavitation energy and metal deformation.
Domestic and foreign scholars have conducted research on the mechanism of bubble collapse [3-5]. Hu et al. [6] found that the initial velocity of bubble splitting is the highest, gradually decreasing as the cavitation bubbles continuously collapse. The key parameter affecting jet velocity is the dimensionless distance. Xia et al. [7] found that when the dimensionless distance 1.0, the main cause of solid domain damage is the micro-jet, and when the dimensionless distance 1.5, the shock wave becomes the dominant factor. Liu [8] found that the bubble collapse is influenced by environmental pressure. The rate of bubble collapse slows down and the velocity of micro-jets decreases accordingly with the pressure decreasing. Zhao [9] found that the diameter of the cavitation bubbles has a significant impact on the velocity of the micro-jets produced by cavitation collapse and the magnitude of the local pressure. The larger the diameter of the cavitation bubble, the greater the energy produced by its collapse. Kim [10] studied bubble collapse near ridge structures and elucidated variations in the form of bubble collapse under different surface geometries. Zhao et al. [11] observed that compared to the flat side wall, the concave surface side wall delays the process of bubbles collapse while the convex side wall promotes it. This phenomenon becomes more pronounced with an increase in the curvature parameter of the side wall.
While investigating the mechanism of bubble collapse and flow field characteristics, the impact of the substantial energy generated by bubble collapse on metal materials has garnered significant attention from scholars. Okita et al. [12] discovered that when the lower quarter of the bubble is in contact with a solid surface, it results in the highest peak wall stress. If this stress exceeds the yield strength value of the metal, cavitation erosion on the solid surface is expected to occur. Sagar et al. [13] observed that damage to solid surfaces is most severe when there is a distance between the bubble and the surface equal to its radius. Wang et al. [14], utilizing laser-induced bubbles for micro-machining purposes, found that as the initial position of the bubble moves away from sheet metal, deformation depth decreases; conversely, it increases with higher laser energy and number of impacts. Reuter et al. [15] discussed the mechanism of material erosion and found that energy focusing plays a decisive role in the surface destruction of materials during bubble collapse. Firly et al. [16] concluded that damage occurs due to yield fatigue and low circumferential fatigue for softer polymers while the damage of harder polymers and metals experiences higher circumferential fatigue due to repeated loading caused by bubble rupture.
In summary, most of the current research reported in the literature focuses on analyzing the flow field characteristics of cavitation bubble collapse, with relatively little research on the intrinsic correlation mechanism between cavitation bubble collapse and metal deformation. In particular, there have been no reports on the fluid-solid coupling effects between metals with surface micro-morphology structures and cavitation bubble collapse. Therefore, combined with the effect of the previous cavitation water jet modification experiment, this paper simplified the pit morphology of the wall into a curved wall morphology, and established a numerical simulation analysis model for the collapse of a single bubble on a near-wall curved surface [17]. Through the analysis of the transient characteristics of the flow field and the stress and strain of the solid field, the understanding of the characteristics of the single bubble collapse flow field is not only improved, but also a theoretical basis is provided for the change of planting shape and appearance.
2. Numerical calculation method and preprocessing method
2.1. Bubble dynamics equation
Consider a bubble in an unbounded fluid, the bubble wall is a free interface, but there is no mass transport through the wall; The bubble is a mixture of gas and steam, uniform distribution; The bubble is liquid and incompressible [18]. Raleigh-Plesset equation describing radial motion of bubble:
where, is the bubble radius, and are the radial motion velocity and acceleration of the bubble wall, respectively. and are non-condensing gas inside the bubble at normal temperature and saturated vapor pressure of liquid outside the bubble, respectively. is the liquid pressure away from the bubble wall. , and are the outer liquid density, surface tension coefficient and dynamic viscosity coefficient, respectively.
Let the bubble contain only steam, and the liquid outside the bubble is a constant pressure field, that is,0, . Ignoring the viscous force and surface tension of the liquid, Eq. (1) is simplified as:
Initial condition: when 0, , 0.
By converting the time integral on both sides of Eq. (2) into the integral, the velocity and acceleration of the bubble wall during the collapse of the spherical steam bubble and the pressure change in the liquid around the bubble wall can be obtained, respectively:
According to Eq. (3), the collapse time of spherical steam bubble with initial radius of can be obtained as:
2.2. Model building and grid division
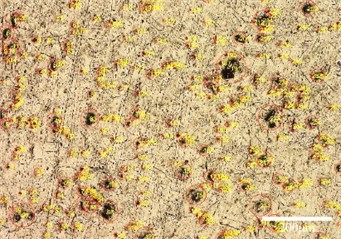
The micro-morphology of medical titanium metal modified by cavitation water jet is shown in Fig. 1. The results show that the surface of the metal material is uniformly distributed with dense pits of micron-scale. The data analysis of the experimental results by the research group reveals that the diameters of these pits primarily range in diameter from 0-200 μm [1], [2]. Therefore, based on the surface micro-morphology, this paper utilizes Ansys software to conduct an analysis of the bubble collapse fluid-solid coupling characteristics. The surface deformation and stress distribution of titanium metal are revealed by analyzing the difference of collapse instantaneous pressure field and velocity field.
Combined with the micromorphology and size of the titanium material under cavitation water jet, a two-dimensional simulation model of fluid-to-structure coupling is established as shown in Fig. 2, which is mainly divided into two parts: the fluid domain and the solid domain [19]. The size of the fluid domain is set as and , and the width of the solid domain is set as . The interface between the fluid domain and the solid domain is set as the fluid-structure coupling wall.
Fig. 1Surface morphology of titanium after cavitation water jet treatment
The bubble collapse stage is accompanied by drastic pressure changes and instantaneous energy impact, and the shock wave and micro-jet generated by the collapse act on the metal surface, causing plastic deformation. This paper focuses on the coupling mechanism between the instantaneous flow field characteristics of bubble collapse and the action of solids, so the growth stage of cavitation is ignored, and the maximum radius of cavitation after full development is defined as . The distance between the center of the bubble and the lowest point of the fluid-structure coupling pit is , and the dimensionless number is used to represent the distance between the bubble and the wall, In order to explore the influence of surface micromorphology on bubble collapse, the pit depth is set as and the pit diameter as . The and directions are shown in Fig. 2. The specific size and parameter range of the model are shown in Table 1.
Fig. 2Two-dimensional simulation model of fluid-solid coupling
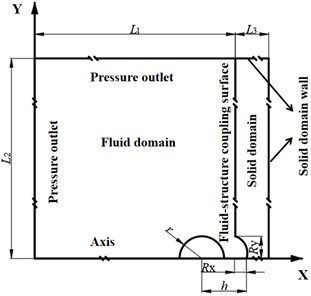
Table 1Simulation model parameter dimensions
Model parameter | Value |
(mm) | 6 |
(mm) | 6 |
(mm) | 1 |
(μm) | 60-180 |
1.5-3 | |
(μm) | 50-125 |
(μm) | 25-100 |
To ensure the accuracy of the numerical simulation, four sets of grid schemes have been designed to encrypt the positions of the bubble and solid domain walls. Due to the shape of the boundary surface, triangular mesh is more suitable for the fluid domain at the pit, and other flow fields, namely solid fields, are divided into quadrilateral mesh [20]. The results of grid independence verification are shown in Table 2. Based on the criterion of the total bubble collapse time, it is observed that beyond 8.3×10⁵ grids, there is minimal change in bubble collapse time, indicating that the number of grids has negligible influence on the numerical simulation results [21]. Therefore, a final selection of 8.3×10⁵ grids is made.
Table 2Grid independence verification
Grid quantity | Total bubble collapse time (μs) |
2.1×10⁵ | 10.5100 |
4.2×10⁵ | 10.4925 |
8.3×10⁵ | 10.5280 |
1.65×10⁶ | 10.5285 |
2.3. Boundary conditions and calculation methods
The fluid domain boundary of the two-dimensional simulation model of fluid-solid coupling is all set to a pressure outlet, while the solid domain boundary is set to a rigid wall. The fluid domain material is set to water, titanium metal is chosen for the solid domain. The fluid-solid coupling surface is set to Intrinsic FSI. Regarding bubble setting, the gas inside the cavitation bubble is defined as an ideal gas, with the primary phase set as the gas and the secondary phase set as liquid water, without considering the effects of turbulence. The initial pressure inside the cavitation bubble is set to 2338 Pa, and the initial temperature is set to 293 K.
The transient equation is used to calculate the bubble collapse process, the VOF equation is used to solve the interface between the bubble and water, and the Structure model is used to solve the change of the solid domain. The PISO method is used for pressure-velocity coupling and the PRESTO! is used for pressure discretization.
In the simulation process of bubble collapse, the variable time step method is adopted, and the Courant number value 0.25 is used as the adjustment basis. When the Courant number is greater than 0.25, the small step length is appropriately adjusted. In the early stage of collapse, the flow field parameter changes slightly, and a larger time step of 5e-8 is used to improve the calculation efficiency. With the further development of the collapse process, the characteristic parameters of the flow field such as pressure and velocity change in a large gradient. At this time, the time step is gradually reduced to capture the complex phenomenon in the collapse process more accurately. In the late collapse period, the time step was further reduced to 1e-10 to ensure the accuracy and stability of the simulation results. By adjusting the strategy with varying time step, the simulation accuracy can be guaranteed and the use of computing resources can be optimized.
3. Analysis of the bubble collapse process under different flow field model parameters
3.1. Analysis of fluid-solid coupling effect of single bubble collapse
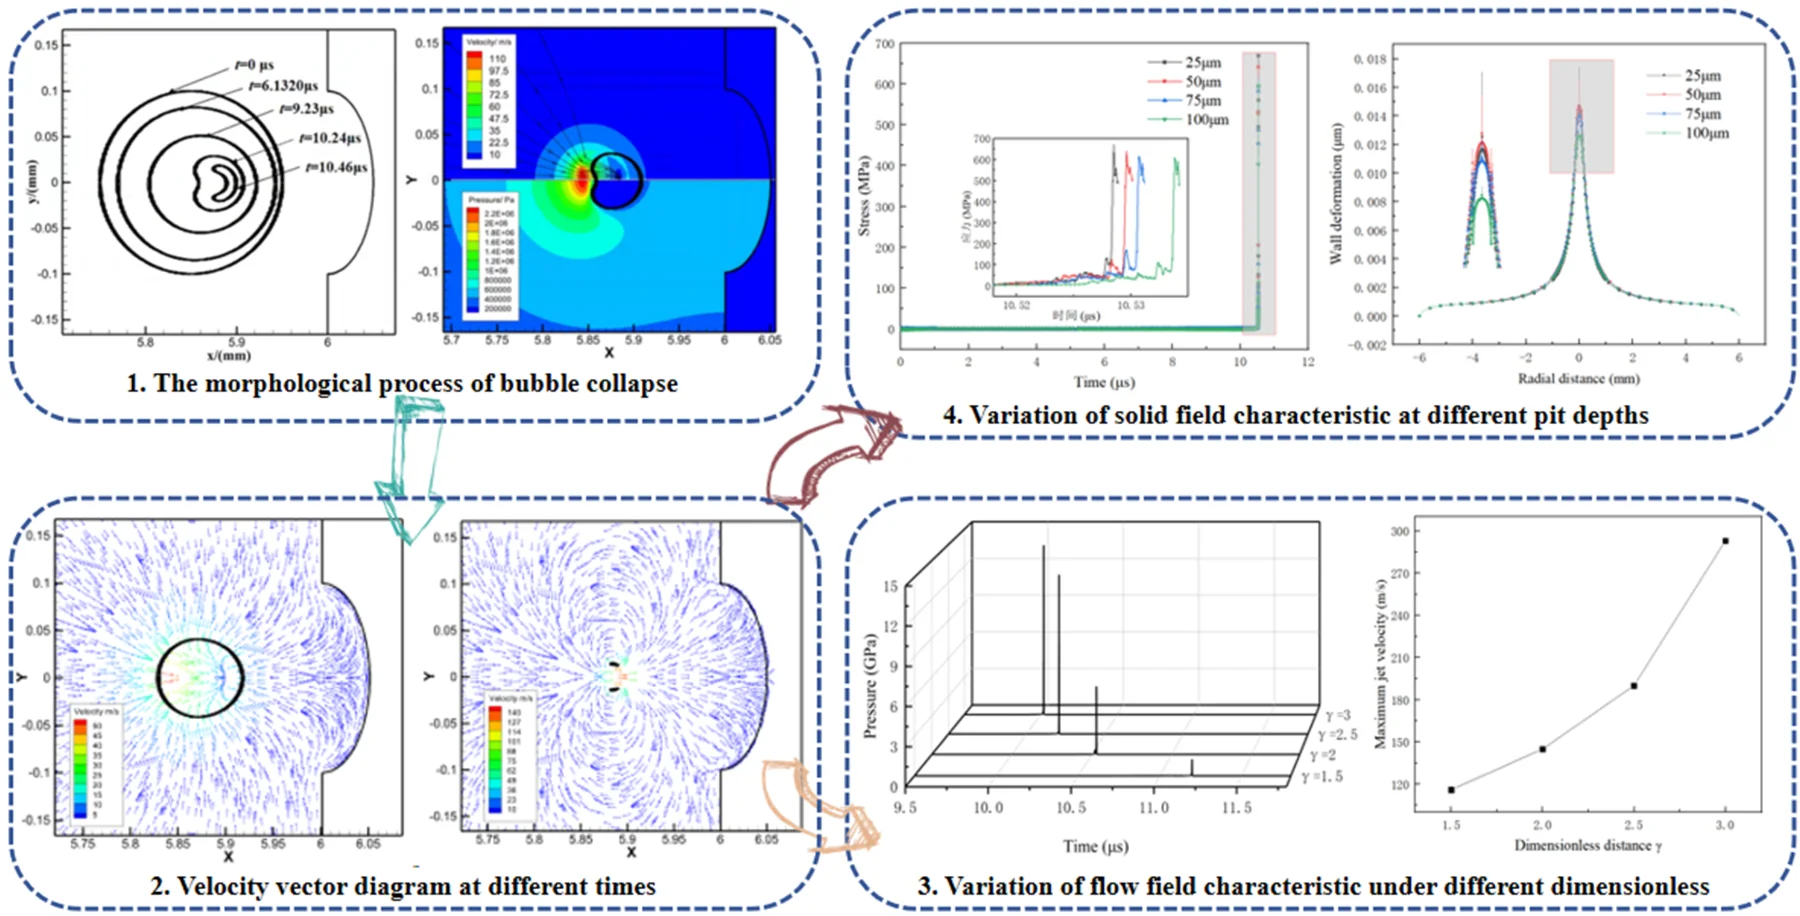
In this section, the initial bubble radius 100 μm, 2, pit diameter 100 μm, and pit depth 50 μm are taken as examples to investigate the morphological evolution of single bubble at the near-curved wall, the change of flow field characteristics, and the mechanism of action on the solid surface. The bubble morphology changes are shown in Fig. 3. At the initial stage of collapse, the bubble is circular. As the pressure difference acts on it, the bubble size gradually decreases. Due to the obstruction of the wall, the bubble deformation near the wall is smaller compared to that away from it. Consequently, the bubble shape gradually approaches an ellipse at 9.23 μs. With further compression during collapse, the volume of the bubble continues to decrease and its morphology at far wall surfaces transitions into a flat state, and then gradually indents inward, as shown at 10.14 μs. At 10.46 μs, the bubble is in the late stage of collapse. The bubble morphology appears as an extremely obvious inward depression phenomenon, away from the wall of the high-pressure region to form a micro-jet. When the micro-jet penetrates the bubble, the form of the bubble becomes two halves, releasing a large amount of energy, and the shock wave and the micro-jet act on the wall to cause wall deformation.
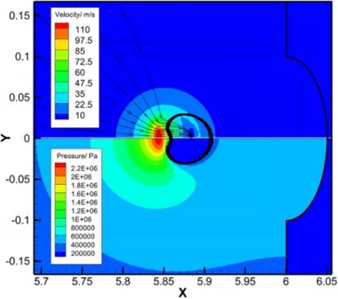
In the process of bubble collapse, the bubble pressure-velocity cloud diagram is shown in Fig. 4. The maximum jet velocity appears at the place where the bubble is far away from the wall, which is much higher than the near-wall velocity. The velocity streamlines converge at the far wall of the bubble, and micro-jets are accumulated at the end of the bubble collapse, with the direction toward the wall and the maximum pressure position consistent with the maximum jet velocity position. The flow field pressure decreases from the high pressure region at the far wall of the bubble to the periphery, and the bubble wall constantly deforms under the pressure difference between the high pressure at the far wall and the low pressure inside the bubble.
Fig. 3The morphological process of bubble collapse
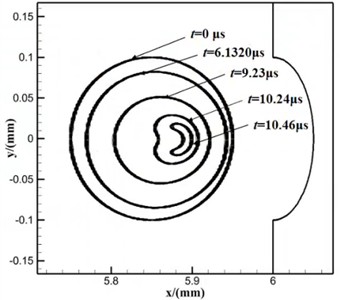
Fig. 4Near wall bubble pressure-velocity diagram
As shown in Fig. 5, the maximum collapse pressure of the flow field changes with time. In the early stage of bubble collapse, the flow field pressure remains relatively stable; at the end of bubble collapse, the instantaneous high-pressure phenomenon occurs in the flow field. When 10.5295 μs, the maximum pressure in the flow field reaches 5.25 GPa and appears at the bubble collapse center, and the pressure wave gradually decreases from the bubble collapse center to the surrounding area. When it reaches the center of the wall pit, the wall pressure reaches 700 MPa, and the energy attenuates rate close to 90 %.
Fig. 5The maximum pressure of the flow field changes with time
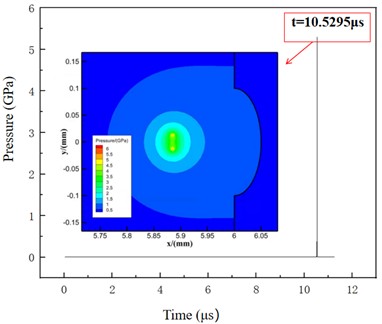
Fig. 6The titanium center deformation changes with time
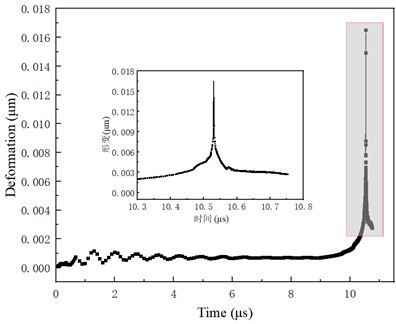
As shown in Fig. 6, the surface center deformation of titanium metal changes with time. In the early and middle stages of the collapse process, the impact of the pressure wave on titanium metal remains below its yield point due to the relatively low pressure in the flow field, resulting in almost imperceptible changes in the center of titanium metal. At the end of collapse, the pressure of the flow field increases rapidly, leading to significant energy accumulation at the far wall of the bubble, and the bubble is broken down into two halves by the micro-jet. The combined effect of the shock wave and the micro-jet induces substantial deformation surges at the center of titanium metal. Following the dissipation of bubble energy, elastic properties inherent to titanium metal cause a rebound phenomenon in surface deformation before ultimately stabilizing.
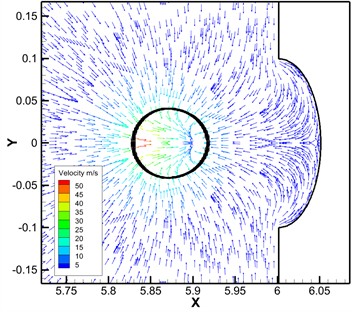
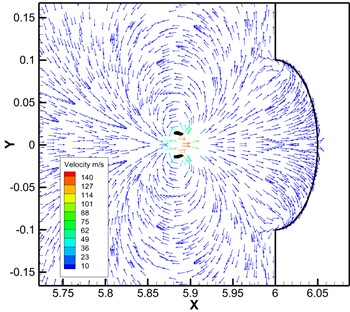
At the end of the bubble collapse, the liquid gathers into a micro-jet at the far wall of the bubble and radiates shock waves around the bubble splitting center, which causes disturbance to the liquid in the convection field and changes the direction of liquid movement. Therefore, the velocity vector diagram at different times is extracted as shown in Fig. 7 to analyze the flow characteristics during bubble collapse. When 9.8470 μs, the external pressure of the flow field is greater than the internal pressure of the bubble, the liquid around the bubble points to the center of the bubble while simultaneously reducing its volume, and the maximum velocity at the far wall reaches 50 m/s. When 10.5295 μs, the micro-jet has broken down the bubble, and the speed surges with a peak value reaching 140 m/s. The micro-jet drives the surrounding liquid to move towards the wall. When the micro-jet reaches the wall, part of the liquid acts on the wall vertically, and its impact causes the deformation of the solid wall, while the other part of the liquid moves tangentially along the curved wall and flows into the fluid domain through the pits. This process also impact the wall and cause surface damage.
Fig. 7Velocity vector diagram at different times
a)9.8470 μs
b)10.5295 μs
3.2. Comparative analysis of the influence of bubble radius on fluid-solid coupling characteristics
In this section, with the same dimensionless distance maintained at 2, a constant pit radius 100 μm, and pit depth 50 μm, the influence of varying bubble radius on the flow field characteristic parameters and stress deformation in the solid field is investigated. The maximum bubble diameter after full cavity development is defined as 180 μm, and the bubble diameter sizes are selected as 60 μm, 100 μm, 140 μm, and 180 μm, respectively.
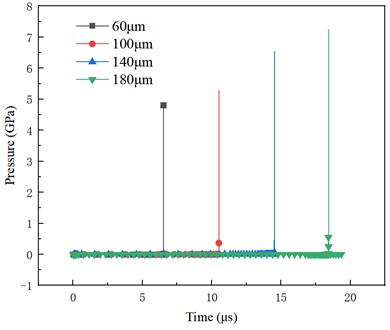
The time-dependent variation of flow field pressure for different bubble radii is shown in Fig. 8. Under different working conditions, the maximum flow field pressure appears during the late stage of bubble collapse. The space-time bubble has been broken down into two halves, and a huge amount of energy is released instantly. With the increase of the bubble radius, the time required for bubble collapse increases, the energy accumulated by the bubble increases, and the instantaneous high pressure generated during bubble collapse also increases, from 4.81 GPa to 7.24 GPa. The approximate theoretical collapse times based on the bubble collapse time formula in Section 2.1 for bubble diameters of 60 μm, 100 μm, 140 μm, 180 μm are 5.49 μs, 9.15 μs, 12.81 μs, 16.47 μs, respectively. The collapse times obtained by numerical simulation are 6.51 μs, 10.53 μs, 14.51 μs, 18.42 μs, which are within reasonable deviations.
Fig. 8Variation of flow field pressure with time for different bubble radii
The wall stress distribution under different bubble radii is shown in Fig. 9. The maximum stress is concentrated at the center of the wall pit, and the larger the initial bubble radius, the more obvious the impact effect on the wall caused by bubble collapse. When the bubble radius is 180 μm, the maximum surface stress of titanium metal can reach 689 MPa, which is 1.57 times higher than that at the bubble radius of 60 μm. Along the pit center radius of 1mm, the cavitation jet impact effect is more obvious, when the bubble radius is greater than 100 μm, the wall stress reaches more than 400 MPa, the stress repeatedly acts on the metal surface, titanium metal surface produces high cycle fatigue, resulting in surface deformation. When the radius of action increases to 2 mm, the impact effect has basically attenuated and disappeared.
Fig. 9Wall stress under different initial bubble radii
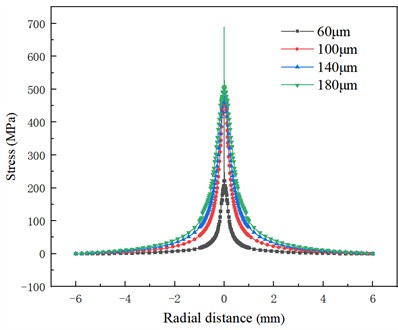
Fig. 10Wall deformation distribution under different initial bubble radii
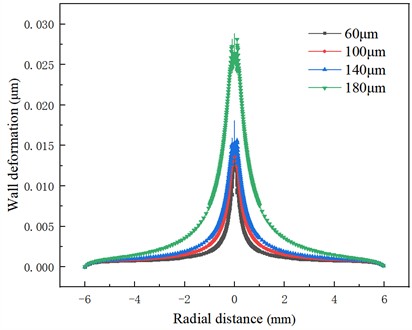
The maximum surface deformation distribution of titanium metal under different bubble diameters is shown in Fig. 10, which is consistent with the distribution law of wall stress. The greater the stress is, the more obvious the deformation is in the region, and the wall deformation gradually decreases with the increase of -direction distance. The greater the stress is, the more obvious the deformation is in the region, and the wall deformation gradually decreases with the increase of radial distance. In the circular area with a metal center radius of about 1mm, there is an obvious stress concentration phenomenon, and under the repeated action of stress, obvious wall deformation is formed. When the bubble radius is 60 μm, the inner wall deformation of the metal center radius of 0.174 mm reaches 0.008 μm; whereas for a bubble radius of 140 μm, this variable area expands and doubles compared to that associated with a bubble radius of 60 μm. Larger bubble radii correspond to higher energy levels and wider ranges of influence. In the area 3 mm away from the center, there is negligible effect of shock wave and micro-jet, stress levels approach zero and minimal deformations occur on the wall.
3.3. Comparative analysis of the influence of dimensionless distance on fluid-solid coupling characteristics
This section explores the effects of different dimensionless distances on bubble collapse characteristics of near-wall curved surfaces. The initial bubble radius 100 μm, pit radius 100 μm, pit depth 50 μm, and dimensionless distances are 1.5, 2, 2.5, and 3, respectively.
As shown in Fig. 11, with the increase of dimensionless distance , the bubble moves away from the wall, the constraint effect of the wall on the bubble is weakened, the bubble deformation speed is accelerated, and the bubble collapse time is shortened, but the collapse pressure increases. When 2.5, the distance between the bubble center and the wall has a significant effect on the collapse time and collapse pressure of the bubble. Compared to 2.5 and 1.5, there is a shortened 8.8 % reduction in collapse time and a substantial 900 % increase in maximum flow field pressure value. When 2.5, the space-time bubble has moved away from the wall, which is similar to the effect of infinite domain bubble collapse, and the influence of the wall is greatly reduced.
Fig. 11Variation of flow field pressure at different dimensionless distances with time
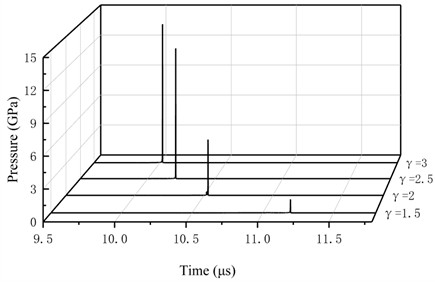
Fig. 12Maximum jet velocity changes with dimensionless distance
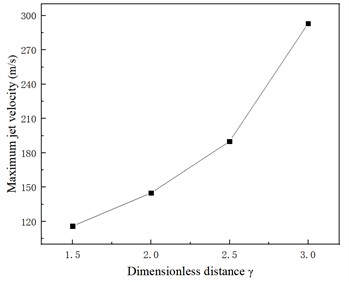
High pressure and high-speed shock waves and micro-jets will be generated at the moment of bubble collapse. Fig. 12 shows the trend of maximum jet velocity with dimensionless distance. With the increase of dimensionless distance, the constraint effect of the wall on the bubble is weakened, the pressure difference between the high-pressure region and the flow field at the far wall of the bubble increases, and the maximum velocity of the micro-jet generated by the bubble collapse also increases. Fig. 13 shows the velocity vector distribution of 1.5 and 3 space-time bubble at the moment of breakdown, respectively. The results show that there is a strong vortex flow at the bubble collapse center. When 1.5, the distance between the initial bubble center and the wall is 100 μm. During the collapse process, the cavitation bubble gradually approaches the wall surface, with the maximum velocity occurring at the point of cavitation bubble collapse, which is numerically 110 m/s, significantly less than the maximum velocity of 240 m/s at 3.
When the distance between the bubble and the wall is relatively close, the impact and shear effects of the micro-jet are reflected in the pit, and when the bubble is far away from the wall, the vertical impact takes the dominant position. To further prove this conclusion, the -direction deformation cloud map is extracted, as shown in Fig. 14. Compared with the -direction deformation on both sides of the pits at different dimensionless distances, when 1.5, the shear effect of the micro-jet is more intense. The deformation in the y direction is more prominent and its distribution range is wider.
Fig. 13Velocity vector diagram of different dimensionless distances
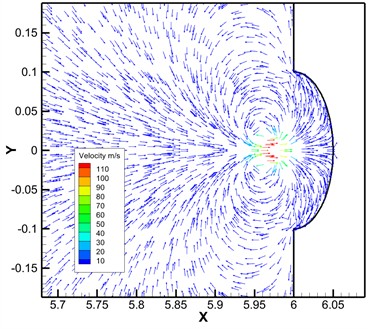
a)1.5
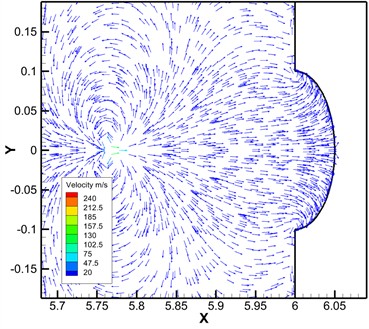
b)3
Fig. 14The Y-direction deformation cloud map at different dimensionless distances
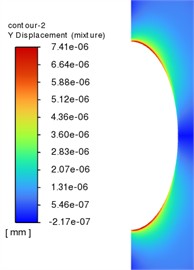
a)1.5
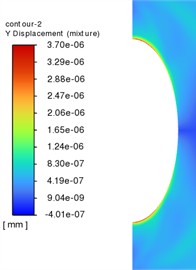
b)3
Fig. 15 shows the distribution of maximum wall stress at different dimensionless distances. The maximum stress appears in the center of the wall, and the maximum value of wall stress at different dimensionless distances decreases from 669 MPa to 257 MPa. This is because, with the increase of the dimensionless distance, the energy released at the moment of bubble collapse increases. However, due to the increase in the relative distance between the bubble and the wall, the bubble collapse pressure decreases rapidly in the propagation process, and the energy attenuation is serious when it reaches the wall. When the dimensionless distance is small, the value of bubble collapse energy is small, and the relative distance between the bubble and the wall is relatively close, so the energy loss is small. The effect of shock waves and micro-jets on the wall surface is more obvious.
The wall deformation distribution under different dimensionless distances is shown in Fig. 16. The greater the dimensionless distance, the slower the rate of numerical decay of the wall deformation variable. This is because the larger the relative distance between the bubble and the wall, the larger the bubble collapse action range. Based on the wall deformation of 0.005 μm, the center radius of titanium metal increases 1.9 times when 3 compared with 1.5.
Fig. 15Wall stress distribution at different dimensionless distances
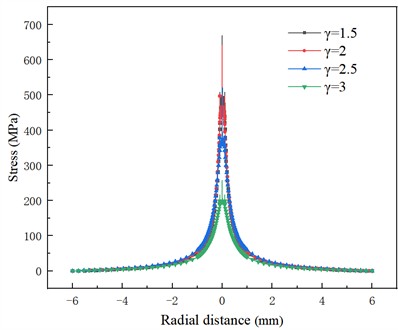
Fig. 16Wall deformation distribution at different dimensionless distances
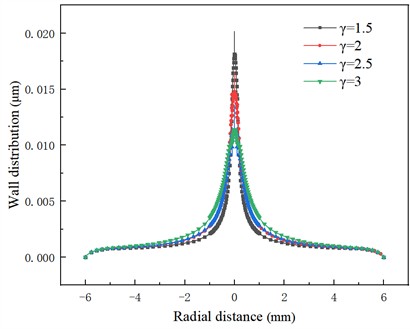
4. Analysis of the bubble collapse process under different solid field model parameters
4.1. Comparative analysis of the influence of pit depth on fluid-solid coupling characteristics
In this section, the effect of pit depth change on bubble collapse is studied under the same field parameters. The pit depth sizes are 25 μm, 50 μm, 75 μm, and 100 μm, respectively.
The flow field pressure distribution of different pit depths over time is shown in Fig. 17. Compared to the time at which the maximum collapse pressure appears, it is found that an increase in pit depth leads to a prolonged duration for complete bubble collapse. Furthermore, compared to the maximum flow field pressure value, the larger the pit depth is, the greater the energy released by the bubble during collapse. This is due to keeping the same flow field model parameters. The deeper the pit is, the more the liquid flow inside the pit is hindered by the wall. Consequently, this weakens the impact of bubble collapse, slows down the volume contraction rate, and increases the bubble collapse rate. As a result, there is an increase in accumulated energy and subsequent release of greater pressure waves during bubble collapse.
Fig. 17Distribution of flow field pressure at different pit depths over time
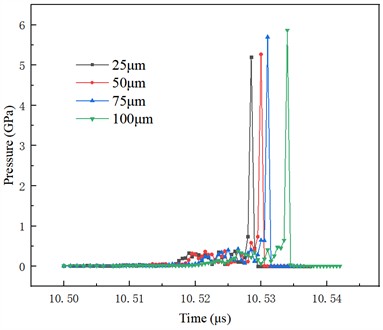
Fig. 18Change of stress at the center point of the pit with time
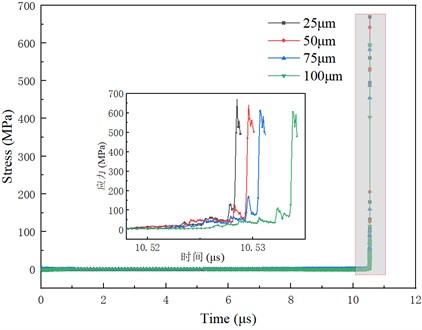
The pressure variation of the flow field directly affects the stress on the surface of titanium metal, and the surface stress distribution decayed from the center to both sides. The change of the stress at the center point of the pit with time is shown in Fig. 18. When the flow field pressure is low, there is no jet effect on the surface of titanium metal, and there is almost no stress distribution. When the bubble collapses, instantaneous high pressure is generated, and the stress at the center point of the pit increases rapidly. After the instantaneous high pressure, the surface stress of titanium metal also decreases due to the rapid decline of the flow field pressure. With the increase of pit depth, the maximum stress value decreases and the occurrence time of maximum stress lags behind.
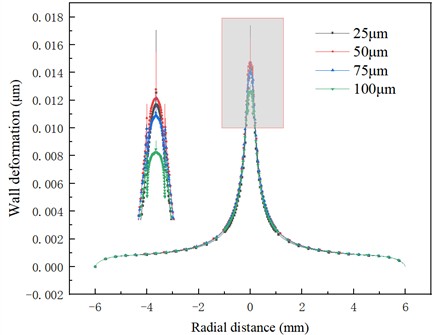
The distribution of wall deformation under different pit depths is shown in Fig. 19. The maximum deformation of the titanium wall is 0.0183 μm, 0.0165 μm, 0.0148 μm and 0.0133 μm, respectively. The wall deformation at the ring with the center radius of 1mm of titanium metal decreases by 83 % on average compared with the maximum deformation at the center. The further the distance from the center of titanium metal, the smaller the solid deformation. Comparing the curves of different working conditions, the change of pit depth has a great influence on the peak value of deformation but almost does not affect the overall distribution.
Fig. 19The distribution of wall deformation under different pit depths
4.2. Comparative analysis of the influence of pit radius on fluid-solid coupling characteristics
After water jet treatment, the surface of titanium metal exhibits a significant number of densely distributed pits. To investigate the impact of pit radii on bubble collapse, this section maintains a constant dimensionless distance of 2, bubble radius 100 μm, and pit depth 50 μm. The selected values for pit radii are 50 μm, 75 μm, 100 μm, and 125 μm.
Table 3Parameters of bubble collapse flow field under different pit radii
Pit radius (μm) | Maximum collapse pressure (GPa) | Maximum micro-jet velocity (m/s) | Time of bubble collapse time (μs) | Time of maximum collapse pressure (μs) |
50 | 6.09 | 148.95 | 10.5220 | 10.5532 |
75 | 5.89 | 146.82 | 10.5105 | 10.5377 |
100 | 5.27 | 145.21 | 10.5050 | 10.5295 |
125 | 5.15 | 140.02 | 10.4930 | 10.5196 |
The influence of pit radius on flow field characteristic parameters is shown in Table 3. From the data in the table, it can be seen that as the pit diameter increases, the curvature of the pit decreases, the fluid mobility is enhanced, the inhibitory effect on cavitation bubble collapse weakens, the collapse time is shortened, the cumulative energy is smaller, and therefore, the collapse pressure and micro-jet velocity decrease. By comparing the breakdown time of the bubble with the occurrence time of the maximum collapse pressure, when the bubble is compressed, the high-pressure area generally appears at the far wall end. With the further compression of the bubble volume, the accumulated energy increases. After the micro-jet breaks down the bubble wall, the accumulated high-pressure at the far wall end of the bubble is released, forming an instantaneous high-pressure and high-speed phenomenon. Therefore, the time when the maximum collapse pressure occurs lags behind the time when the bubble is broken down.
Table 4Solid field parameters of bubble collapse under different pit radii
Pit radius (μm) | Maximum wall deformation (μm) | Maximum wall stress (MPa) | Time of maximum deformation (μs) | Time of maximum stress (μs) |
50 | 0.0183 | 691 | 10.5535 | 10.5533 |
75 | 0.0167 | 684 | 10.5379 | 10.5378 |
100 | 0.0165 | 641 | 10.5298 | 10.5296 |
125 | 0.0152 | 628 | 10.5198 | 10.5197 |
The changes in solid field characteristics are shown in Table 4. With the increase of pit radius, the value of wall shape and wall stress decreases. According to the flow field parameter law, when the pit radius is 50 μm, the flow field collapse pressure and micro-jet velocity reach the maximum values, resulting in a strong shock wave and micro-jet effect on the wall, leading to increased deformation and stress. Comparing the characteristics of the flow field and the solid field, it is found that the shock wave and micro-jet generated during the bubble collapse will be transferred to the metal surface through the fluid medium within 2e-4μs, with energy reaching the wall and acting upon the solid domain. The solid reaches a maximum deformation between 1e-4μs and 3e-4 μs, and the deformation becomes stable after about 0.3 μs due to the elastic action of titanium metal.
Fig. 20Distribution of wall pressure at different moments
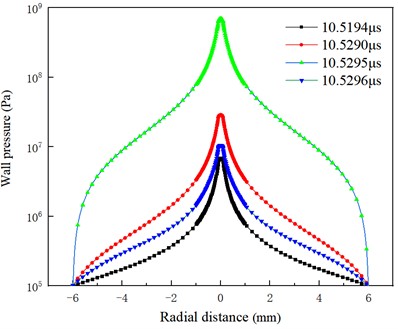
Fig. 21Distribution of wall deformation at different moments
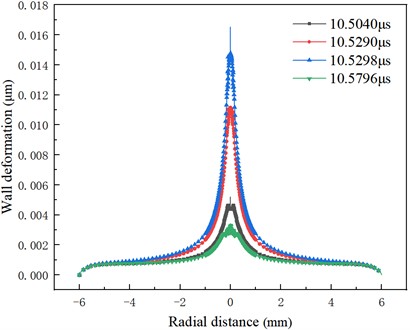
To further prove this phenomenon, the wall pressure distribution and wall deformation distribution at different times with pit radius 100 μm are extracted, as shown in Fig. 20 and Fig. 21. Before the moment of maximum bubble collapse pressure, energy gradually accumulated and wall pressure gradually increased. When 10.5295 μs, the transient high pressure appears in the process of bubble collapse, and the wall pressure also changes abruptly. After the instantaneous high pressure, the flow field pressure decreases rapidly, and the pressure acting on the wall decreases accordingly. With the increase of the wall pressure, the effect of the flow field on the solid is enhanced, and the wall deformation also presents a cumulative increasing trend. When 10.5298 μs, the maximum deformation occurs on the titanium surface, which lags behind the occurrence time of the maximum pressure.
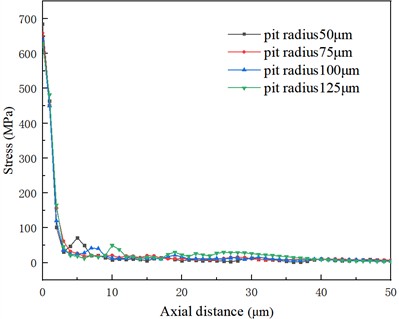
The variation trend of stress along -direction depth under different pit radii is shown in Fig. 22. According to the curve in the figure, the maximum stress appears on the surface of titanium metal. As the depth decreases below 5 μm, there is a rapid decline in stress from its peak value. When the depth exceeds 5 μm, it gradually exceeds the influence area of bubble collapse, and the cavitation effect disappears. In general, as the depth increases, there is an initial rapid decrease in stress followed by a gradual stabilization.
Fig. 22Stress distribution in X direction under different pit diameters
5. Conclusions
The surface of the implant after modification by cavitation water jet presents a porous honeycomb three-dimensional structure. In this paper, fluid-structure coupling numerical simulation of single bubble collapse on the curved surface wall is established to reveal the interaction law between the bubble collapse flow field and the titanium surface. Specific conclusions are as follows:
1) With the increase of bubble diameter, the bubble collapse time, maximum collapse pressure and micro-jet velocity also increase, and the stress concentration and deformation effect of metal surface become more obvious. When the bubble diameter fully develops to 180 μm, the collapse pressure reaches a high of 7.24 GPa, and the maximum stress generated on the titanium surface reaches 689 MPa. This value is 1.57 times larger than that of the bubble diameter of 60 μm. Furthermore, the deformation effect reaches 0.0288 μm, which is 83 % larger than that of the bubble diameter of 60 μm.
2) The distance of bubble collapse from the wall surface has a significant impact on the effect of cavitation water jet modification. When bubble collapses away from the wall surface, although the collapse time is shortened, the maximum collapse pressure and the micro-jet velocity increase, the action domain is wide, but the energy dissipation in the propagation process increases, the titanium metal deformation and the acting stress gradually decrease. When the dimensionless distance 3 is obtained, the surface deformation radius of titanium metal is 1.9 times larger than that of 1.5, and the process parameters can be reasonably set during the process of jet modification, so that the producing range and intensity of bubble collapse can be optimized.
3) Different models of curved wall surfaces are established to explore the influence of the pit morphology on the flow field characteristics of bubble collapse. It is found that the pits have an inhibitory effect on bubble collapse. With the further increase in the pit depth, the liquid flow inside the pits is more hindered by the wall surface, the fluid mobility weakens, the duration of cavitation collapse increases, and the maximum collapse pressure and micro-jet velocity in the flow field increase. With the increase in the pit diameter, the constraining effect of the wall on the bubble collapse weakens, and the duration of bubble collapse decreases.
4) The collapse of the 100 μm bubble diameter is mainly concentrated in the ring region of the titanium center with a radius of 1 mm. The maximum deformation occurs in the solid center, while the wall deformation decreases with the increase of distance. The change of stress coincides with the deformation. In the depth direction, the range of action is mainly concentrated in the range of 5 μm, and the stress value decreases rapidly along the -axis.
References
-
Z. Q. Zhao, “Research on Surface treatment of Titanium metal under submerged cavitation water jet,” (in Chinese), Dalian Maritime University, 2022.
-
H. Q. Wu, “Mechanism and experimental study of surface modification of medical titanium metal by cavitation water jet,” (in Chinese), Dalian Maritime University, 2023.
-
X. R. Cheng et al., “Application progress and prospective analysis of cavitation jet technology,” (in Chinese), Energy Chemical Industry, Vol. 39, No. 4, pp. 19–24, 2018.
-
G. L. Chahine, A. Kapahi, J.-K. Choi, and C.-T. Hsiao, “Modeling of surface cleaning by cavitation bubble dynamics and collapse,” Ultrasonics Sonochemistry, Vol. 29, pp. 528–549, Mar. 2016, https://doi.org/10.1016/j.ultsonch.2015.04.026
-
X. D. Ren et al., “Mechanical effect of laser-induced cavitation bubble of 2A02 alloy,” Optics and Laser Technology, Vol. 105, pp. 180–184, Sep. 2018, https://doi.org/10.1016/j.optlastec.2018.02.039
-
J. Hu et al., “Numerical and experimental investigations on the jet and shock wave dynamics during the cavitation bubble collapsing near spherical particles based on OpenFOAM,” Ultrasonics Sonochemistry, Vol. 99, p. 106576, Oct. 2023, https://doi.org/10.1016/j.ultsonch.2023.106576
-
D. S. Xia et al., “Numerical study of near-solid wall micron scale cavitation collapse,” (in Chinese), Tribology, Vol. 38, No. 6, pp. 711–720, 2018, https://doi.org/10.16078/j.tribology.2018082
-
Y. Liu and Y. Peng, “Study on the collapse process of cavitation bubbles near the concave wall by lattice Boltzmann method pseudo-potential model,” Energies, Vol. 13, No. 17, p. 4398, Aug. 2020, https://doi.org/10.3390/en13174398
-
F. J. Zhao, “Analysis of cavitation migration and collapse characteristics induced by cavitation of Self-excited Oscillating jet,” (in Chinese), Jiangsu University, 2022.
-
D. Kim and D. Kim, “Underwater bubble collapse on a ridge-patterned structure,” Physics of Fluids, Vol. 32, No. 5, May 2020, https://doi.org/10.1063/5.0006372
-
J. N. Zhao, Z. W. Yu, and T. Chen, “Numerical study on the dynamic behavior of cavitation near curved edges,” (in Chinese), Hydrodynamics Research and Progress A, Vol. 38, No. 6, pp. 819–826, 2023, https://doi.org/10.16076/j.cnki.cjhd.2023.06.001
-
K. Okita, Y. Miyamoto, T. Furukawa, and S. Takagi, “Numerical study on stress in a solid wall caused by the collapse of a cavitation bubble cloud in hydraulic fluid,” International Journal of Multiphase Flow, Vol. 150, p. 103965, May 2022, https://doi.org/10.1016/j.ijmultiphaseflow.2021.103965
-
H. J. Sagar and O. El Moctar, “Dynamics of a cavitation bubble near a solid surface and the induced damage,” Journal of Fluids and Structures, Vol. 92, p. 102799, Jan. 2020, https://doi.org/10.1016/j.jfluidstructs.2019.102799
-
L. Wang, C. Su, X. Jia, Z. Guo, and Z. Zou, “Experiment and simulation study of the laser-induced cavitation bubble technique for forming a microgroove in aluminum foil,” Micromachines, Vol. 14, No. 11, p. 2106, Nov. 2023, https://doi.org/10.3390/mi14112106
-
F. Reuter, C. Deiter, and C.-D. Ohl, “Cavitation erosion by shockwave self-focusing of a single bubble,” Ultrasonics Sonochemistry, Vol. 90, p. 106131, Nov. 2022, https://doi.org/10.1016/j.ultsonch.2022.106131
-
R. Firly, K. Inaba, F. Triawan, K. Kishimoto, and H. Nakamoto, “Numerical study of impact phenomena due to cavitation bubble collapse on metals and polymers,” European Journal of Mechanics – B/Fluids, Vol. 101, pp. 257–272, Sep. 2023, https://doi.org/10.1016/j.euromechflu.2023.06.004
-
S. Sahoo, S. P. Parida, and P. C. Jena, “Dynamic response of a laminated hybrid composite cantilever beam with multiple cracks and moving mass,” Structural Engineering and Mechanics, Vol. 87, No. 6, pp. 529–540, Sep. 2023, https://doi.org/10.12989/sem.2023.87.6.529
-
S. S. Pan and X. X. Peng, Physical Mechanism of Cavitation. (in Chinese), Beijing: National Defense Industry Press, 2013.
-
B. B. Rout, S. P. Parida, and R. R. Dash, “Dynamic analysis of multi-cracked hollow rectangular beams,” in Lecture Notes in Mechanical Engineering, pp. 369–380, May 2024, https://doi.org/10.1007/978-981-97-1080-5_30
-
S. P. Parida, P. C. Jena, M. Swain, and K. P. Shadangi, “Fabrication of geopolymer composites using egg-shell and fly-ash: Comparison between the strength and stability, physio-chemical and mechanical properties,” Process Safety and Environmental Protection, Vol. 187, pp. 1140–1149, Jul. 2024, https://doi.org/10.1016/j.psep.2024.05.020
-
A. Mohanty, S. P. Parida, and R. R. Dash, “Modal response of sandwich plate having carbon-epoxy faceplate with different honeycomb core material and geometry considerations,” International Journal on Interactive Design and Manufacturing (IJIDeM), Vol. 18, No. 6, pp. 4223–4232, Jul. 2024, https://doi.org/10.1007/s12008-024-01975-z
About this article
This work was supported by the National Natural Science Foundation of China (51075048.51875586), Natural Science Foundation of Heilongjiang Province of China (Key Program, ZD2021E005), and Opening Project of the Key Laboratory of Advanced Manufacturing and Intelligent Technology (Ministry of Education), Harbin University of Science and Technology (KFKT202301).
The datasets generated during and/or analyzed during the current study are available from the corresponding author on reasonable request.
Wenhao Dai: conceptualization, formal analysis, investigation, methodology, visualization, writing-original draft preparation. Wenqi Ma: supervision, writing-review and editing, resources. Hongyi Sun: supervision, funding acquisition. Lianxu Zhang: investigation, supervision, and validation.
The authors declare that they have no conflict of interest.
