Abstract
The application of cavitation water jet technology to modify medical implant surfaces facilitates the formation of distinctive microporous structures, thereby enhancing the contact area between the implant and alveolar bone, and improving osseointegration. Therefore, the microstructure characteristics of the modified implant are one of the important evaluation indicators of the modification effect. This paper proposes a processing method for the identification and statistical analysis of surface micro-morphology images. The method incorporates techniques such as image enhancement, image segmentation, morphological image processing methods, and pixel matrix operations, enabling automated quantification of pit counts, the relative positions of the pits, and other topographic characteristics of the material surface. Simultaneously, the microstructure of each pit is spatially fitted and reconstructed to standardize measurement benchmarks for pit diameter and depth characteristics. This facilitates in-depth multi-dimensional analysis of material surface characteristic information and provides foundational support for further exploration of cavitation jet modification technology. In the study, the modification effect of processing time on the surface morphology of titanium metal was used as an application case. A surface morphology feature information database was established under different processing times, and statistical analysis was conducted on proportion, structural distribution, and other characteristics in the focus areas. The results show that the diameter and proportion distribution of the pits produced by cavitation jet modification tend to be stable when the jet pressure and standoff distance remain constant, while the depth of the pit increases with the increasing processing time.
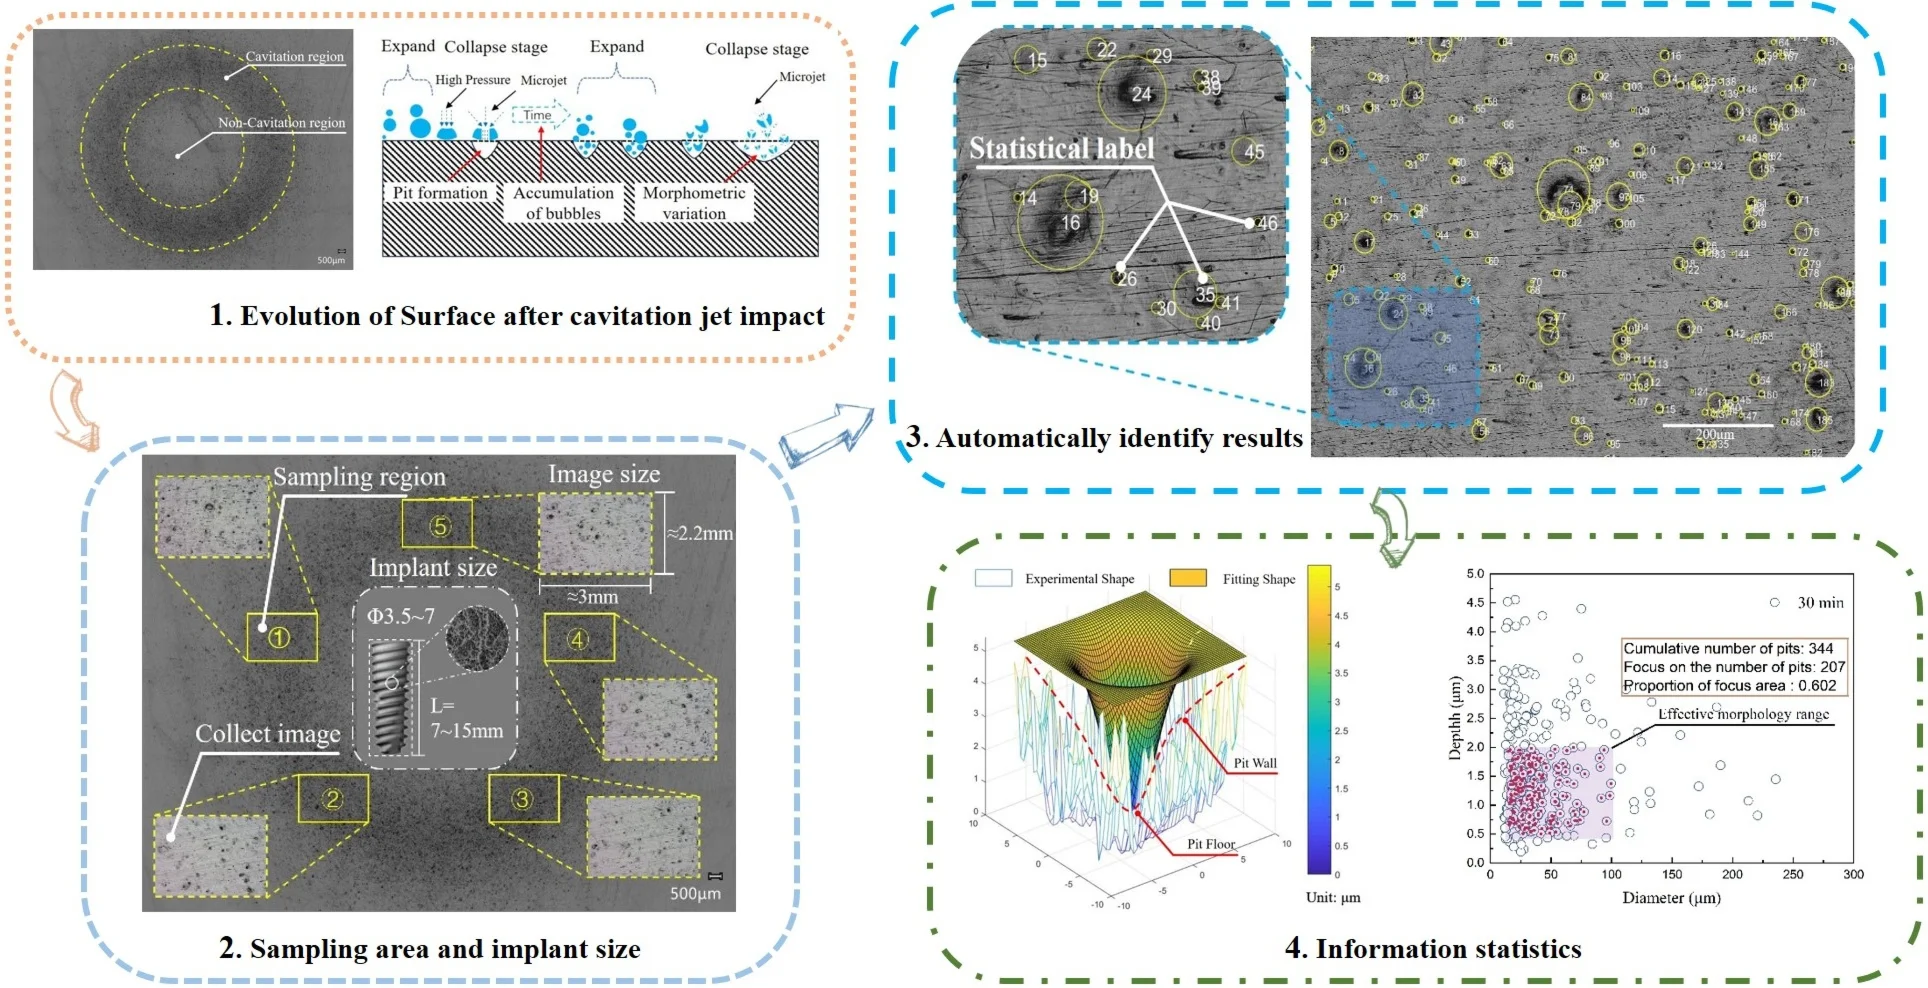
1. Introduction
Titanium, known for its exceptional biocompatibility, is widely used in dental implantology. The surface morphology of titanium directly affects the activity of biological cells and the initial stability of implants [1, 2].
Currently, in clinical practice, the commonly used methods for modifying implant surfaces are sandblasting and acid etching, which may leave harmful particles on the surface, posing a potential biological safety hazard [3]. Our research group proposes a new cavitation water jet technology, for surface modification of titanium metal, which offers the benefits of being environmentally friendly, non-hazardous, and hygienic [4]. Utilizing the micro-jets and shock waves [5] generated during bubble collapse, rich three-dimensional microstructures can be formed on the implant surface, thereby improving osseointegration. Comprehensive investigations have been undertaken both domestically and internationally regarding the morphological characteristics of metallic materials following surface modification. Takakuwa [6]estimated the depth of the modification layer induced by cavitation on the surface of 316L stainless steel and found that the thickness of the sample had a significant impact on the depth estimation. Yao [7] explored the effect of process parameters on the surface integrity of titanium alloy, comparing the surface height difference before and after treatment, and found that plastic deformation increased with jet pressure. Bai [8] extracted the surface plastic deformation of the aluminum alloy after ultrasonic cavitation shot peening to assess the effect of processing time. Images showed that pits were concentrated in the annular and central areas, and as the processing time increased from 60 s to 120 s, the depth increased from 20 μm to 160 μm, with a significant impact. Gu [9] used confocal microscopy to observe the surface morphology of HT200 samples after laser cavitation impact and explored the effects of laser energy and defocus on surface morphology. The results indicate that in the absence of copper coverage, the optimal roughness is achieved with a laser energy of 200 mj and a defocus of 1 mm. Zhang [10] studied the combined process of laser peening and cavitation for aluminum alloy and extracted the surface morphology after modification by a confocal microscope. It was found that the shot peening depth increased with the increase of laser energy. Kumagai [11] used laser confocal microscopy to quantitatively analyze the stainless steel surface after cavitation shot peening, shot peening, and laser peening, and extracted the height profile of the specimen in the horizontal direction. The curves proved that the height profiles generated by different shot peening techniques had a certain periodicity, but the sampling curves were overall rough, and the structural feature analysis was lacking.
To acquire more comprehensive statistical characteristics of the image, Xu [12] used the optimal entropy threshold method to process and visualize pit images on wire surfaces, accurately characterizing individual pits and simultaneously quantifying their geometric and morphological parameters. Soleimani [13] corrected uneven lighting in images and used features such as quantified wear and micro-pitting as subjective evaluation criteria for severity. Yu [14] characterized the metal pitting effect using binary image processing technology.
In summary, the current analysis of the material surface morphology primarily concentrates on extracting extreme morphology values and geometric analysis of a single pit, which limits batch analysis of the overall surface, making it difficult to obtain accurate statistical patterns, resulting in insufficient comprehensiveness. Therefore, this paper proposes a method for surface morphology identification based on morphological digital image processing, establishes a management information database for pit morphology characteristics, and enables automatic identification of micromorphological characteristics such as pit diameter, pit depth size, and distribution forms. This approach facilitates comprehensive, batch, and efficient extraction of material surface morphology characteristics while elucidating their variation patterns and statistical characteristics.
2. Experiment and data acquisition
The experimental system is illustrated in Fig. 1, mainly comprised of a pump source system, an actuation system, and a data acquisition platform. The pump source system allows for automatic regulation of pressure from 0 to 50 MPa. The actuation system utilizes a three-degree-of-freedom movable platform to drive the cavitation jet nozzle for impact, with programmable automatic control over its motion trajectory. The cavitation nozzle, optimized independently by the research group [15], is capable of focusing more cavitation energy. Situated in a submerged environment, the entire nozzle enhances jet impact capability, thus improving cavitation jet impact efficiency.
Fig. 2 illustrates the surface shape of titanium metal after water jet cavitation modification. The results indicate that the surface morphology of titanium metal modified by cavitation water jets is mainly composed of pits formed by jet impact and cutter marks. Currently, extraction methods are capable of capturing the overall trend of topographical variations in the sample area; however, the quantitative extraction of modified features, such as pit count, spatial coordinates, and structural dimensions, remains dependent on manual intervention. The existing analysis method can only obtain roughness and extreme height information for local morphology, and specific size extraction of pits is limited to single-direction measurements, as shown in A and B in Fig. 2(b), where the curve represents the profile along the pit extraction direction, and characteristics such as diameter and depth require manual selection of different calibration points on the profile. Therefore, the current geometric data pertaining to pits exhibits characteristics such as randomness, limited reading efficiency, and poor reliability.
Fig. 1Cavitation jet test system
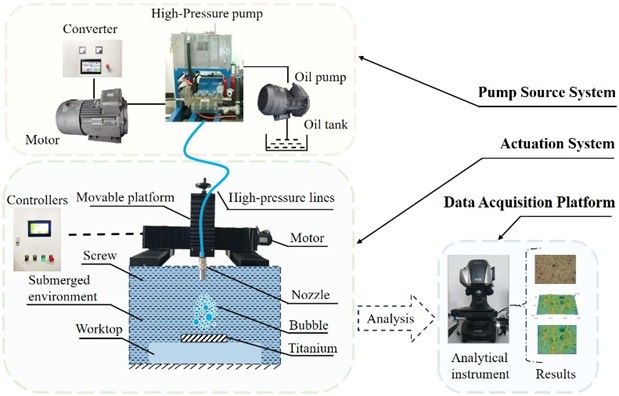
Fig. 2Surface topography and information extraction
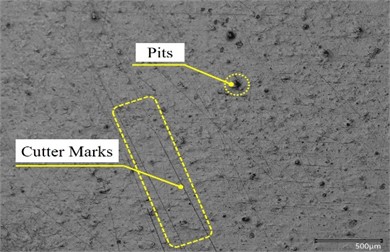
a) Surface topography
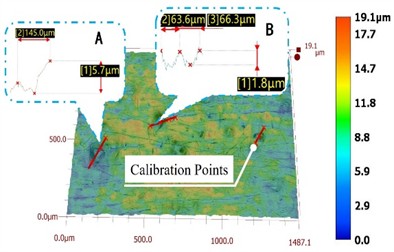
b) Information extraction
3. Identification of pit diameter
3.1. Identification method of pit diameter
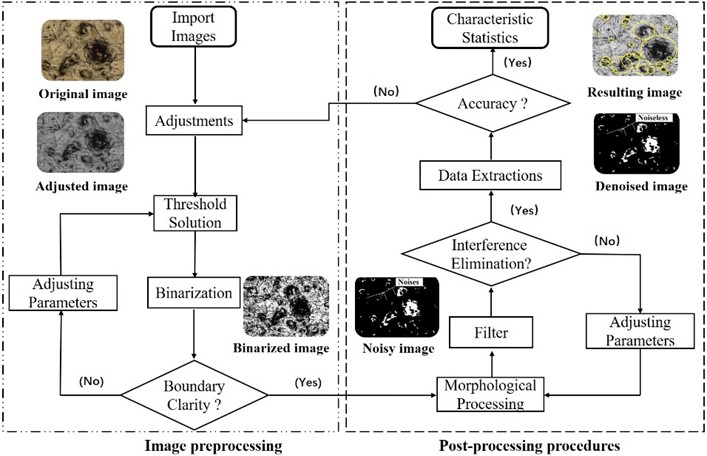
Diameter is an important geometric parameter that characterizes the microstructure of pits. This paper develops a pit diameter identification program based on image enhancement, image segmentation, morphological image processing methods, and pixel matrix operations. It can automatically process plenty of pit diameter information and perform statistical induction. The identification procedure is shown in Fig. 3, mainly including image preprocessing and post-processing procedures.
Firstly, the original microscopic morphology image is imported into the developed identification system. Subsequently, the image contrast is adjusted, and several processes, including illumination equalization and image segmentation, are performed to transform the morphological image features into digital matrix information.
Secondly, the maximum inter-class variance method is used to process the digital information containing morphological features. The image is binarized to enhance the precision of edge detection by applying suitable thresholds. If the margins of the binarized pit exhibit clarity and definite limits, subsequent post-processing procedures are executed. Conversely, if the borders display blurriness, it becomes necessary to reassess the threshold.
Finally, to avoid or reduce the pixel noise and other interference that usually accompany the transmission and parsing process of images, post-processing operations are performed on the pre-processed images. The pre-processed image undergoes morphological image opening and closing processing using selected structural elements, and filtering functions are used to filter out interference and noise. The elimination of defects and cutter marks resulting from sample wear and processing is crucial. The recognition of target pits can only proceed once the cutter marks and original defects have been eliminated completely without any additional impact on results. Adjustments in filtering parameters may be required until all cutter marks and original defects no longer affect accuracy before outputting final identification results and statistical results.
Fig. 3Pit diameter identification procedure
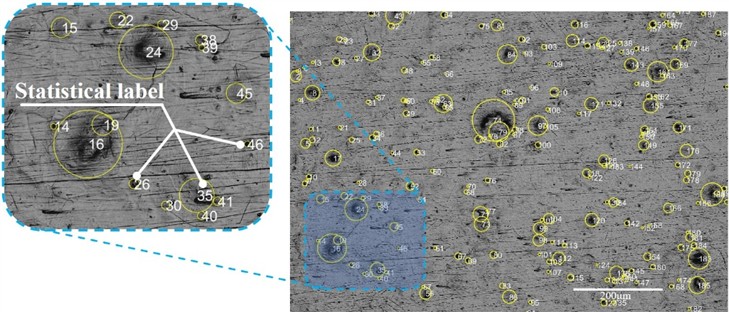
As shown in Fig. 4, the results of automatic pit identification are presented, with numbers such as 15, 22, and 24 representing the statistical labels assigned to the pits. Based on the pit label, feature parameters such as the diameter and spatial position of the selected pit can be rapidly obtained. Additionally, the system automatically calculates all characteristics of the discovered pits on the surface of the metal, including the average diameter as depicted in Eq. (1):
where is the average diameter, is the total number of valid pits, is the total number of sampled images, is the pit label serial number, and is the image serial number.
During the diameter recognition process, multiple sets of reference images are selected for each group of samples to extract feature data. The system retrieves the borders of the pits using a uniform algorithm, including scanning the digital image matrix row by row, as shown in Eq. (2). If the detected region point is , then its neighborhood 1 to 8 matrix points are checked. If are all true for , it is determined that the detection point is interior, and no edge marking is done. Otherwise, it is marked as an edge:
where is the image digital matrix, , , , is the non-neighborhood points, is the detected region point, and is the neighboring point of the detected region, where .
Fig. 4Pits automatically identify results
3.2. Pit diameter distribution and characteristic statistics
Cavitation jet processing time is an important process parameter that affects the effectiveness of cavitation jet impact. The surface morphology of titanium metal varies greatly under different processing times. Therefore, this paper takes titanium metal surface images under different processing times (10 minutes, 20 minutes, 30 minutes) as identification and analysis cases to illustrate the effect of identification and characteristic statistics.
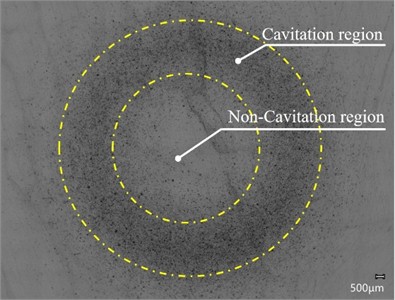
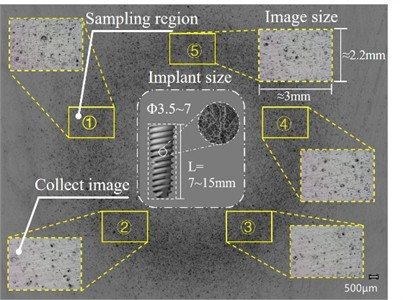
Fig. 5Modified samples and sampling area
a) Surface after cavitation water jet impact
b) Sampling area and implant size
As shown in Fig. 5, the overall shape of the sample and the sampling area after the cavitation water jet impact. Fig. 5(a) shows that the surface of the sample after the cavitation water jet impact consists of cavitation and non-cavitation regions, in which the cavitation region is a circular state, the formation of pits is more dense; while the non-cavitation region of the pits is more sparse to the point that some regions have none the pits. In the identification statistics, the cavitation regions labeled in Fig. 5(b) 1-5 were collected as sampling regions to evaluate the micro-morphological characteristics of the modified material surface comprehensively.
Fig. 6Evolution of cavitation pit diameter
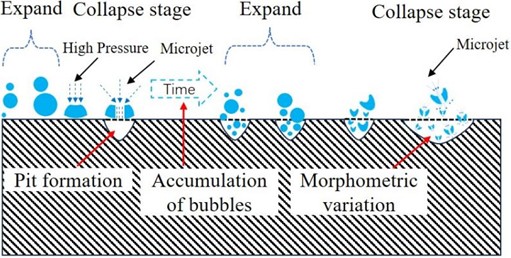
Fig. 7Pit diameter characteristic statistics at different processing times
a) Processing time 10 min
b) Processing time 20 min
c) Processing time 30 min
d) Diameter distribution within the highest proportion
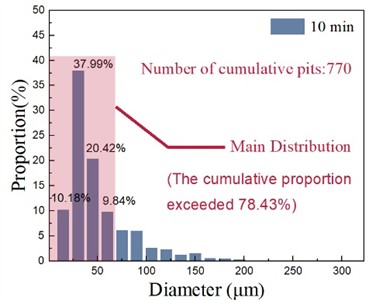
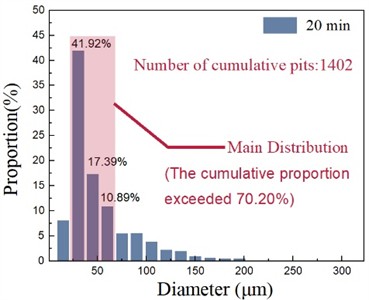
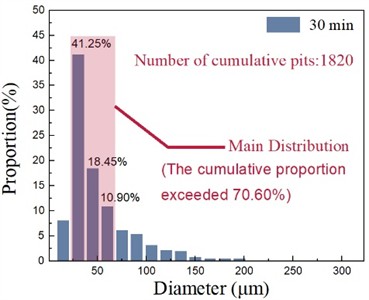
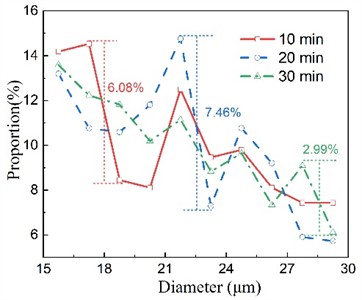
As shown in Fig. 6, the cavitation pits formed on the surface of titanium metal are generated by the cumulative impact of frequent and dense cavitation, and the formed pits evolve into large diameter pits through continuous accumulation of high pressure and microjet impact. The statistical characteristics of the diameter distribution of cavitation pits under different processing times are shown in Fig. 7. The analysis of the statistical results shows that under the condition of constant cavitation jet pressure and standoff distance, the impact force of the cavitation jet on the material surface is relatively stable. Therefore, the main distribution of pit diameters on the surface of titanium metal is relatively stable, with a cumulative proportion of over 70 % in the diameter range of 0-75 μm. When the processing time is 10 minutes, the number of pits formed is relatively small (770); The proportion of diameters ranging from 15 to 30 μm is 37.99 %; As the processing time extended to 30 minutes, the cumulative number of collapsed bubbles in the same area increased significantly, resulting in a rise in the number of pits to 1820 – more than double that previously recorded. The maximum diameter occupies an interval of 15-30 μm, and the proportion increases to 41.25 %, when the density of pits on the surface of the samples is higher, which is more conducive to cell proliferation and differentiation.
Extract the range of pit diameter distribution with the highest proportion (15-30 μm) for further analysis, and obtain statistical characteristics, as shown in Fig. 7(d). The analysis results show that the larger the diameter of the pit, the smaller its proportion. As shown in Fig. 6, large-sized pits require continuous accumulation of bubble collapse impacts on the original pit structure. The formation of cavitation pits with larger diameters is more challenging, resulting in a lower number and proportion of such pits. Furthermore, due to the short processing time, the number of accumulated collapsed bubbles is relatively limited, so the variation law of the pit structure formed on the surface of titanium metal exhibits randomness; As processing time increases, so does the number of accumulated collapsed bubbles at identical locations and their impact frequency, leading to a more stable trend in surface structure formation. When the processing time is set as 10 minutes and 20 minutes, the proportion of pits with diameters ranging from 18-24 μm fluctuates greatly, reaching a maximum value of 7.46 %. However, when processing time extends to 30 minutes, this fluctuation decreases to approximately 3 %.
4. Identification of pit depth
4.1. Identification method of pit depth
Depth is another important geometric parameter that characterizes the microstructure of pits. Therefore, it is necessary to systematically extract and analyze the depth of the pits formed on the modified surface.
4.1.1. Cut-off depth
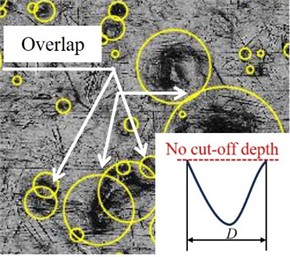
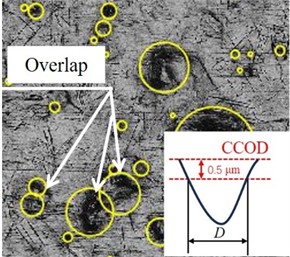
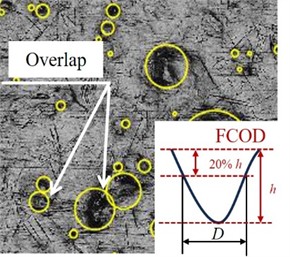
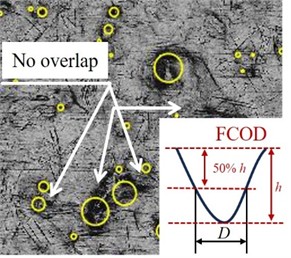
The overlap and coverage of different pits can introduce errors in in-depth identification. To avoid calculation errors caused by overlap, the cut-off depth method is used to improve depth identification accuracy. Constant cut-off depth (CCOD) and fractional cut-off depth (FCOD) are two commonly used methods for determining the appropriate depth [16]. As shown in Fig. 8, the influence of different cut-off methods on pit boundaries is illustrated. Fig. 8(a) depicts the pit boundary without using the cut-off depth analysis method; Fig. 8(b) shows the pit boundary obtained using a constant cut-off depth of 0.5 μm. Fig. 8(c) and Fig. 8(d), respectively, display the morphology of pit boundaries under 20 % and 50 % fractional truncation depth.
Through comparative analysis, it is evident that without employing the cut-off depth method, the overlapping phenomenon of pits is pronounced, resulting in significant interference of depth information extraction by the edges of other pits. However, when using a constant cut-off depth of 0.5 μm, the overlapping phenomenon of pits is somewhat mitigated, with noticeable separation effects for small pit diameters, while the overlap of large-sized pits still persists, making it difficult to determine an appropriate truncation depth threshold.
When using fractional cut-off depth, as the proportion of cut-off depth increases, the overlapping phenomenon of identifying pits is completely eliminated. Large-diameter pit features become prominent, while the main geometric characteristics of small-sized pits are retained. As shown in Fig. 8(d), when the cut-off depth fraction reaches 50 %, the geometric morphology characteristics of pits become clear, reducing estimation errors. Therefore, this study adopts a truncation depth threshold of 50 % cut-off fraction to improve the accuracy of subsequent depth identification.
Fig. 8Identification results of pits under different cut-off depths
a) No cut-off depth
b) CCOD: 0.5 μm
c) FCOD: 20 %
d) FCOD: 50 %
4.1.2. Pit depth fitting method
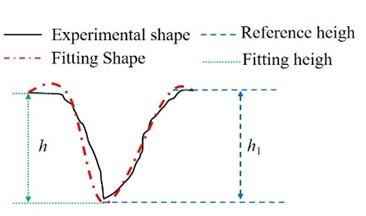
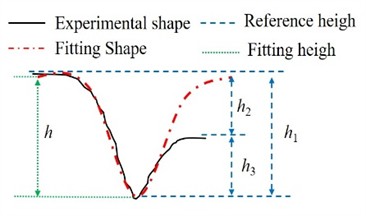
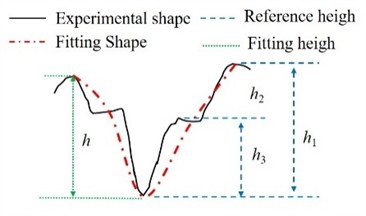
After being processed with a cavitation jet, the surface of titanium metal has diverse pit morphologies. According to the analysis of experimental results, these pit morphologies can be categorized into four primary forms, as illustrated in Fig. 9. Due to the irregularity and complexity of the pit geometry and the lack of a unified standard for the reference height, the pit depth determined by different scholars can be any value of , , or in Fig. 9, so the judgment of the pit depth is very ambiguous. In this paper, for the Gaussian characteristics commonly found in experimental erosion pits [17], the geometric fitting method is used to fit the pits, and the morphology is obtained as shown by the dotted line in Fig. 9, and the depth of the pits is uniformly shown as at this time.
The important geometric factors for pitting pits are depth and radius, respectively, and their geometric expressions can be represented by the equation:
where is the pit depth, is the pit depth eigenvalue, is the pit width eigenvalue, and is the radius of the pit taking the value of the domain.
The analysis of cut-off depth reveals that the optimal accuracy for pit feature recognition is achieved at a fractional cut-off depth of 50 %. This value corresponds to the pit depth, which can be mathematically represented as:
Fig. 9Experimentally extracted pit shapes
a) Standard pit
b) Sloping pit
c) Ladder pit
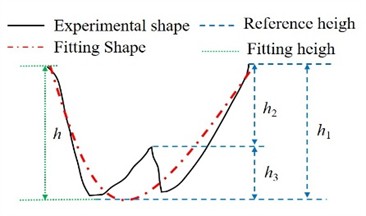
d) Valley pit
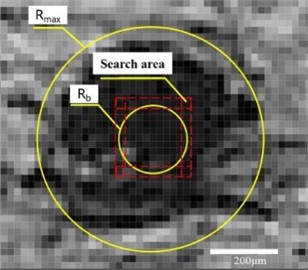
Fig. 10Cut-off plane brightness search diagram
From the boundary conditions:
During the experiment, the initial plane position of the pit could not be accurately obtained, i.e., the condition is the ideal case, as shown in Fig. 9. The image information can be seen that Unit 8 type RGB image contains brightness information divided into 0-255 integer levels, therefore, this thesis makes the following assumptions about the initial condition:
where is the geometric radius of the pit, is the depth of the pit, is the brightness difference between the bottom surface of the pit and the plane where is located, and is a positive integer.
After resolving the width feature of the pit, the radius feature at any depth of the pit can be solved by Eq. (3). Fig. 10 shows the plane brightness search algorithm at 50 % of the depth of the pit, and is the radius size to be solved, using the exploration algorithm to homogenize the brightness of the image near the range of , and at the same time capture the brightness information of the deepest part of the pit. During the algorithm searching process if covers a range beyond the boundary, the system will determine the pit as a residual pit due to the lack of information, and the algorithm will not be analyzed anymore.
4.2. Pit depth distribution and characteristic statistics
Based on the depth identification method, this paper comprehensively measured a large number of pits and extracted the distribution rules of pit depth on the surface of titanium metal at different times, as shown in Fig. 11. At the same time, further statistics on pits with a proportion of more than 10 %, as shown in Fig. 11(a-c), show that when the processing time is long, accumulated air bubbles will continue to collapse on the surface of the formed pits. On the basis of the original pit depth, secondary or multiple blasting impacts will be carried out, and the overall pit depth on the surface will expand to varying degrees in the depth direction. In addition, with time enhancement, the distribution of pits at different depth scales becomes more uniform. Under a processing time of 10 minutes, pits around 0.5-1 μm account for a higher proportion, all greater than 15 %; When the processing time is 30 minutes, the depth distribution gradually expands from 1-2 μm to 2-3 μm. At this time, although the distribution proportion with a proportion of over 10 % is still around 1μm, the cumulative proportion has sharply decreased from 71.43 % to 50.17 %, indicating that some shallow pits have already transformed into deep pits. As shown in Fig. 11(d), both the maximum and average depths of pits increase by approximately 30 % with each additional 10 minutes of processing time, further indicating that the formation of pits is the cumulative result of multiple cavitation failures.
Fig. 11Pit depth characteristic statistics under different processing times
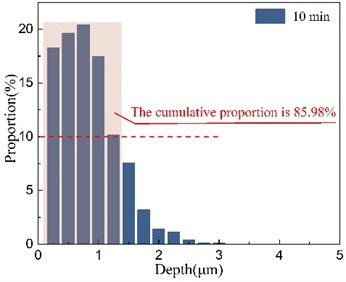
a) Processing time 10 min
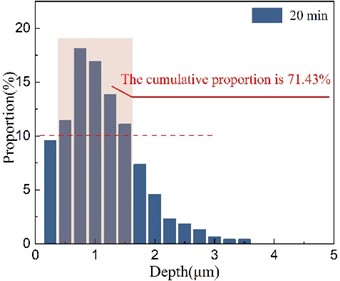
b) Processing time 20 min
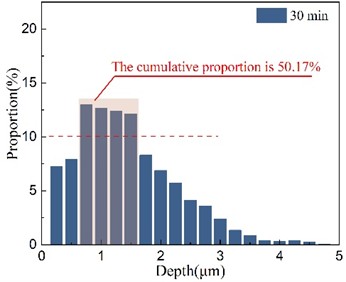
c) Processing time 30 min
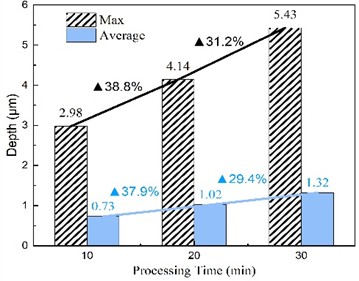
d) Maximum depth and average depth variation
5. Spatial pits surface topography fitting and information statistics
The geometric shape of the pit space is closely related to the surface modification effect of titanium metal. Although single characteristic parameters such as pit depth and pit diameter can characterize the changes in pit morphology in the plane or depth direction, there is a lack of comprehensive evaluation of the geometric shape of the pit space. Therefore, a pit feature information management library was established using MATLAB to extract and reconstruct the surface morphology information for each pit, and the morphology was modeled and fitted using Gaussian functions. Fig. 12 shows the fitting results for an individual pit morphology, demonstrating that the fitted spatial representation can optimally capture complex and varied surface morphological information. At the same time, it provides the basis for multi-dimensional observation and measurement of pit feature information.
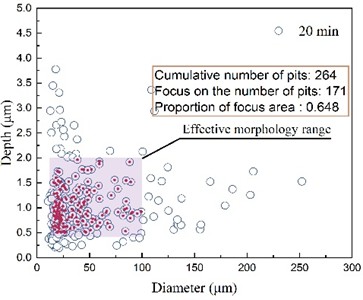
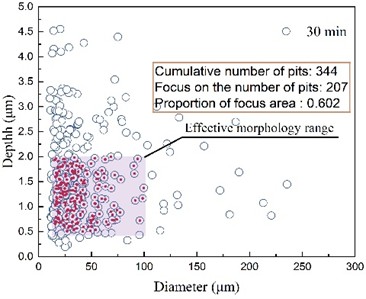
On the basis of spatial fitting, further identification and statistics of the spatial distribution pattern of morphology under different processing times were conducted. Only sampling region 1 shown in Fig. 5(b) was used to explore the microstructure distribution and refine the microscopic features. This sampling area has the same structural scale as the implant surface used in clinical applications. The pit morphology under different processing times is shown in Fig. 13. The analysis shows that the surface microstructure of titanium metal is distributed in different ranges, and the longer the processing time, the greater the range of surface microstructure distribution. When the processing time is 10 minutes, the diameter of the pits is mainly distributed between 0 and 100 μm, and the depth is mainly distributed between 0 and 2 μm; When the processing time was 30 minutes, the depth reached over 4 μm and the diameter had expanded to 200 μm.
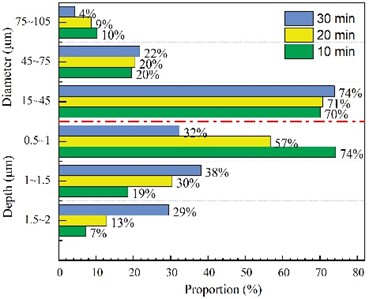
By comparing and analyzing the statistical results of the variation of characteristics, it is found that diameters (15-100 μm) and depths (0.5-2 μm) account for a larger proportion, representing the surface morphology range that is the primary focus of feature statistics and analysis. Therefore, the morphology range that satisfies these conditions is defined as the focus area, as shown in Fig. 13. Within the area, the number of pits increased with the increase of processing time, but the proportion (Focus on the number of pits / Cumulative number of pits) gradually stabilized.
The statistical results of characteristics of specific topography regions are shown in Fig. 13(d). The analysis results show that the processing time has little effect on the variation of pit diameter distribution, with proportions remaining similar. In contrast, the effect on the depth distribution of pits is more obvious. The proportion of pits at each stage remains consistently around 30 %, under 30 min processing time, while for processing times of 10 minutes, pits within the range of 0.5 to 1 μm exhibit a prominent proportion exceeding 70 %.
Fig. 12Shape-fitting effect of pits
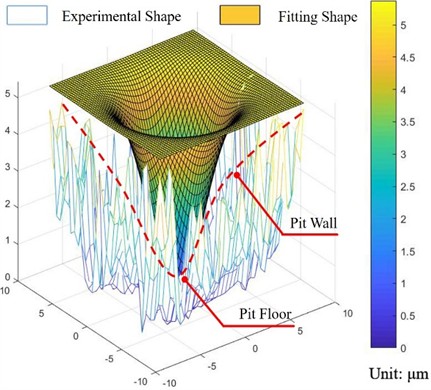
Fig. 13The change of pit morphology under different processing times
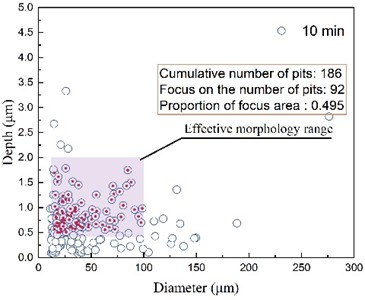
a) Processing time 10 min
b) Processing time 20 min
c) Processing time 30 min
d) Topography distribution of focus area
6. Conclusions
This article proposes an image recognition method that can accurately identify the surface morphology characteristics of materials, as well as rapidly collect and automatically analyze the spatial morphology characteristics and distribution patterns of pits. The specific conclusions are outlined as follows:
1) The proposed image recognition method can automatically label the surface micromorphology pits modified by cavitation water jet and perform statistical analysis on all pits to obtain the total number, average diameter, and average depth of all pits. At the same time, it can automatically locate and label each pit to obtain its features such as spatial relative position, relative distance between pits, pit radius, and pit depth.
2) The proposed method for morphology recognition and feature statistics unifies the evaluation criteria for pit diameter and depth of the measured pits, effectively minimizing human interference and randomness.
3) The proposed morphology recognition and feature statistics method has established a comprehensive feature information management database for pits, which can quickly screen pits in key areas of concern and calculate their density; At the same time, the proportion distribution of micromorphology within the region of interest can be refined, achieving multi-level analysis of surface morphology feature information.
4) In the study, the statistical analysis of surface pit morphology characteristics under varying cavitation water jet treatment times serves as a case application. The analysis results showed that when the jet pressure and action distance remain constant, the distribution of pit diameters tends to stabilize, and the diameter range with a cumulative proportion of over 70 % is located between 0-75 μm; As the processing time increases, shallow pits gradually transform into deep pits, and the depth distribution gradually expands from 1-2 μm to 2-3 μm; For the key areas of concern with similar diameter composition ratios, the depth has the most uniform proportion of about 30 % under a processing time of 30 minutes.
References
-
M. Qasim, D. S. Chae, and N. Y. Lee, “Advancements and frontiers in nano-based 3D and 4D scaffolds for bone and cartilage tissue engineering,” International Journal of Nanomedicine, Vol. 14, pp. 4333–4351, Jun. 2019, https://doi.org/10.2147/ijn.s209431
-
J. Cui, L. Xia, K. Lin, and X. Wang, “In situconstruction of a nano-structured akermanite coating for promoting bone formation and osseointegration of Ti-6Al-4V implants in a rabbit osteoporosis model,” Journal of Materials Chemistry B, Vol. 9, No. 46, pp. 9505–9513, Dec. 2021, https://doi.org/10.1039/d1tb01917a
-
X. Han et al., “Surface modification techniques of titanium and titanium alloys for biomedical orthopaedics applications: A review,” Colloids and Surfaces B: Biointerfaces, Vol. 227, p. 113339, Jul. 2023, https://doi.org/10.1016/j.colsurfb.2023.113339
-
Q. Zhao, “Research on Surface Treatment of Titanium Metal by Submerged Cavitation Water Jet,” (in Chinese), Dalian Maritime University, 2022.
-
W. Dai, W. Ma, H. Wu, and H. Sun, “Numerical simulation and experimental research of cavitation water jet impacting titanium metal,” in International Joint Conference on Civil and Marine Engineering (JCCME 2023), pp. 135–140, Jan. 2023, https://doi.org/10.1049/icp.2024.0174
-
O. Takakuwa, M. Nishikawa, and H. Soyama, “Estimation of the depth of surface modification layer induced by cavitation peening,” Journal of Materials Processing Technology, Vol. 212, No. 8, pp. 1716–1722, Aug. 2012, https://doi.org/10.1016/j.jmatprotec.2012.03.010
-
S. Yao et al., “Cavitation abrasive integrated waterjet peening process and the effect of process parameters on the surface integrity of TA19 titanium alloy,” Surface and Coatings Technology, Vol. 440, p. 128477, Jun. 2022, https://doi.org/10.1016/j.surfcoat.2022.128477
-
F. Bai, K.-A. Saalbach, L. Wang, X. Wang, and J. Twiefel, “Impact of time on ultrasonic cavitation peening via detection of surface plastic deformation,” Ultrasonics, Vol. 84, pp. 350–355, Mar. 2018, https://doi.org/10.1016/j.ultras.2017.12.001
-
J. Gu, C. Luo, P. Zhang, P. Ma, and X. Ren, “Laser cavitation peening of gray cast iron: Effect of coverage layer on the surface integrity,” Applied Surface Science, Vol. 521, p. 146295, Aug. 2020, https://doi.org/10.1016/j.apsusc.2020.146295
-
H. Zhang et al., “Surface integrity of 2A70 aluminum alloy processed by laser-induced peening and cavitation bubbles,” Results in Physics, Vol. 12, pp. 1204–1211, Mar. 2019, https://doi.org/10.1016/j.rinp.2018.11.093
-
M. Kumagai, M. E. Curd, H. Soyama, T. Ungár, G. Ribárik, and P. J. Withers, “Depth-profiling of residual stress and microstructure for austenitic stainless steel surface treated by cavitation, shot and laser peening,” Materials Science and Engineering: A, Vol. 813, p. 141037, May 2021, https://doi.org/10.1016/j.msea.2021.141037
-
Y. Xu, H. Li, S. Li, X. Guan, and C. Lan, “3-D modelling and statistical properties of surface pits of corroded wire based on image processing technique,” Corrosion Science, Vol. 111, pp. 275–287, Oct. 2016, https://doi.org/10.1016/j.corsci.2016.05.015
-
S. Soleimani, J. Sukumaran, A. Kumcu, P. de Baets, and W. Philips, “Quantifying abrasion and micro-pits in polymer wear using image processing techniques,” Wear, Vol. 319, No. 1-2, pp. 123–137, Nov. 2014, https://doi.org/10.1016/j.wear.2014.07.018
-
H. Yu et al., “Generation of superhydrophobicity on surface of multiphase aluminum alloy through the combination of ultrasonic cavitation treatment and surface modification,” Materials Today Communications, Vol. 37, p. 107080, Dec. 2023, https://doi.org/10.1016/j.mtcomm.2023.107080
-
H. Wu, “Mechanism and Experimental Investigation on the Surface Modification of Medical Titanium Metal by Cavitation Water Jet,” (in Chinese), Dalian Maritime University, 2023.
-
S. C. Roy, J.-P. Franc, C. Pellone, and M. Fivel, “Determination of cavitation load spectra – Part 1: Static finite element approach,” Wear, Vol. 344-345, pp. 110–119, Dec. 2015, https://doi.org/10.1016/j.wear.2015.09.006
-
S. C. Roy, J.-P. Franc, and M. Fivel, “Cavitation erosion: Using the target material as a pressure sensor,” Journal of Applied Physics, Vol. 118, No. 16, p. 16490, Oct. 2015, https://doi.org/10.1063/1.4934747
About this article
This work was supported by the National Natural Science Foundation of China (51075048, 51875586), Natural Science Foundation of Heilongjiang Province of China (Key Program, ZD2021E005), and Opening Project of the Key Laboratory of Advanced Manufacturing and Intelligent Technology (Ministry of Education), Harbin University of Science and Technology (KFKT202301).
The datasets generated during and/or analyzed during the current study are available from the corresponding author on reasonable request.
Lianxu Zhang: investigation, visualization, writing – original draft preparation; Wenqi Ma: supervision, writing-review and editing, project administration; Hongyi Sun: supervision, funding acquisition; Wenhao Dai: resources, conceptualization.
The authors declare that they have no conflict of interest.
