Abstract
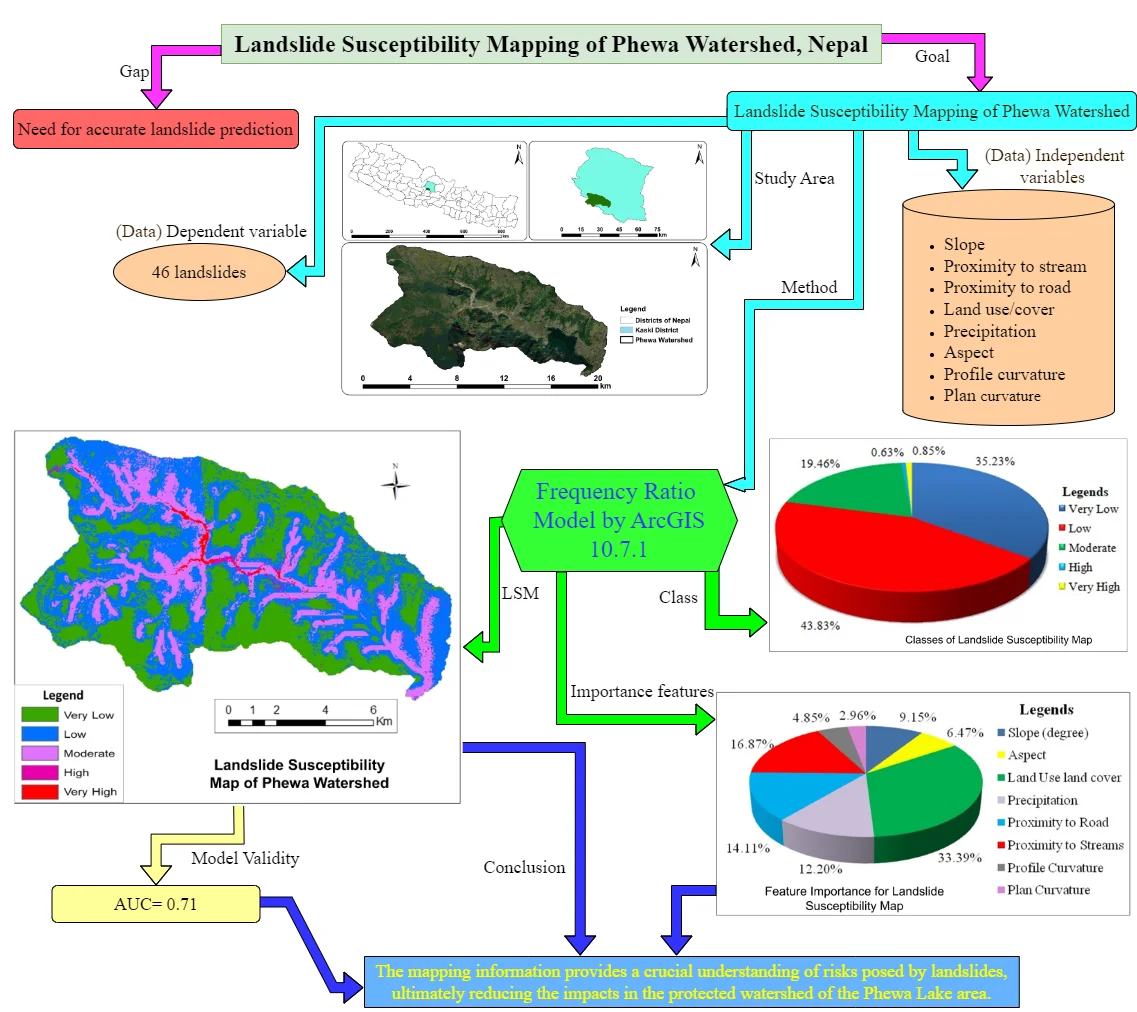
Heavy and incessant rainfall in Nepal, particularly during the monsoon season, leads to water-induced risks like landslides, necessitating the use of Landslide Susceptibility Mapping (LSM) for the prediction of landslide risks. We aim to determine the degrees of connection and connective factors among landslide incidents to generate an updated landslide susceptibility map of the Phewa watershed in Kaski District, Nepal. The most dependable and popular statistical approach for determining LSMs is the frequency ratio model, which was created in ArcGIS 10.7.1 by identifying 46 landslides in the area and analyzing eight causal factors. The LSM categorized the area into five classes, with the low class representing a large percentage (43.27 %) and the high class a small percentage (0.63 %). In FR techniques, slope, proximity to a stream or road, land use/cover, and precipitation were assigned greater weight than aspect, profile curvature, and plan curvature. Using the area under the curve approach, the applied model’s accuracy revealed a good performance value of 0.717. Taken together, the mapping information provides a crucial understanding of risks posed by landslides, ultimately reducing the impacts in the protected watershed of the Phewa Lake area.
1. Introduction
Landslides are natural phenomena that result in the falling and lateral dislocation of slope materials made of natural rock layers, soil, synthetic materials fill, or mixes of these elements, due to gravity and water [1, 2]. They are triggered by a couple of factors, namely dynamic triggering mechanisms (excessive rainfall and local soil moisture levels) and persisting geological features (steep slopes, weak rock layers, and tectonic activity) [3]. These factors increase the likelihood of landslides occurring in certain areas. Additionally, anthropogenic activities, such as deforestation, mining, and construction can also contribute to the occurrence of landslides by altering the natural landscape and destabilizing the soil. Overall, landslides are the result of a combination of natural and human-induced factors that can lead to the sudden and rapid movement of rock, soil, and debris down the slope. After accounting for landslides brought on by seismic events, 4,862 different landslide incidents were reported globally between 2004 and 2016, which resulted in 55,997 fatalities and economic losses estimated to be in the range of USD 20 billion annually, and the costs of damage may exceed all other costs associated with multi-hazard disasters [4]. Highly developed nations account for 5 % of all deaths caused by natural disasters globally. The remaining 95 % of overall deaths occur in middle and developing countries [5]. Infrastructure is severely damaged by landslides, and during the period from 1950 to 2009, China experienced the highest rate of deadly landslides, followed by Indonesia, India, the Philippines, Japan, Pakistan, and Nepal [6].
Nepal is prone to landslides due to its steep terrain, and unstable geological structure, in addition to high-intensity rainfall during the rainy season, forest destruction, vegetation service charge loads, and frequent earthquakes [7]. Geologically, Nepal being part of the Himalayan regions, comprises soft, fragile rocks, and unstable geological landscapes resulted due to the collision of the Indian and Eurasian plates. These areas are also among those with a high risk of earthquakes because they are tectonically active. As a developing country, Nepal undergoes a variety of construction and development operations. However, due to unplanned and unscientific development, landslides and other natural disasters have occurred. In Nepal Landslides are among the most common catastrophic events, claiming almost 200 lives each year and causing significant damage to infrastructure. Landslides killed 5,813 people in Nepal between 1971 and 2023, 941 people went missing, 2,708 people were injured, 22,319 dwellings were damaged or destroyed, 586,673 families were affected, and 5,654 events occurred [8]. The Table 1 provides additional comparison data, showing that landslides are among Nepal’s severe natural disasters. Landslides in the Kaski district, which includes the Phewa watershed, killed 234 people and left 35 persons missing between 1974 and 2013. Moreover, 152 dwellings were damaged, 5,791 families were affected, and 80 people were injured [9].
Table 1Disaster scenario in Nepal from 1971 to 2023
Event | Total death | Missing people | Injured | Affected families |
Landslide | 5813 | 941 | 2708 | 568673 |
Fire | 2140 | 0 | 3954 | 280483 |
Flood | 4136 | 1220 | 706 | 3735567 |
Earthquake | 9849 | 195 | 29164 | 4730 |
Thunderbolt | 2123 | 1 | 4884 | 9452 |
Epidemic | 16619 | 0 | 45766 | 514723 |
Storm | 115 | 9 | 329 | 2439 |
Heavy rainfall | 212 | 5 | 372 | 66832 |
High Altitude | 89 | 0 | 30 | 110 |
Cold wave | 559 | 0 | 83 | 2441 |
Avalanche | 268 | 64 | 144 | 1050 |
Forest Fire | 68 | 7 | 44 | 16347 |
Mapping the current landslides is crucial for understanding the connections between the spread of landslides and their causal factors. The probability that landslides will occur in a specific locality is referred to as landslide susceptibility [10]. It is also an effective instrument that assists land planners in developing regions near areas prone to slope instability [11]. The distribution of potentially unstable slopes based on a specific set of Geo-environmental variables is shown on a map of the susceptibility to landslides [12], which divides the land surface into zones according to susceptibility levels [13]. In the form of landslide susceptibility mapping, a significant amount of effort has been made globally to evaluate the landslide-sensitive zones. Among these, Van Westen [14] has thoroughly documented the use of GIS for the zonation of landslide hazards. Geographical Information Systems (GIS) is a tool for data storage, analysis, modeling, and mapping [15], is valuable for analyzing landslide risk, and can play a crucial role in managing and mitigating the impact of landslides on infrastructure and communities. To determine the possibility of a future landslide occurring under specific conditions, landslide susceptibility mapping often evaluates the previous landslide occurrence with numerous triggering elements, including geological, land use/ cover, topographical, and hydrological [16].
In the early 1990s, the manual mapping of landslide risk in Nepal involved field surveys and the collection of data on slope stability, geological conditions, land use, and other relevant factors. This information was then input into a computer system to create maps that identified areas at high risk of landslides. This manual mapping process was time-consuming. Such a mapping of landslide susceptibility started along road corridors and gradually expanded to watersheds and specific areas. Wagner, et. al. [17] designed the computer program named SHIVA to map the soil and rock hazards in Nepal [18]. However, with advancements in technology, such as remote sensing and geographic information systems (GIS), the process of mapping landslide risk has become more efficient and accurate. Today, Nepal continues to use a combination of manual field surveys and computer-based mapping techniques to assess and manage landslide risk.
Different approaches such as heuristic (traditional approach and based on expert knowledge), deterministic (based on data from laboratory tests and field surveys), statistical (based on the mathematical analysis of the field data and subject-matter knowledge), machine learning (based on the correlation between the training datasets previous landslides and the triggering parameters that forecast the high potential area to landslide), are used for LSM. In recent years, several geoscientists and geotechnical professionals have developed and are implementing hybrids of semi-quantitative/semi-qualitative decision-making, statistical/geostatistical approaches, inventory-based probabilistic methods, and so on [19-23]. Several statistical methods have been used widely, including the weights of evidence [24], frequency ratio (FR) [25], and evidential belief function [26]. Due to its reliable calculation and precise results, the statistical approach is becoming more and more popular. An evaluation of several statistical approaches revealed that the FR model outperformed the others [27]. Bourename, et. al. [28] also contrasted five statistical techniques, namely WoE, AHP, Weighting Factor (WF), Logistic Regression (LR), and FR, and concluded that FR had a greater prediction rate of 86.59 percent. For instance, Regmi, et. al. [29] evaluated different statistical techniques, such as the statistical index (SI) and weights of evidence (WoE) approaches and discovered that the frequency ratio (FR) fared better.
Mapping landslide susceptibility typically involves utilizing statistical hazard, landslide distribution, landslide frequency, qualitative hazard, deterministic hazard, and other approaches as standard features [30]. The frequency model is often considered more effective than other approaches for landslide susceptibility mapping due to its ability to directly quantify the frequency of landslides in a given area. This model provides a clear and straightforward assessment of the likelihood of landslides occurring in specific locations, which can be valuable for risk assessment and mitigation efforts. Additionally, the frequency model is often more easily interpretable and can provide a more tangible understanding of landslide susceptibility compared to other approaches. The frequency ratio (FR) model from the statistical method for landslide susceptibility mapping was selected for this study due to its distinct advantages over various other models. To generate Landslide Susceptibility Mapping in the study region and calculate the spatial relationship between two variables i.e., landslide events and causative factors, the Frequency Ratio model is an effective advanced method [31]. The FR model is regarded as a reliable and experimental approach that may be utilized to determine the relationship between landslide events and causal elements and to provide useful Landslide Susceptibility Mapping for the research area [32]. The FR model has a significant advantage in that it can determine the rank of the causative factors concerning a landslide occurrence as well as whether or not a specific range of causative factor values will be dangerous in the event of landslides [33].
Numerous studies have been conducted at international, national, and local levels, yet none have focused on landslide susceptibility modeling to mitigate landslides in the Phewa watershed, despite existing threats from landslides. The primary goal of our research is to assess the relationship between landslide events (dependent variable) and causative factors (independent variables) to create an accurate, updated landslide susceptibility mapping of the study area using the FR model. The study aims to highlight the different zones of landslides in the Phewa Watershed of Nepal.
2. Materials and methods
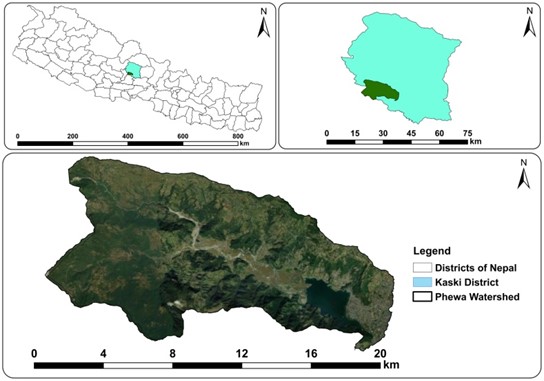
2.1. Study area
The Phewa watershed extends from 83°48'1.93" east to 83°58'13.18" east, as well as from 28°11'37.83" north to 28°17'27.30" north, with an elevation ranging from 793 meters 2508.81 meters (Fig. 1). In Nepal's mid-hill zone, the watershed is found. Following a Cabinet meeting, the Gandaki province government declared in 2022 that the 123 square kilometers of the Pokhara Lake cluster listed on the Ramsar site will become the Phewa Lake protected watershed area. The watershed area is made up of major parts of Pokhara Metropolitan City and some parts of Annapurna Rural Municipality. The watershed region is comprised of 44.95 percent forest, 38.52 percent agricultural land, 10.76 percent built-up area, 4.29 percent water bodies and barren land, and 1.48 percent flooded area or barren land.
Fig. 1Map of the study area, Phewa Watershed
2.2. Data sources
This study used both primary and secondary sources. Primary data were gathered directly from the field, while secondary data were gathered from published and unpublished records from both private and public organizations. The mapping of the landslide inventory was achieved by analyzing Google Earth images, historical landslide data, and fieldwork. The Phewa watershed’s landslide susceptibility map was created utilizing a variety of maps, including those for land cover/use, DEM, slope, aspect, plan curvature, road distance, stream proximity, profile curvature, and precipitation. The Department of Survey, Government of Nepal, generated topographic maps that were then used to digitize contour layers to construct the DEM. From the DEM, slope maps and aspect maps were generated. The drainage map was used to determine river distances, which were then buffered based on the rivers’ chronological sequence. The topographic map was used to compute the length of the roads. The Department of Hydrology and Meteorology, Government of Nepal, served as the source of rainfall data for the risk assessment (Table 2).
Table 2Types and sources of data that used for mapping
Topographical variable | Value | Resolution | Source |
DEM | 729-2434 m | 30 m | ALOS PALSAR RTC, openly available at https://asf.alaska.edu/ |
Slope | 0-70.96° | 30 m | ALOS PALSAR RTC, openly available at https://asf.alaska.edu/ |
Aspect | –1-360 | 30 m | ALOS PALSAR RTC, openly available at https://asf.alaska.edu/ |
Plan curvature | <-0.576->0.371 | 30 m | ALOS PALSAR RTC, openly available at https://asf.alaska.edu/ |
Profile curvature | <-0.545->0.386 | 30 m | ALOS PALSAR RTC, openly available at https://asf.alaska.edu/ |
LULC (Water bodies, built-up, forest, agriculture, flooded area) | – | 30 m | Sentinel Image, openly available in [ESA] at https://www.esa.int. |
Stream | Proximity to <100 m->500 m | 30 m | Survey department |
Precipitation | 2,055-4,003 mm | 30 m | Department of hydrology and meteorology |
Road | Proximity to <100 m->500 m | 30 m | Survey department |
Landslide Inventory (Training and Testing dataset) | – | 30 m | Google Earth Image and Field Survey |
2.2.1. Landslide Inventory
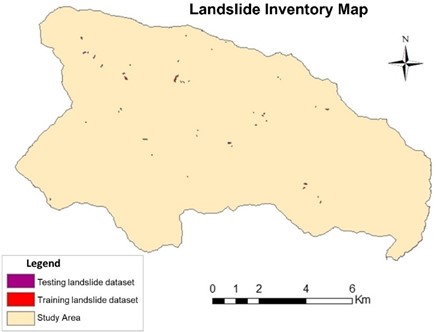
Scientists and technicians can determine comparable circumstances in other locations and evaluate the possible risk of future landslides by examining the features and causes of previous landslides. Inside the study area, a total of 46 landslides were mapped. Using the Subset Features Tools in ArcGIS, the landslides in the landslide inventory were randomly divided into a training set area (80 %) with 37 points and a test set area (20 %) with 9 points. These were the dependent variable (landslide polygon) data that were utilized to train the model. Landslides vary in size according to their geography and location (Fig. 2). The approach of using a landslide inventory map based on historic landslide events, field site documentation, and satellite imagery interpretation is a common and effective method for assessing landslide risk. The division of the landslide inventory into a training set and a test set is a standard practice in machine learning and geospatial analysis, allowing for the development and validation of predictive models. The choice of a 80 % training set and a 20 % test set is a reasonable approach, as it provides enough data for both model development and validation.
Fig. 2Landslide inventory map
2.2.2. Landslide triggering factors
The landslide triggering factors are independent variables used to model the landslide susceptibility mapping. Future landslides can be predicted using the relationship between the environment and previous landslides. In this study, eight factors were utilized to identify the landslide-prone areas, which were divided into four categories: topographic, hydrological, geological, and other variables.
Google Earth images and DEM were used to create the landslide inventory map for this study, which was then verified using information from a field survey A high-resolution Google Earth Engine image displaying the landslide scar was used to examine the inventory map. We verified the satellite-based landslide database via a field study and looked at how different landslide types affected vegetation, water supply, physical structures, and the lives of people. The Phewa watershed's forest and ecology have suffered significantly as a result of the landslide hazard. In comparison to other conditioning elements, the slope angle is a factor that is equally significant but has a bigger influence. Due to their steepness and potential for increased environmental stress, areas with greater slopes typically produce more landslides. ALOS DEM was used to calculate the slope of the study area. There are six different classifications of slope [34].
In ArcGIS 10.7.1, the computed slope was then classed into five categories: 0-7.792°, 7.793-16.14°, 16.15-23.1°, 23.11-30.33°, 30.34-39.79°, and 39-8-70.96°. The research area has a slope that ranges from 0 degrees to 70.96 degrees. Most of the research area was highly rocky and steep (Fig. 3(a)). Aspect is also another crucial LSM conditioning component. It influences stratum instability by regulating moisture in the rocks and soil as a result of wind and varying the amount of solar exposure in the study area. Nine classes (Flat, North, Northeast, East, Southeast, South, Southwest, West, and Northwest) were formed using angular values based on the aspect’s facing orientation using ArcGIS 10.7.1 after receiving input through the ALOS DEM [27] (Fig. 3(b)). One of the most crucial initiating elements for a landslide is precipitation [35]. Most of the landslides occurred in areas with the most rainfall. The departments of hydrology and meteorology, Government of Nepal provided 32-year data (1990-2021), which were interpolated in GIS to generate a rainfall map (Fig. 3(c)). A sentinel image available from ESA was used to classify Land use/Cover area. Five classifications, mainly agriculture, water bodies, forest, built-up, and flooded areas, were used as the training dataset. The Land Use/Cover factor was scaled to a spatial resolution of 30 m to ensure smooth model operation. According to classification data, 44.95 % of the area was covered by forest, 38.52 by agricultural, 10.76 % by built-up areas, 4.28 % by water bodies, and 1.47 % by flooded land (Fig. 3(d)).
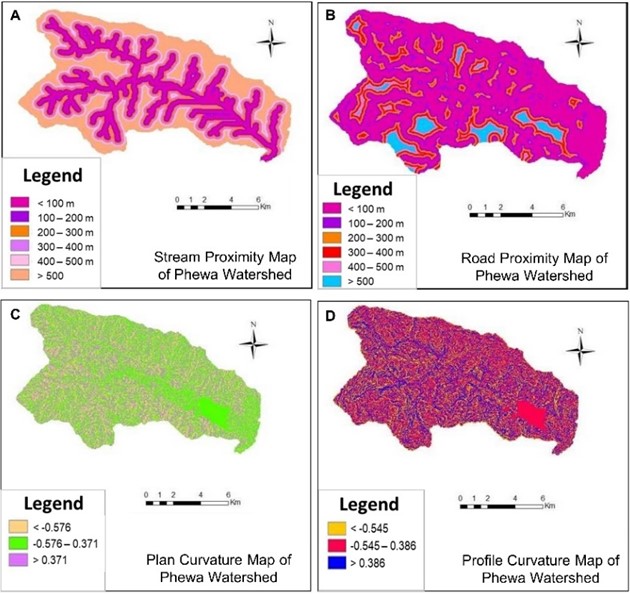
Another crucial factor for Landslide Susceptibility Mapping is the closeness to streams because these areas are more likely to experience landslides and soil erosion due to the erosive action of water. Based on the Euclidean distance, six buffer zones have been defined around the stream (Fig. 4(a)). Proximity to roads, similar to stream proximity, is a significant factor that directly contributes to landslides. Furthermore, a recently constructed road could contribute to slope instability. For the road map to function properly, the spatial resolution was rescaled to match the resolution of the ALOS DEM. Due to this, six categories were created based on the Euclidean distance from the centerline of roadways: below 100 meters, 100-200 meters, 200-300 meters, 400-500 meters, and above 500 meters [27] (Fig. 4(b)). The surface that is perpendicular to the slope direction is depicted by the plan curvature. It typically comes in three types: laterally convex, laterally concave, and linear, each represented by a positive, negative, or zero number. It was divided into three classes based on Wang et al. [27]: below –0.576, –0.576-0.371, and above 0.371 (Fig. 4(c)). The surface that is parallel with the direction of the steep slope is shown by the profile curvature. It typically comes in three varieties: upwardly convex, upwardly concave, and linear, each represented by a negative, positive, or zero value. Three classifications were developed: below –0.545, –0.545-0.386, and above 0.386, following Wang, et al. [27] (Fig. 4(d)).
Fig. 3Map of a) slope, b) aspect, c) rainfall/precipitation, d) land use/cover
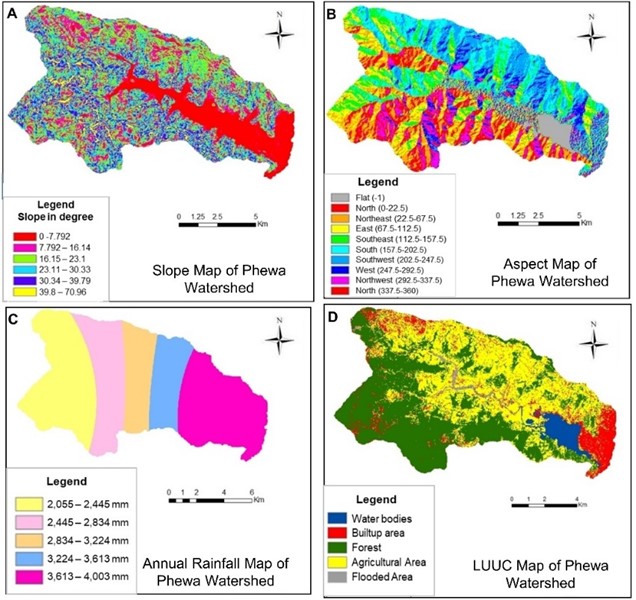
Fig. 4Map of a) stream proximity, b) road proximity, c) plan curvature and d) profile curvature
2.3. Methods
The frequency ratio model is considered a reliable and experimental method that can be used to generate precise maps of the study area's landslide susceptibility and to analyze the relationship between landslide incidences and cause factors [32]. The FR method was explained in detail. All factor maps were categorized into their appropriate class numbers using the same resolution (30 m). Landslide data were divided into 80 % for training and 20 % for testing. The factor map and landslide raster were both added to ArcMap to calculate the number of landslide pixels in each class. Eq. (3) was used to ascertain the FR for each class. Eq. (4) gives the Relative Frequency (RF) for each of the classes. An integer was used to reclassify each variable’s RF value. For every factor, the prediction ratio (PR) was determined thereafter. The reclassification factor map was multiplied by the prediction rate using ArcMap’s raster calculator tool. Ultimately, five groups were developed based on natural breaks from the raster calculator output, resulting in the landslide susceptibility map. An accuracy assessment for FR was carried out using 20 % of the test dataset. Using the approach developed by the ArcGIS platform, the model was tested by examining the area under the curve (AUC) value of the Receiver Operating Characteristics (ROC) curve. The Frequency Ratio (FR) and Relative Frequency (RF) for each class were calculated using Eqs. (3) and (4), as provided by Kannan, et. al. [33]:
A frequency ratio (FR) table was generated after analyzing the landslide inventory using landslide conditioning factors.
PR was calculated utilizing Eq. (5), which Meena et al. (2022) suggested:
where PR denotes the prediction rate and SA denotes the indicator of spatial association between the spatial element and the landslide. The calculated absolute difference between the highest and minimum SA values is divided by the smallest absolute difference among all factors. The PR values of the proposed component weights were examined for susceptibility mapping.
3. Result
3.1. Landslide susceptibility map
The statistical approach used frequency ratio methods to analyze the quantitative relation between landslides and conditioning factors. The calculation of the landslide susceptibility model (LSM) was performed using Eq. (3) and Eq. (4) on the ArcGIS platform. The landslide susceptibility map was reclassified into five classes using the natural breaks method, with the largest area in the low class (43.226 %), followed by very low (35.234 %), moderate (19.46 %), very high (0.846 %), and high (0.63 %), (Fig. 5 and 6).
Fig. 5Landslide susceptibility map
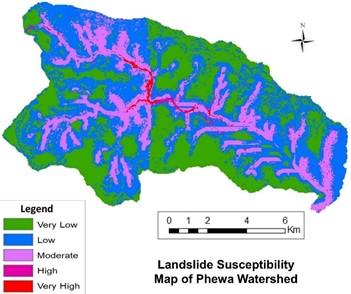
Fig. 6Classes of landslide susceptibility map
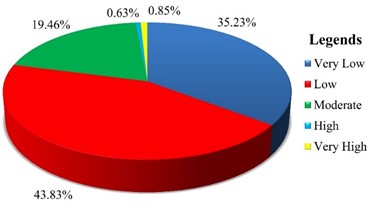
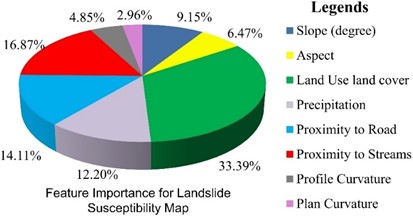
Fig. 7Feature Importance for LSM
3.2. Conditioning factor importance
The frequency ratio method used eight conditioning parameters Slope, Aspect, Plan curvature, Profile curvature, Precipitation, Proximity to Stream, Proximity to Road and Land use/Land cover for LSM. The methods use 80 % training data to train the model. In FR methods Land use/cover, Proximity to Stream, Proximity to Road, Precipitation and slope have greater importance followed by Aspect, profile curvature, and plan curvature have comparatively lower importance in this study area (Fig. 7).
3.2.1. Precipitation
To assess the relationship between rainfall parameters and landslide events, a rainfall map was created and then reclassified into five classes. The map presented in Fig. 3(c) shows the variation in rainfall from 2,055 mm to 4,003 mm annually, which is the range between the area’s reported highest and minimum rainfall. According to the map, the area’s rainfall gradually decreases from east to west. Landslides are more likely to occur under high rainfall than during low rainfall. Rainfall was found to be a key factor in landslides, as seen in Fig. 7. The findings showed that the reactionary precipitation class for landslides is 2,445-2,834 mm/year, followed by 2,055-2,445 mm/year, 3,613-4,003 mm/year, 3,224-3,613 mm/year, and 2,834-3,224 mm/year (Table 3).
3.2.2. Slope
Five classes, with slopes ranging from 0° to 70.96°, were developed for the study area (Fig. 3(a)). In contrast to the other categories, slopes with steeper angles have a variable potential for risks (Fig. 7). The slope component is influential up to 40° because a rising slope increases landslide occurrence, while above 40°, an increasing slope decreases landslide activity. The data revealed that slopes 0°-7.792° are the most vulnerable to landslides, whereas slopes 39.8°-70.96° are the most resistant, followed by 7.793°-23.1° (Table 3).
Table 3Detailed analysis of the variables affecting the frequency of landslides
SN | Parameter | Class | Class pixel* | % Class pixel | Land slide pixel | % landslide pixel | FR | RF | PR |
1 | Slope (degree) | 0-7.792 | 196195 | 16.7729 | 173 | 23.1283 | 1.3789 | 0.2532 | 3.09293 |
7.793-16.14 | 223878 | 19.1396 | 103 | 13.7701 | 0.7195 | 0.1321 | |||
16.15-23.1 | 313368 | 26.7902 | 171 | 22.8610 | 0.8533 | 0.1567 | |||
23.11-30.33 | 244444 | 20.8978 | 198 | 26.4706 | 1.2667 | 0.2326 | |||
30.34-39.79 | 144303 | 12.3366 | 98 | 13.1016 | 1.0620 | 0.1950 | |||
39.8-70.96 | 47525 | 4.0630 | 5 | 0.6684 | 0.1645 | 0.0302 | |||
Total | 1169713 | 748 | 5.4449 | ||||||
2 | Aspect | Flat | 2129 | 0.1821 | 1 | 0.1337 | 0.7342 | 0.0884 | 2.18724 |
North | 109020 | 9.3243 | 41 | 5.4813 | 0.5879 | 0.0708 | |||
Northeast | 192247 | 16.4425 | 51 | 6.8182 | 0.4147 | 0.0499 | |||
East | 171134 | 14.6368 | 67 | 8.9572 | 0.6120 | 0.0737 | |||
Southeast | 201667 | 17.2482 | 196 | 26.2032 | 1.5192 | 0.1828 | |||
South | 232843 | 19.9146 | 257 | 34.3583 | 1.7253 | 0.2076 | |||
Southwest | 110651 | 9.4638 | 33 | 4.4118 | 0.4662 | 0.0561 | |||
West | 118858 | 10.1657 | 78 | 10.4278 | 1.0258 | 0.1235 | |||
Northwest | 30658 | 2.6221 | 24 | 3.2086 | 1.2237 | 0.1473 | |||
Total | 1169207 | 748 | 8.3088 | ||||||
3 | Land use land cover | Waterbodies | 50402 | 4.2851 | 58 | 7.7540 | 1.8095 | 0.0695 | 11.2871 |
Builtup Area | 126584 | 10.7620 | 159 | 21.2567 | 1.9752 | 0.0759 | |||
Forest | 528767 | 44.9549 | 11 | 1.4706 | 0.0327 | 0.0013 | |||
Agricultural Area | 453114 | 38.5230 | 286 | 38.2353 | 0.9925 | 0.0381 | |||
Flooded Area | 17350 | 1.4751 | 234 | 31.2834 | 21.2081 | 0.8151 | |||
Total | 1176217 | 748 | 26.0181 | ||||||
4 | Precipitation | 2055-2445 mm | 334377 | 28.4340 | 268 | 35.8289 | 1.2601 | 0.2713 | 4.12205 |
2445-2834 mm | 221919 | 18.8711 | 246 | 32.8877 | 1.7428 | 0.3752 | |||
2834-3224 mm | 147478 | 12.5409 | 34 | 4.5455 | 0.3624 | 0.0780 | |||
3224-3613 mm | 145921 | 12.4085 | 53 | 7.0856 | 0.5710 | 0.1229 | |||
3613-4003 mm | 326279 | 27.7454 | 147 | 19.6524 | 0.7083 | 0.1525 | |||
Total | 1175974 | 748 | 4.6446 | ||||||
5 | Proximity to road | < 100 m | 644470 | 54.7921 | 523 | 69.9198 | 1.2761 | 0.3439 | 4.76995 |
100-200 m | 233081 | 19.8163 | 118 | 15.7754 | 0.7961 | 0.2145 | |||
200-300 m | 133735 | 11.3700 | 74 | 9.8930 | 0.8701 | 0.2345 | |||
300-400 m | 74520 | 6.3356 | 28 | 3.7433 | 0.5908 | 0.1592 | |||
400-500 m | 44323 | 3.7683 | 5 | 0.6684 | 0.1774 | 0.0478 | |||
> 500 m | 46080 | 3.9177 | 0 | 0.0000 | 0.0000 | 0.0000 | |||
Total | 1176209 | 748 | 3.7105 | ||||||
6 | Proximity to streams | < 100 m | 214698 | 18.2534 | 372 | 49.7326 | 2.7246 | 0.4446 | 5.7011 |
100-200 m | 183236 | 15.5785 | 158 | 21.1230 | 1.3559 | 0.2213 | |||
200-300 m | 160348 | 13.6326 | 98 | 13.1016 | 0.9610 | 0.1568 | |||
300-400 m | 139667 | 11.8743 | 43 | 5.7487 | 0.4841 | 0.0790 | |||
400-500 m | 118947 | 10.1127 | 30 | 4.0107 | 0.3966 | 0.0647 | |||
> 500 m | 359313 | 30.5484 | 47 | 6.2834 | 0.2057 | 0.0336 | |||
Total | 1176209 | 748 | 6.1279 | ||||||
7 | Profile curvature | < –0.545 | 195469 | 16.6204 | 93 | 12.4332 | 0.7481 | 0.2609 | 1.63939 |
–0.535 -0.386 | 659496 | 56.0757 | 433 | 57.8877 | 1.0323 | 0.3600 | |||
> 0.386 | 321116 | 27.3039 | 222 | 29.6791 | 1.0870 | 0.3791 | |||
Total | 1176081 | 748 | 2.8674 | ||||||
8 | Plan curvature | < –0.576 | 210721 | 17.9172 | 117 | 15.6417 | 0.8730 | 0.3024 | 1 |
–0.576 -0.371 | 618042 | 52.5510 | 425 | 56.8182 | 1.0812 | 0.3745 | |||
> 0.371 | 347318 | 29.5318 | 206 | 27.5401 | 0.9326 | 0.3230 | |||
Total | 1176081 | 748 | 2.8868 | ||||||
* No. of pixel= (Total Area/Cell size area) = Total area/ (30*30) | |||||||||
3.2.3. Aspect
The slope orientation is displayed on the aspect map in Fig. 3(b), and the places with higher aspect values have a relatively large impact on the landslide hazard level, and vice versa. According to Table 3, the most prominent aspect class is south, followed by Southeast, Northwest, and West. The south aspect zone of the study area is prone to landslides, with values of 0.0011.
3.2.4. Land use/cover
The tabulated results from this study made it very clear that different types of land use/cover had different effects on landslide events. According to the results of Table 3, the built-up and flooded regions of this study area are more sensitive to landslides, but the forest and agricultural areas are more resistant to landslides than other categories of land use/cover. The land use/cover was found to play a crucial trigger factor (33.394 %) among the other eight variables of landslides, as shown in Fig. 7.
3.2.5. Stream proximity
A large number of landslide events and pixels were found near streams, with fewer landslide events found far from drainage. The information in Table 3 shows that both the variables i.e., the independent variable (proximity to stream) and the dependent variable (landslide) have a significant relationship with each other. According to the statistical information in Table 3, a buffer of less than 100 meters from the stream network is the class that is most prone to experiencing a landslide, followed by buffers of 200 to 300 meters, 400 to 500 meters, and more than 500 meters. The stream proximity was found to play a crucial trigger factor (16.867 percent) of landslides, as shown in Fig. 7.
3.2.6. Road proximity
The road network and the dependent variable landslide exhibit an obvious link, as shown by the result (Table 3). Landslides were more likely to occur on slopes close to roadways, while risk levels on slopes farthest from roads steadily declined. The road network has a direct impact on the instability of strata. In the study area, the road network’s <100 m buffer zone was vulnerable to landslides with values of 0.0008. The road network's buffer zone that extends beyond 500 meters was impervious to landslides.
3.2.7. Curvature
Plan and profile curvatures make up the two classes that comprise the curvature of this study area.
3.2.7.1. Plan curvature
Convergence, flat, and divergence are the three categories used in this study to categorize plan curvature. When the plan curvature is high, the slope has a side widely convex shape; when it is low, the slope has a concave shape. The runoff surface is significantly impacted by this issue. Convex areas typically distribute runoff uniformly, which has no impact on the stability of the slope. Concaved surfaces, on the other hand, help water collect in the lowest area, which causes landslides to happen. Under the influence of plan curvature, the study area’s landslide risks are primarily concentrated in the plan curvature range of less than –0.576 to more than 0.371, with –0.576-0.371 being the greatest and accounting for 37.45 % of all occurrences (Table 3).
3.2.7.2. Profile curvature
The slope has a convex shape when the curvature is high and a concave shape when it is low. The profile curvature was divided into three groups for this study: concave, convex, and linear, underlining its Geo-morphological significance as it impacts water flow. Upwardly convex surfaces are represented by negative profile curvature values, whereas concave surfaces are represented by positive profile curvature values and the surfaces’ straight slope linear feature. Landslide risks in the study area are mostly concentrated in the profile curvature range of less than –0.545 to more than 0.386, with less than –0.545 being the least and accounting for 12.43 % of all occurrences (Table 3).
4. Model performance and validation
The validity and accuracy were assessed using the area under the curve (AUC) of receiver operating characteristic (ROC) curves, a quantitative method for evaluating the landslide susceptibility model based on prediction accuracy by using ArcGIS 10.7.1 tool. The true positive rate (-axis) and false positive rate (-axis) of the training and validation landslides were used to generate the AUC rate curves. In this work, 80 % of the landslides were utilized to train landslide susceptibility models, while the remaining 20 % were used for model validation. Fig. 8 demonstrates that the frequency ratio model has an AUC value of 0.717, indicating good performance. The AUC value lies between 0 and 1, and the higher its value, the greater the prediction accuracy of the model.
Fig. 8AUC Curve for validation
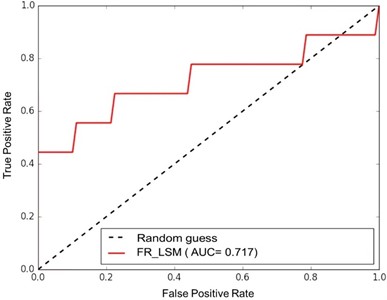
As the AUC value above 0.5 is generally considered to indicate a satisfactory outcome in Receiver Operating Characteristics (ROC) analysis, the values above 0.7 in this study suggest a good model. Oh, et al. [32] evaluated the effectiveness of the landslide susceptibility analysis using frequency ratio (FR) with iterative random sampling and observed that landslide susceptibility maps were validated with each validation dataset. They conclude that FR enables knowledge-driven analyses of the causal factors to be integrated into the landslide susceptibility analysis while also being widely used in other areas. Acharya, et al. [37] updated an inventory of Bhotang, Nepal using ten conditioning factors and a Google Earth Pro image. They found that the Area Under Curve (AUC) value of FR for validation was 0.713. Budha, et. al. [38], described the FR of the Panchase area, with a success rate of 0.76 AUC, indicating that the model has 76 % predictability. Onagh, et. al. [39] found an AUC of 0.762 during their model validation in the Uttarakhand district of northwestern India. In the Kulekhani watershed of Nepal the AUC for the statistical index method was 0.7578 [40]. Consequently, the AUC found in this study area is 0.717, which is quite comparable to that observed in previous studies in the Himalayas.
5. Discussion
The PR determined the weight of the conditioning factors in the study. Land use/cover was found to be the most important factor, followed by proximity to a stream, proximity to a road, precipitation, and slope. Aspect, plan curvature, and profile curvature were found to be less significant (Fig. 7). This supports previous findings of Basnet, et al. [41] that identified land use, road presence, precipitation, streams, aspect, and slope as primary triggers for landslides in their study area. The soil loss from the Phewa watershed because of the influence of LULC change was estimated by Bista and Basnet [42] using GIS, Remote sensing, and the RUSLE tool. They found that soil loss was 29.3 t/ha/yr in 2007 and 25.4 t/ha/yr in 2017. According to a study conducted by Rowbotham and Dudycha [43], dip slopes, particularly those under cultivation, were identified as the primary sources of slope collapse. The study area was significantly influenced by the closeness of roads, which were frequently built quickly lacking proper technical planning, drainage system, or slope maintenance.
In contrast, a study by Vuillez, et al. [44] found that 84 % of newly generated landslides in the Phewa watershed occur within 40 meters of a road, and more than 40 % of them cross a road. Surface water concentration and slope decline caused by these roads also contribute to slope instability. The presence of steeper slopes increases the likelihood of deformation and failure. Solar radiation and other aspects affect vegetation coverage, surface weathering, and evaporation, all of which influence landslide occurrence. Cooperation between communities upstream and downstream is crucial in reducing landslide risk in the area, where people reside at both levels. Media reports have highlighted landslide events in the Phewa watershed, with heavy rainfall and sloppy terrain being contributing factors. Sharma [45] reported that on August 25, 2014, a landslide triggered by continuous rainfall resulted in three fatalities and one person being reported missing. The incident also led to the destruction of the Typical Restaurant & Lodge located on the shores of Phewa Lake at Anadu, Pumdibhumdi in Pokhara-22. According to the District Police Office in Kaski on July 29, 2015, five people, including women, were killed and 25 others were injured when 12 houses in Dundakhet, Pokhara-23 were buried by landslides [46-48]. On July 10, 2020, around 3:00 a.m., landslide debris buried a house in Gothadi, Sarangkot, killing five people [49]. In an experiment by Budha, et al. [50], the Panchase area adjacent to this study area revealed a larger amount of landslide area in forests and cultivated lands, which are 0.762 km2 and 0.358 km2 respectively, accounting for 75 % of the total landslide area. Basnet, et al. [41] discovered similar results in a section of the Phewa watershed, indicating that forests have a higher frequency of landslides. Previous research has shown that forests have a higher frequency of landslides. However, this study found that landslides are less concentrated in forested areas because the shadows obstruct landslide images in satellite imagery. It is crucial to carefully choose plant species because there is a considerable chance that landslides will occur in both farmed and forested areas. Landslides can be caused by forests, so to reduce the risk of landslides in the protected Phewa watershed, planners should take into account the importance of deeply rooted vegetation and minor drainage improvements. In determining landslide risk and developing risk mitigation strategies, it is crucial to study the landslide susceptibility mapping because the Phewa watershed is a protected watershed and a part of the Ramsar site.
6. Conclusions
A landslide susceptibility map of the Phewa watershed was generated during this study using a variety of maps and data gathered through fieldwork, past landslide data, satellite data, and Google Earth data. It recognized 46 landslides across the study area and used eight variables, including slope, aspect, land use/coverage, precipitation, proximity to roads and streams, profile curvature, and plan curvature. The frequency ratio (FR) model was applied in the Phewa watershed to produce LSMs, which led to a map that was categorized into five levels: very low, low, moderate, high, and very high. According to the study, the most important variables influencing landslide risk in this region were slope, precipitation, land use/cover, and proximity to streams and roads. It also looked at the relationship between rainfall and landslides, finding that a higher frequency of landslides was linked to increased rainfall. The Area under the Curve (AUC) score of 0.717 for the susceptibility model indicated good performance. The LSMs offer important information to researchers, communities, government authorities, and planners to deal with the risks of landslides in the area, even though they cannot anticipate the frequency or timing. The results of this study will be crucial for comprehending the risk of landslides and developing strategies to mitigate their impact in the protected watershed of the Phewa Lake area.
References
-
R. C. Sidle and H. Ochiai, “Landslides: processes, prediction, and land use,” in Water Resources Monograph, Washington, D. C.: American Geophysical Union, 2006, https://doi.org/10.1029/wm018
-
L. R. Walker and A. B. Shiels, Landslide Ecology. New York: Cambridge University Press, 2012, https://doi.org/10.1017/cbo9780511978685
-
F. Guzzetti et al., “Geographical landslide early warning systems,” Earth-Science Reviews, Vol. 200, p. 102973, Jan. 2020, https://doi.org/10.1016/j.earscirev.2019.102973
-
M. J. Froude and D. N. Petley, “Global fatal landslide occurrence from 2004 to 2016,” Natural Hazards and Earth System Sciences, Vol. 18, No. 8, pp. 2161–2181, Aug. 2018, https://doi.org/10.5194/nhess-18-2161-2018
-
S. Lacasse and F. Nadim, “Landslide risk assessment and mitigation strategy,” in Bridge Engineering Handbook, CRC Press, 2014, pp. 31–61, https://doi.org/10.1201/b15621
-
K. Forbes et al., “Forests and landslides: The role of trees and forests in the prevention of landslides and rehabilitation of landslide-affected areas in Asia,” Food and Agriculture Organization of the United Nations Regional Office for Asia and the Pacific, Bangkok, 2011.
-
B. N. Upreti and M. R. Dhital, Landslide Studies and Management in Nepal. Kathmandu, Nepal: International Centre for Integrated Mountain Development (ICIMOD), 1996, https://doi.org/10.53055/icimod.240
-
“Nepal Disaster Risk Reduction Portal,” Ministry of Home Affairs, GoN, Kathmandu, Nepal, MoHA, 2023.
-
“Country Profile Nepal, Disaster Information System Database,” http://www.desinventar.org/en/.
-
F. Guzzetti, P. Reichenbach, F. Ardizzone, M. Cardinali, and M. Galli, “Estimating the quality of landslide susceptibility models,” Geomorphology, Vol. 81, No. 1-2, pp. 166–184, Nov. 2006, https://doi.org/10.1016/j.geomorph.2006.04.007
-
P. Magliulo, A. Di Lisio, F. Russo, and A. Zelano, “Geomorphology and landslide susceptibility assessment using GIS and bivariate statistics: a case study in southern Italy,” Natural Hazards, Vol. 47, No. 3, pp. 411–435, Apr. 2008, https://doi.org/10.1007/s11069-008-9230-x
-
F. Guzzetti, P. Reichenbach, M. Cardinali, M. Galli, and F. Ardizzone, “Probabilistic landslide hazard assessment at the basin scale,” Geomorphology, Vol. 72, No. 1-4, pp. 272–299, Dec. 2005, https://doi.org/10.1016/j.geomorph.2005.06.002
-
M. L. Suzen and V. Doyuran, “A comparison of the GIS based landslide susceptibility assessment methods: multivariate versus bivariate,” Environmental Geology, Vol. 45, No. 5, pp. 665–679, Mar. 2004, https://doi.org/10.1007/s00254-003-0917-8
-
C. van Westen, GIS in Landslide Hazard Zonation: a Review, with Examples from the Andes of Colombia. United Kingdom: Taylor & Francis, 1994, pp. 135–166.
-
Reddy and G. P. Obi, “Geographic information system: principles and applications,” in Geotechnologies and the Environment, Cham: Springer International Publishing, 2018, pp. 45–62, https://doi.org/10.1007/978-3-319-78711-4_3
-
F. C. Dai, C. F. Lee, and X. H. Zhang, “GIS-based geo-environmental evaluation for urban land-use planning: a case study,” Engineering Geology, Vol. 61, No. 4, pp. 257–271, Sep. 2001, https://doi.org/10.1016/s0013-7952(01)00028-x
-
A. Wagner, E. Leite, and R. Oliver, “A landslide hazard mapping software (version 1.0),” ITECO CH and University of Lausanne, Switzerland, 1990.
-
V. Dangol, “Status of landslide hazard mapping in Nepal,” in Disaster Mitigation of Debris Flows, Slope Failures and Landslides, pp. 815–819, 2006.
-
T. Y. Duman, T. Can, C. Gokceoglu, H. A. Nefeslioglu, and H. Sonmez, “Application of logistic regression for landslide susceptibility zoning of Cekmece Area, Istanbul, Turkey,” Environmental Geology, Vol. 51, No. 2, pp. 241–256, Oct. 2006, https://doi.org/10.1007/s00254-006-0322-1
-
I. Yilmaz, “Landslide susceptibility using frequency ratio, logistic regression, artificial neural networks and their comparison: a case study from Kat landslides (Tokat-Turkey),” Comput Geosci, Vol. 35, No. 6, pp. 1125–1138, 2009.
-
H. A. Nefeslioglu, E. Sezer, C. Gokceoglu, A. S. Bozkir, and T. Y. Duman, “Assessment of landslide susceptibility by decision trees in the metropolitan area of Istanbul, Turkey,” Mathematical Problems in Engineering, Vol. 2010, No. 1, Feb. 2010, https://doi.org/10.1155/2010/901095
-
A. Akgun, E. A. Sezer, H. A. Nefeslioglu, C. Gokceoglu, and B. Pradhan, “An easy-to-use MATLAB program (MamLand) for the assessment of landslide susceptibility using a Mamdani fuzzy algorithm,” Computers and Geosciences, Vol. 38, No. 1, pp. 23–34, Jan. 2012, https://doi.org/10.1016/j.cageo.2011.04.012
-
S. Pereira, R. A. C. Garcia, J. L. Zêzere, S. C. Oliveira, and M. Silva, “Landslide quantitative risk analysis of buildings at the municipal scale based on a rainfall triggering scenario,” Geomatics, Natural Hazards and Risk, Vol. 8, No. 2, pp. 624–648, Dec. 2017, https://doi.org/10.1080/19475705.2016.1250116
-
N. R. Regmi, J. R. Giardino, and J. D. Vitek, “Modeling susceptibility to landslides using the weight of evidence approach: Western Colorado, USA,” Geomorphology, Vol. 115, No. 1-2, pp. 172–187, Feb. 2010, https://doi.org/10.1016/j.geomorph.2009.10.002
-
H. Akinci, C. Kilicoglu, and S. Dogan, “Random forest-based landslide susceptibility mapping in coastal regions of Artvin, Turkey,” ISPRS International Journal of Geo-Information, Vol. 9, No. 9, p. 553, Sep. 2020, https://doi.org/10.3390/ijgi9090553
-
B. Pradhan, M. H. Abokharima, M. N. Jebur, and M. S. Tehrany, “Land subsidence susceptibility mapping at Kinta Valley (Malaysia) using the evidential belief function model in GIS,” Natural Hazards, Vol. 73, No. 2, pp. 1019–1042, Mar. 2014, https://doi.org/10.1007/s11069-014-1128-1
-
Y. Wang, D. Sun, H. Wen, H. Zhang, and F. Zhang, “Comparison of random forest model and frequency ratio model for landslide susceptibility mapping (LSM) in Yunyang County (Chongqing, China),” International Journal of Environmental Research and Public Health, Vol. 17, No. 12, p. 4206, Jun. 2020, https://doi.org/10.3390/ijerph17124206
-
H. Bourenane, M. S. Guettouche, Y. Bouhadad, and M. Braham, “Landslide hazard mapping in the Constantine city, Northeast Algeria using frequency ratio, weighting factor, logistic regression, weights of evidence, and analytical hierarchy process methods,” Arabian Journal of Geosciences, Vol. 9, No. 2, pp. 1–24, Feb. 2016, https://doi.org/10.1007/s12517-015-2222-8
-
A. D. Regmi et al., “Application of frequency ratio, statistical index, and weights-of-evidence models and their comparison in landslide susceptibility mapping in Central Nepal Himalaya,” Arabian Journal of Geosciences, Vol. 7, No. 2, pp. 725–742, Jan. 2013, https://doi.org/10.1007/s12517-012-0807-z
-
V. Dangol, “GIS approach to landslide hazard mapping: a case study of Syangja District in Western Nepal,” in GIS Landslide, Tokyo: Springer Japan, 2017, pp. 197–209, https://doi.org/10.1007/978-4-431-54391-6_11
-
L. Fayez, D. Pazhman, B. T. Pham, M. B. Dholakia, H. A. Solanki, and M. Khalid, “Application of frequency ratio model for the development of landslide susceptibility mapping at part of Uttarakhand state, India,” International Journal of Applied Engineering Research, Vol. 13, No. 9, pp. 6846–6854, 2018.
-
H.-J. Oh, S. Lee, and S.-M. Hong, “Landslide susceptibility assessment using frequency ratio technique with iterative random sampling,” Journal of Sensors, Vol. 2017, pp. 1–21, Jan. 2017, https://doi.org/10.1155/2017/3730913
-
M. Kannan, E. Saranathan, and R. Anabalagan, “Landslide vulnerability mapping using frequency ratio model: a geospatial approach in Bodi-Bodimettu Ghat section, Theni district, Tamil Nadu, India,” Arabian Journal of Geosciences, Vol. 6, No. 8, pp. 2901–2913, May 2012, https://doi.org/10.1007/s12517-012-0587-5
-
D. Sun, H. Wen, D. Wang, and J. Xu, “A random forest model of landslide susceptibility mapping based on hyperparameter optimization using Bayes algorithm,” Geomorphology, Vol. 362, p. 107201, Aug. 2020, https://doi.org/10.1016/j.geomorph.2020.107201
-
M. F. U. Moazzam, G. Rahman, S. Munawar, A. Tariq, Q. Safdar, and B.-G. Lee, “Trends of rainfall variability and drought monitoring using standardized precipitation index in a scarcely gauged basin of Northern Pakistan,” Water, Vol. 14, No. 7, p. 1132, Apr. 2022, https://doi.org/10.3390/w14071132
-
S. R. Meena, S. Puliero, K. Bhuyan, M. Floris, and F. Catani, “Assessing the importance of conditioning factor selection in landslide susceptibility for the province of Belluno (region of Veneto, northeastern Italy),” Natural Hazards and Earth System Sciences, Vol. 22, No. 4, pp. 1395–1417, Apr. 2022, https://doi.org/10.5194/nhess-22-1395-2022
-
T. D. Acharya, I. T. Yang, and D. H. Lee, “Gis-based landslide susceptibility mapping of Bhotang; Nepal using frequency ratio; statistical index methods,” Journal of the Korean Society of Surveying, Geodesy, Photogrammetry and Cartography, Vol. 35, No. 5, pp. 357–364, 2017, https://doi.org/10.7848/ksgpc.2017.35.5.357
-
P. B. Budha, K. Paudyal, and M. Ghimire, “Landslide susceptibility mapping in eastern hills of Rara Lake, western Nepal,” Journal of Nepal Geological Society, Vol. 50, No. 1, pp. 125–131, Dec. 2016, https://doi.org/10.3126/jngs.v50i1.22872
-
M. Onagh, V. K. Kumra, and P. K. Rai, “Landslide susceptibility mapping in a part of Uttarakashi District (India) by Multiple Linear Regression Method,” International Journal Geology, Earth and Environmental Sciences, Vol. 2, No. 2, pp. 102–120, 2012.
-
P. Kayastha, M. R. Dhital, and F. de Smedt, “Evaluation and comparison of GIS based landslide susceptibility mapping procedures in Kulekhani watershed, Nepal,” Journal of the Geological Society of India, Vol. 81, No. 2, pp. 219–231, Mar. 2013, https://doi.org/10.1007/s12594-013-0025-7
-
P. Basnet, M. K. Balla, and B. M. Pradhan, “Landslide hazard zonation, mapping and investigation of triggering factors in Phewa lake watershed, Nepal,” Banko Janakari, Vol. 22, No. 2, pp. 43–52, Dec. 2013, https://doi.org/10.3126/banko.v22i2.9198
-
J. B. Bista and K. Basnet, “Assessment of land use land cover change impact on soil loss from Phewa Lake Watershed, Pokhara, Nepal,” in Proceedings of 9th IOE Graduate Conference, Peer Reviewed, Vol. 9, 2021.
-
D. N. Rowbotham and D. Dudycha, “GIS modelling of slope stability in Phewa Tal watershed, Nepal,” Geomorphology, Vol. 26, No. 1-3, pp. 151–170, Dec. 1998, https://doi.org/10.1016/s0169-555x(98)00056-7
-
C. Vuillez, M. Tonini, K. Sudmeier-Rieux, S. Devkota, M.-H. Derron, and M. Jaboyedoff, “Land use changes, landslides and roads in the Phewa Watershed, Western Nepal from 1979 to 2016,” Applied Geography, Vol. 94, pp. 30–40, May 2018, https://doi.org/10.1016/j.apgeog.2018.03.003
-
S. Sharma. “3 killed, 1 missing in Pokhara,” The Kathmandu Post, Nepal, https://kathmandupost.com/national/2014/08/26/3-killed-1-missing-in-pokhara.
-
“Seven killed in landslides in Kaski,” https://nepaliheadlines.com/seven-killed-in-landslides-in-kaski/.
-
“Nepal landslides: Villages buried, killing at least 25 people.” The Indian Express. https://indianexpress.com/article/world/neighbours/nepal-landslides-villages-buried-killing-at-least-15-people/ (accessed Jul. 2015).
-
R. R. Baral and B. Koirala. “Devastating landslides hit Kaski villages, death toll climbs to 21,” The Himalayan Times, https://thehimalayantimes.com/nepal/landslides-hit-kaski-villages-scores-dead.
-
B. Koirala. “Seven killed in landslides at various places in Pokhara,” The Himalayan Times, https://thehimalayantimes.com/nepal/seven-killed-in-landslides-at-various-places-in-pokhara.
-
P. Bahadur Budha, P. Rai, P. Katel, and A. Khadka, “Landslide hazard mapping in Panchase mountain of Central Nepal,” Environment and Natural Resources Journal, Vol. 18, No. 4, pp. 387–399, Oct. 2020, https://doi.org/10.32526/ennrj.18.4.2020.37
About this article
We would like to give our gratitude to Dr. Krishna Prasad Bhandari, Dr. Bikash Baral (University of Helsinki, Finland), and Miss Tilisha Poudel for their assistance in compiling the data and completing our research paper. Furthermore, we want to express our appreciation to the Prince of Songkla University, Thailand for continuing support of our work. We are also grateful to the Nepalese Government Departments of Survey, Hydrology, and Meteorology, as well as to Google Earth Image and other open sources, for their precious data.
The datasets generated during and/or analyzed during the current study are available from the corresponding author on reasonable request.
BBK, NM, and KT worked together on the study's concept and design. BBK gathered the information, analyzed it, and wrote the manuscript. NM, KT, and SG made revisions and brought the manuscript to its final form.
The authors declare that they have no conflict of interest.
