Abstract
The YOLOv7-tiny algorithm does not achieve high detection accuracy for crested ibis in rainy environments. Therefore, we developed a rainy day crested ibis target detection algorithm based on YOLOv7-tiny. Firstly, the RainMix method is used to simulate the rainy day shooting data to synthesise a set of ibis dataset which is closer to the real environment. Then, the k-means algorithm is applied to re-cluster the predicted anchor frames to improve the approximation between the predicted and real frames in the output. Finally, an efficient hybrid attention mechanism (E-SEWSA) is developed and integrated into a lightweight efficient layer aggregation network, while a dense residual network reconstruction module is utilised to improve the detection accuracy of the model. In the PAN+FPN structure, the context information fusion capability of the feature aggregation part of the network is enhanced by integrating the CARAFE module instead of the up-sampling module, so as to improve the model detection accuracy. After experimental verification, the algorithm proposed in this paper has better results in rainy day ibis detection.
Highlights
- Firstly, the RainMix method is used to simulate the rainy day shooting data to synthesise a set of ibis dataset which is closer to the real environment.
- Then, the k-means algorithm is applied to re-cluster the predicted anchor frames to improve the approximation between the predicted and real frames in the output.
- Finally, an efficient hybrid attention mechanism (E-SEWSA) is developed and integrated into a lightweight efficient layer aggregation network, while a dense residual network reconstruction module is utilised to improve the detection accuracy of the model.
- In the PAN+FPN structure, the context information fusion capability of the feature aggregation part of the network is enhanced by integrating the CARAFE module instead of the up-sampling module, so as to improve the model detection accuracy.
1. Introduction
The natural habitat of the crested ibis is frequently characterized by cloudy and rainy conditions. This poses challenges for detecting and protecting the crested ibis in the wild. Moreover, encountering torrential rain may also endanger the lives and safety of personnel involved in crested ibis protection [1]. With the advancement of computer vision technology, the utilization of detection equipment for detecting and safeguarding wild ibis conserves resources and minimizes the need for human intervention in protecting ibis. However, factors such as dense fog caused by humidity in the habitat under cloudy and rainy weather, and the interference of raindrops and rain lines, increase the difficulty of detecting wild ibis using computer vision.
Facing the challenge of target detection in complex environments, researchers both domestically and internationally have initiated studies. Chen Fan et al. [2] proposed the use of a visual saliency algorithm based on graph theory to accurately intercept the face region in the image and improve the detection effect for the problem of unsatisfactory face detection due to factors such as interference from the target background. Kui Hanbing et al. [3] proposed a mesh classifier based on the fusion of history to address the low recognition rate of the intelligent car perception algorithm in urban complex environments, such as target occlusion and sudden changes in light. A trajectory-based multi-target detection and tracking algorithm is developed to achieve long-term tracking and detection of multiple targets in complex urban environments. In recent years, the target detection algorithm based on YOLO [4]-[5] has been widely adopted for its fast detection speed. Zhao Yan et al. [6] proposed a detection algorithm based on YOLOv3 [7] for the problem of infrared weak target detection in complex environments. This algorithm significantly improves upon traditional detection methods and demonstrates the effectiveness of deep learning algorithms for detecting infrared weak targets in complex environments. Zhao Hui et al. [8] introduced an enhanced recognition method for YOLOv3, incorporating the CPSX module to prevent the reuse of gradient information. They also implemented the Soft NMS algorithm to reduce missed detections in scenarios with dense fruits and optimized the loss function to balance positive and negative samples. Yuan Lei et al. [9] presented the CTC-YOLO algorithm based on YOLOv5, which includes a context transform module to leverage contextual information effectively. In addition, the algorithm incorporates an attention model in the C3 module to identify the attention region in diverse complex scenes, thereby enhancing target detection in complex environments.
All of the scholars mentioned above have studied target detection in complex environments to different extents. It has been proven that developing an ibis detection algorithm for complex environments during cloudy and rainy weather can greatly assist in monitoring and counting the number of ibises in the wild within this environment. The paper makes the following contributions: proposing an IBIS target detection algorithm based on YOLOv7-tiny, designing an attention mechanism based on Efficient-SE [10]-[11] to enhance the network's feature extraction capability, and reconfiguring the T-ELAN module to improve the model's focus on labeled information features during training and suppress interference information. Additionally, in the feature pyramid aggregation section, the CARAFE [12] model is utilized to replace the up-sampling module of YOLOv7-tiny. This substitution allows for more specific feature extraction during up-sampling, and the effectiveness of the enhanced algorithm is validated through experiments.
2. Rainy day ibis detection algorithm based on YOLOv7-tiny
2.1. RainMix-based Ibis dataset generation
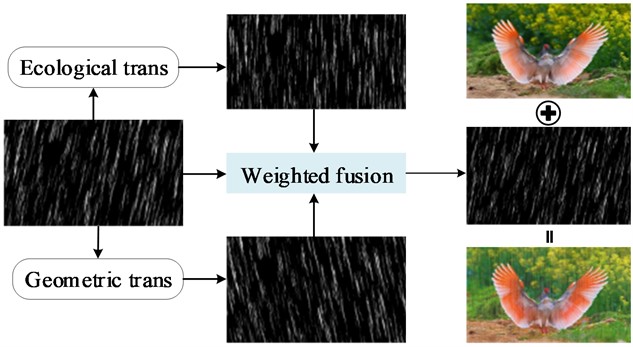
During field inspections, due to the scarcity of ibis, it is even more difficult to collect sufficient datasets of ibis under rainy weather. To address this challenge, the RainMix [13] data enhancement method was utilized to bridge the gap between synthetic rainy images and real data. Garg et al. [14] conducted a comprehensive study on rainfall appearance under different lighting and viewing conditions, resulting in a relatively realistic rain pattern dataset. Building on this work, the RainMix method accounts for natural factors like wind, light reflection, and refraction to generate more authentic rain addition images. Firstly, the rainfall map stripes are randomly sampled from the actual rainfall dataset. Then, the rain map undergoes geometric and morphological transformations through random sampling and combining operations. Finally, the transformed rain map is aggregated using the weights of the Dirichlet distribution [15] and further integrated with the original sampled rain map using the weights of the Beta distribution [16]. The implementation process is illustrated in Fig. 1.
Fig. 1RainMix synthetic band rain image
2.2. Improvement of the YOLOv7-tiny network
The YOLOv7-Tiny network has shown significant advancements in real-time detection and exhibits good detection performance. However, when the network model is directly applied to test the Crested Ibis dataset, the detection accuracy is unsatisfactory, and it struggles to distinguish the Crested Ibis. Therefore, it is crucial to redesign and train a network model that suits the ibis dataset. The real-time performance of the YOLOv7-Tiny network is one of the reasons why it was selected as the base model. To enhance the detection accuracy of its algorithm while preserving its real-time performance, a series of improvement measures were implemented in this study.
Fig. 2Improved YOLOv7-tiny network framework diagram
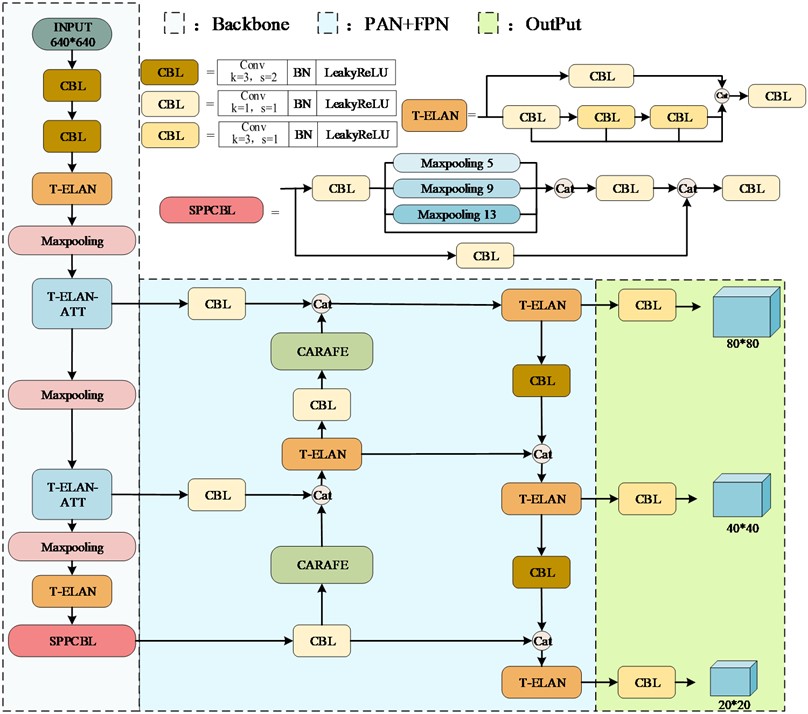
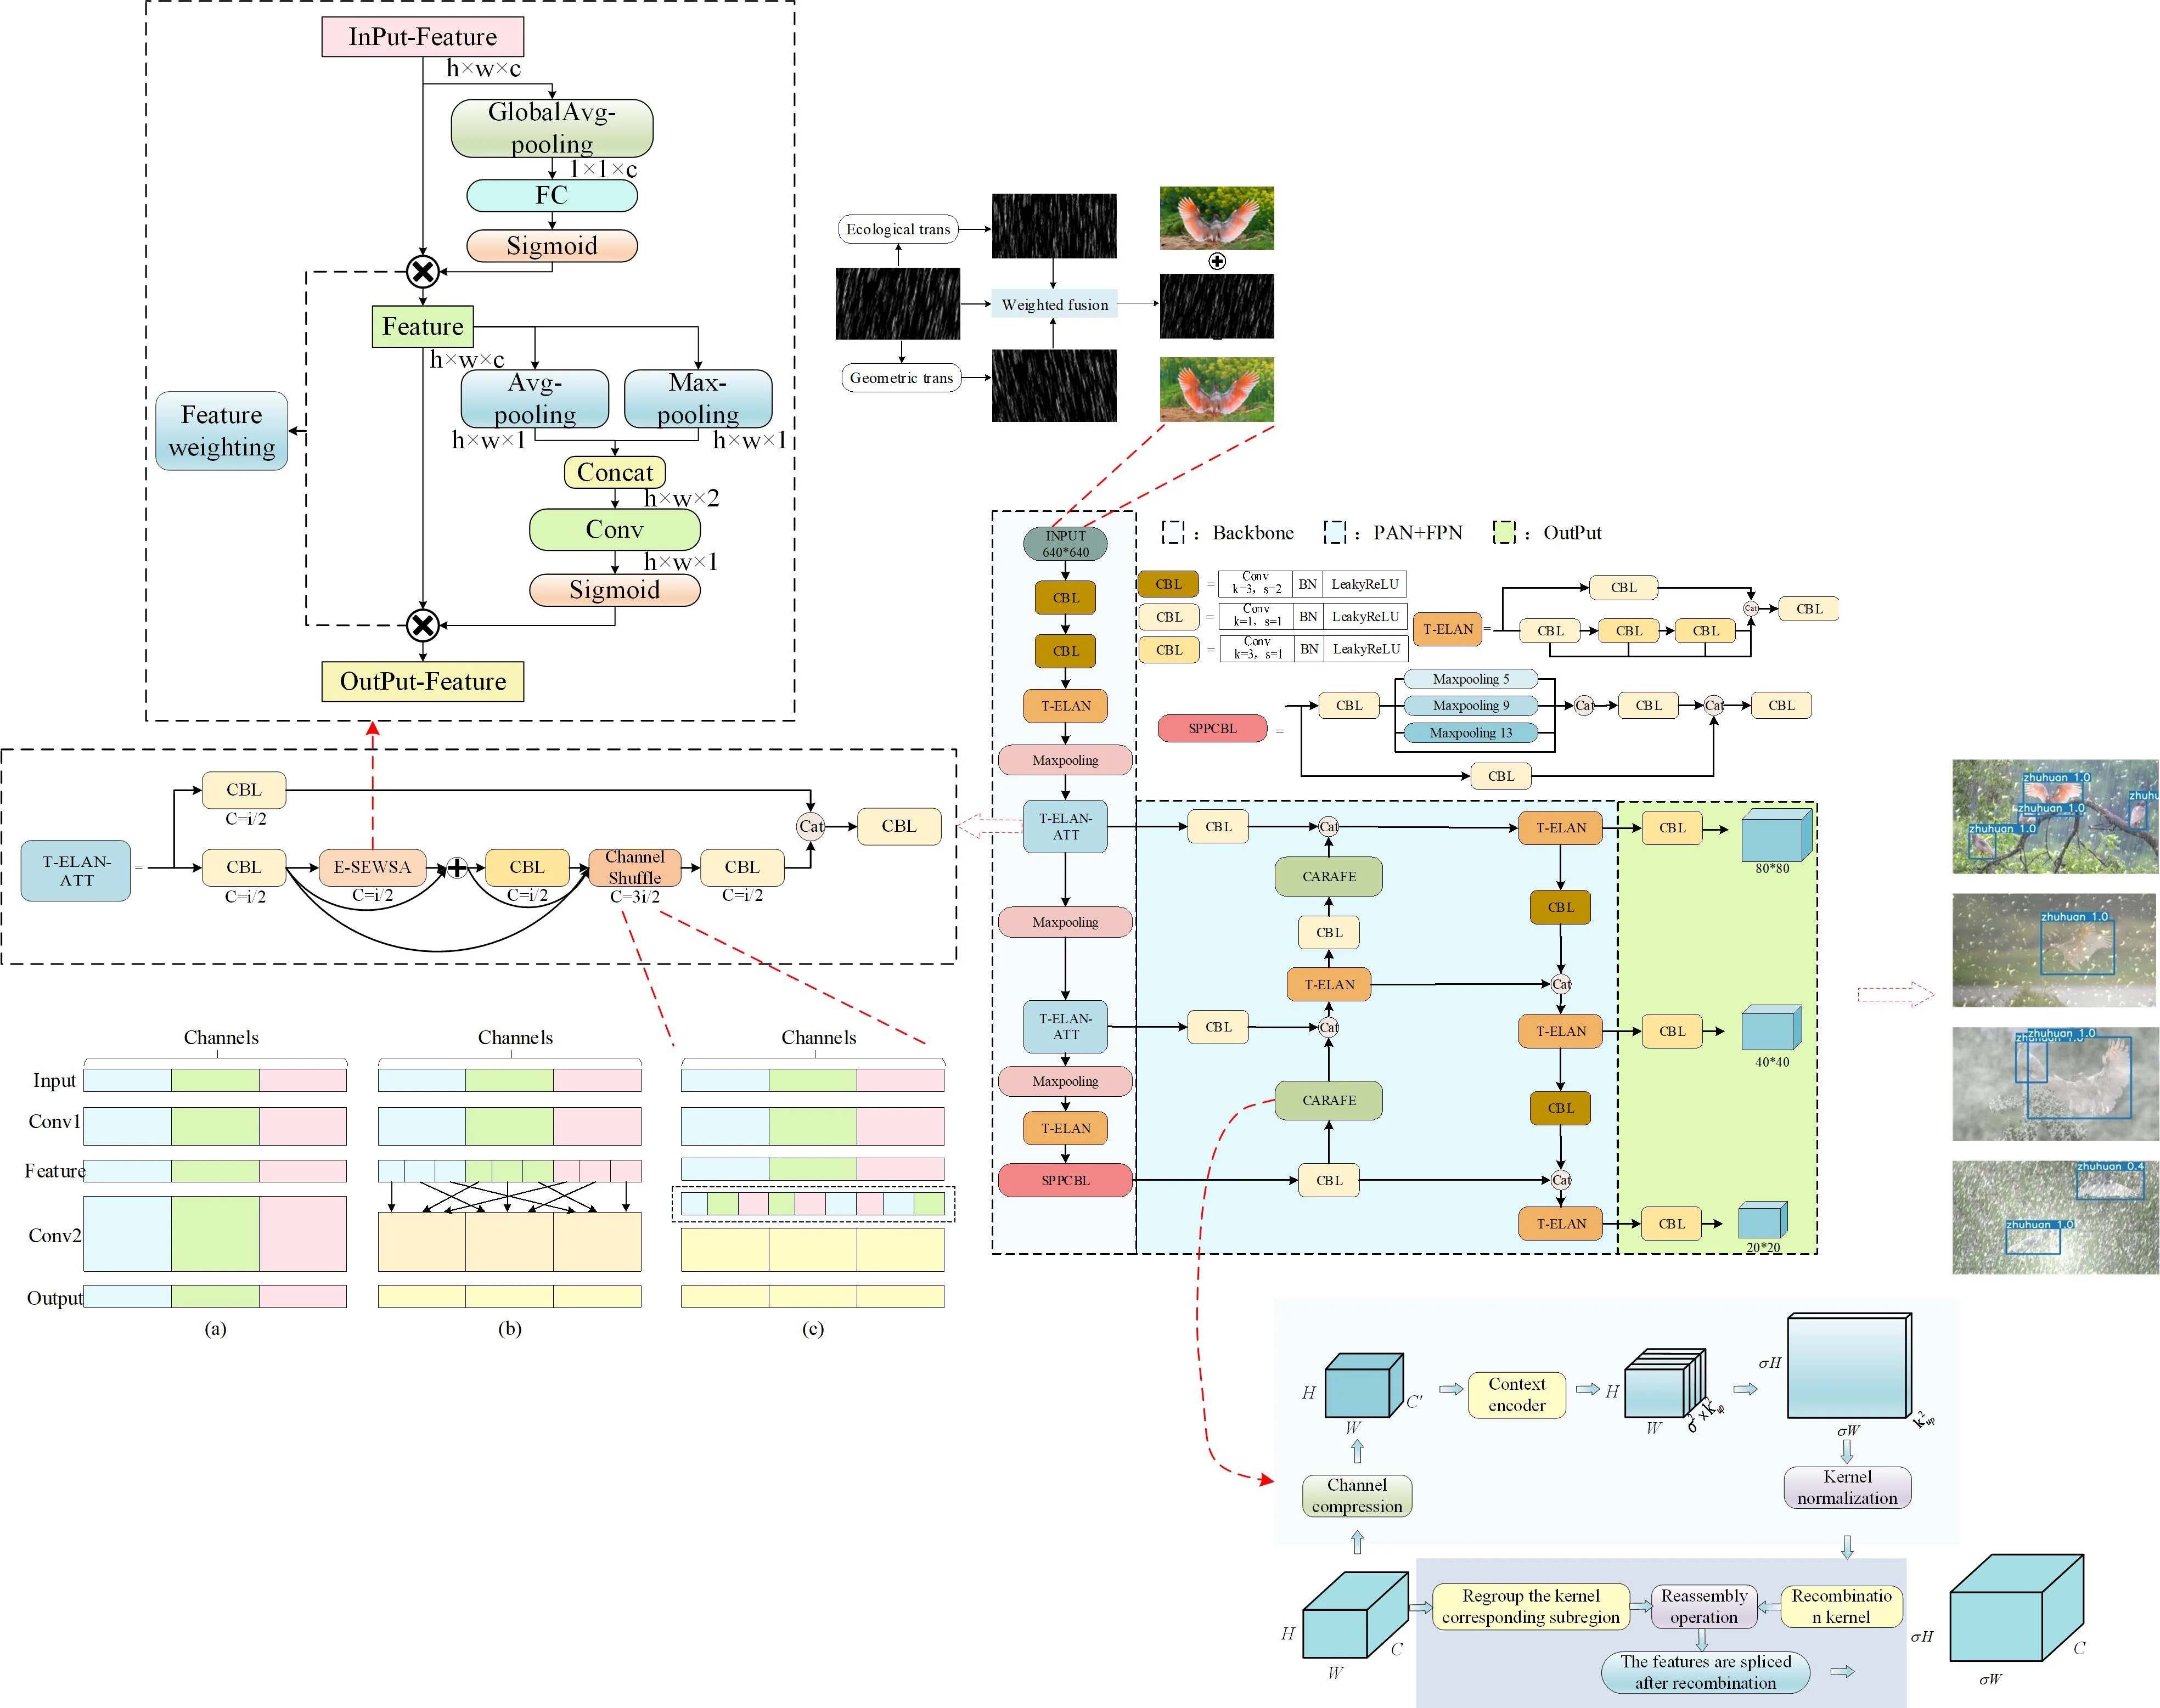
In complex detection environments, the interference of various noises significantly affects the detection performance of models trained using the YOLOv7-tiny network framework, leading to challenges in accurately capturing the desired visual features. Therefore, a proposal to enhance the YOLOv7-tiny network framework is suggested to improve the detection performance of the trained model. To enhance the feature extraction capability of the YOLOv7-tiny algorithm, the T-ELAN-ATT module is incorporated into the framework's backbone. This module integrates an attention mechanism into the basic unit of feature extraction. Additionally, to address the scale and aspect ratio imbalances in the detected objects within the homemade Crested Ibis dataset, an up-sampling module is introduced. This module predicts content-awareness weights and dynamically reorganizes awareness features in real-time (Content-Aware ReAssembly of Features, CARAFE) to refine fusion features. Furthermore, to overcome the lack of spatial attention in the SE attention mechanism integrated into the backbone feature extraction structure of the YOLOv7-tiny algorithm, the SE attention mechanism is redesigned. This redesign aims to achieve attention in both channel and spatial aspects. Attention can be achieved. The overall structure is shown in the figures. In the network, the “CBL” module remains the fundamental unit, with various colors indicating different sizes of convolution kernels and step sizes. The “T-ELAN” module, “SPPCBL” module, and “T-ELAN” module are equivalent to the YOLAN module. The “T-ELAN” module and the “SPPCBL” module follow the structure of YOLOv7-tiny. The entire network structure is divided into three parts: the “Backbone”, the “PAN+FPN”, and the “Output”. The entire network structure is divided into “Backbone”, “PAN+FPN”, and “Output”. The backbone structure consists of two 3×3 convolutional kernels with a stride of 2 and three max pooling layers to achieve five downsamplings. This process continuously enhances feature extraction. Additionally, two T-ELAN-ATT modules are interspersed to focus more on extracting features from the annotated objects. The structure of the feature aggregation part and the output part remains unchanged. The modules mentioned in the figure are presented in this section sequentially.
2.2.1. E-SEWSA efficient mixed attention module design
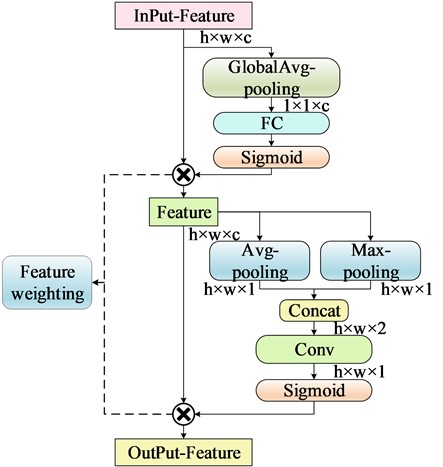
The attention mechanism can enhance the feature extraction performance of the network. To introduce the attention mechanism in the lightweight YOLOv7-tiny network without increasing the burden on the network, the Efficient Squeeze-and-Excitation (E-SE) module is added to the trunk part of the network. This enhances the trunk's ability to focus on the information of the labeled images during down sampling. Focusing. However, the E-SE module only focuses on the channel level and lacks attention at the spatial level. Therefore, the E-SE module is enhanced by incorporating a spatial attention mechanism, known as Efficient Squeeze-and-Excitation with Spatial Attention (E-SEWSA), and the specific operation is illustrated in the Fig. 3, where h is the height of the input feature, w is the width of the input feature, c is the number of channels in the input feature, and d is the depth of the input feature. The width, and c represents the number of channels of the input feature. The upper input features are connected to the spatial attention in series after E-SE. Firstly, the input feature map undergoes global average pooling (GlobalAvg-pooling) along the channel direction. The channel attention is obtained after a full connection and sigmoid activation [17]. Subsequently, the output feature map is obtained by globally weighting with the input feature map along the channel direction. The output feature map is then obtained by applying global weighting on the channel attention. Next, the output feature map is weighted globally with the input feature map along the channel direction to obtain the final output feature map. Max-pooling and Avg-pooling are then performed along the spatial direction to obtain the channel attention. The output feature map is downscaled to a single channel by 1×1 convolution after stitching the obtained feature maps. Finally, the spatial attention is obtained through sigmoid activation. Spatial attention redistributes weights at the spatial level to the feature maps obtained after channel attention. The number of input channels and the size of the output feature maps obtained after the E-SEWSA module remain unchanged. Therefore, the addition of this module to the backbone network does not affect the overall structure of the Feature Pyramid Networks (FPN [18]) and Pixel Aggregation Network (PAN [19]). It also does not introduce an excessive number of parameters or computations.
As a concatenated channel and spatial attention mechanism, the calculation can be divided into two steps. For the channel part, refer to Eq. (1):
where F' represents the output features, F is the input features, Gp[F(H,W)] represents global average pooling of spatial features, fc() represents full connectivity, σ() represents the use of a sigmoid activation function, and the dot product represents the multiplication of the weights generated by the activation with the spatial features of the corresponding channel.
In the second step, the features of channel attention output are taken as the input features for spatial attention. The formula is shown in Eq. (2):
where, F'' is the output feature, F' is the input feature, Ap(F'[c]) represents the average pooling of features along the channel direction, Mp(F'[c]) represents the maximum pooling of features along the channel direction, [,] represents the channel splicing operation, Con() represents the 1×1 convolution operation, σ() represents the use of sigmoid activation function, and dot multiplication represents the multiplication of the weight generated after activation with the corresponding spatial channel feature.
Fig. 3E-SEWSA attention mechanisms
2.2.2. T-ELAN-ATT module design based on the T-ELAN module
The structural principle of the T-ELAN module in the YOLOv7-tiny network utilizes a highly stacked 3×3 convolution. While this design ensures the network's learning capability, it has a wide learning scope and lacks the ability to concentrate on specific learning tasks. Consequently, the network may learn irrelevant features that should be disregarded. When the importance of the image features in the labeled box is not sufficiently differentiated from the image features in the background, the detection accuracy of the model will decrease, thereby affecting the overall detection performance of the model. Therefore, this study incorporates the attention mechanism into the structure of the T-ELAN module, as shown in Fig. 4.
Fig. 4T-ELAN-ATT structure schematic diagram
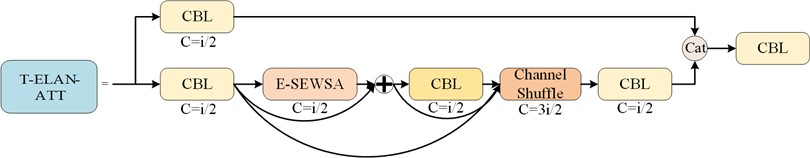
The module, after incorporating the attention mechanism, still considers the channel coherence of the entire YOLOv7-tiny network to ensure consistency in the number of input and output channels, thus preventing model distortion and deformation. First, the input feature channels are split into equal parts. Part of the features are retained in their original form to prevent gradient disappearance caused by excessive attention. The other part of the features is constructed using the concept of a dense residual network. These features are then transmitted to the E-SEWSA module, the 3×3 CBL module, and the channel shuffling module, respectively. The features outputted by the E-SEWSA module are also sent to the channel mixing module. Subsequently, the features undergo channel mixing followed by channel compression. Finally, the compressed features are combined with another portion of the original features and integrated into the backbone network. The channel mixing and merging module is shown in Fig. 5.
Fig. 5Example of channel mixing and merging: a) is the feature extraction channel in the normal case, and there is no intersection between each channel; b) is the channel mixing process; c) is the feature extraction process after channel mixing and merging, and the dashed box represents the channel mixing and merging sample
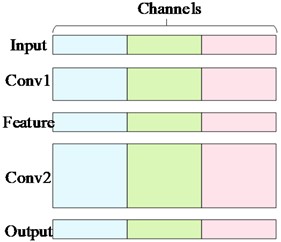
a)
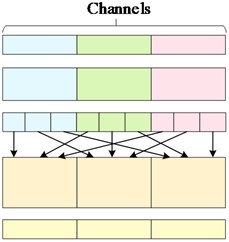
b)
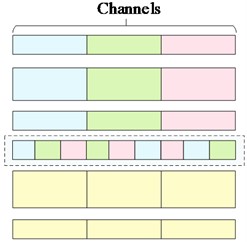
c)
2.2.3. CARAFE content-aware reorganisation module
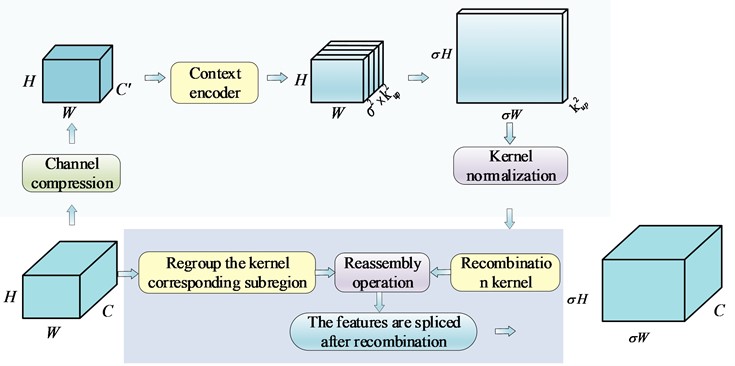
YOLOv7-tiny utilizes Bilinear Interpolation [20] for up-sampling to extract high-resolution feature maps. This method determines the up-sampling kernel solely based on the spatial position of the pixel points, without utilizing the semantic information of the feature maps. As a result, the perceptual domain is limited. On the other hand, the content-aware reorganization module (CARAFE) offers a larger perceptual domain and the ability to aggregate contextual information within that domain. CARAFE consists mainly of a kernel prediction module and a content-aware feature restructuring module. The feature map can more accurately represent the object’s shape after up-sampling by CARAFE, enhancing its recognition ability. The content-aware prediction model is illustrated in Fig. 6.
The CARAFE module achieves a weighted combination of features by reassembling features in a predefined region with multiple sets of weights generated using a context-aware approach at each spatial location. This results in up-sampled weights that are weighted. The up-sampling of features is completed by rearranging the generated features into a spatial block. It is important to note that the spatially adaptive weights are not learned as network parameters but are predicted in real-time by a lightweight fully convolutional module and Softmax activation function. The kernel prediction module of CARAFE comprises three parts: a channel compression module, a content encoder, and a kernel normalization module. The channel compression module utilizes 1×1 convolutional compression to decrease the channels of the input feature maps. The content encoder processes the compressed feature maps to encode the content and produce the recombination kernels. The kernel normalization module employs the Softmax function on each recombination kernel for activation. The content-aware restructuring module then weights each target restructured region with the weights obtained by the kernel prediction module, and then stitches together all the restructured target regions N(Xl,k), where Xl represents the location of the centre of the target region of the feature map, and k represents the edge length of the target region on the feature map.
Fig. 6Content-aware reassembly of features module. The light blue region represents the kernel prediction module, where σ and kup denote the upsampling rate and the size of the recombination kernel, with manually set parameters of 2 and 5, respectively. The light purple region represents the content recombination module, which utilizes the recombination kernel to weigh the corresponding input features
When the input is a feature map F=C×W×H, the output after CARAFE module is F'=C×σH×σW, where σ is the customized upsampling ratio. Firstly, when the input passes through the kernel prediction module, the specific formula is shown in Eq. (3):
where Wl' is the predicted kernel, φ is the nuclear forecasting module, N(Xl,kencoder) represents the subregion of kencoder×kencoder centred on Xl. where kencoder=kup-2 (kup is a custom parameter representing the size of the reorganisation kernel).
Then, the prediction kernel is fed into the content reorganisation module to obtain the up-sampling output module operation equation shown in Eq. (4):
where X'l' is the output feature after completing the up-sampling, ϕ represents the content-aware restructuring module, and N(Xl,kup) represents the subregion of kup×kup centred on Xl corresponding to the predictive restructuring kernel.
3. Experiment and analysis
3.1. Experimental training environment and training methods
The experimental training and test environment uses the Ubuntu 18.04 LTS operating system, NVIDIA GeForce RTX3080Ti, i7-6700, 64GB of memory, and PyTorch 2.0.0 deep learning framework. The training optimizer utilizes Stochastic Gradient Descent (SGD [21]), which helps prevent the issue of local optimization in the model, leading to lower final accuracy. The initial learning rate of the training network is set to 0.01. The learning rate momentum factor is set to 0.937, the weight attenuation coefficient is set to 0.0005, the batch size is set to 16, and the training number is set to 300 rounds. The input strategy involves maintaining the Mosaic data enhancement processing of YOLOv7-tiny. It includes random scaling, random cropping, random arrangement, and splicing of input images before feeding them into the network for training.
3.2. Performance evaluation index
In this paper, general performance evaluation indices for target detection are utilized, including model parameters, computational load, Precision (P), Recall (R), and mean Average Precision (mAP) of test samples. It has two test standards: the average accuracy obtained when the threshold value of Intersection Over Union (IOU) is 0.5 to detect whether the target is correct, denoted as mAP@0.5; and the accuracy obtained when the threshold value of IOU is 0.5~0.95 by averaging 10 accuracy scores at regular intervals. Written as mAP@0.5:0.95, the former provides an intuitive view of the potential impact in practical applications, while the latter offers a more in-depth evaluation of network performance. Using Recall as the horizontal axis and Precision as the vertical axis, a Precision-Recall (P-R) curve is plotted, and the area under the curve is calculated as AP (average precision) by integrating it. The expression is as follows:
Precision:
Recall:
Mean accuracy:
Among them, when TP is the actual positive sample and the computer predicts it correctly during training; when FP is the actual negative sample and the computer incorrectly predicts it as positive; FN is the actual positive sample but the computer predicts it as negative; TN is the actual negative sample and the computer predicts it correctly.
3.3. Ablation contrast experiments and visual contrast performance
In order to evaluate the benefits and limitations of the improvement strategy proposed in this paper compared to the current mainstream algorithms, side-by-side comparison experiments were designed. These experiments were conducted using the self-constructed Crested Ibis dataset, without utilizing any official pre-training models. Firstly, it is compared and analyzed with the baseline algorithm YOLOv7-tiny. Secondly, it is compared and analyzed with algorithms of the same scale, such as YOLOv5s, YOLOv8s, etc. Finally, it is compared and analyzed with the same large-scale model of YOLOv7 with convolutional stacking. The experimental results are shown in Table 1.
Table 1 demonstrates that the enhanced algorithm proposed in this paper can achieve a detection accuracy of 91.8 % when the bounding box overlap requirement is not high. The detection accuracy gradually decreases as the bounding box overlap requirement increases. The mAP@0.5:0.95 decreases to 71.1 %. This study emphasizes category accuracy identification. It is predicted that detection results are not significantly affected when the bounding box slightly overlaps the real box. Compared to the YOLO series lightweight algorithm, the model parameters and algorithm computation do not overflow excessively. In comparison to YOLOv5s and YOLOv8s, there is a certain advantage in lightweight. Simultaneously, the improved model’s detection performance is significantly enhanced, with the mAP@0.5:0.95 being 16.5 % higher than YOLOv5n, 9.5 % higher than YOLOv5s, and 7 % higher than YOLOv8s. The detection accuracy of the improved algorithm is higher than that of YOLOv8n by 3.2 % and higher than YOLOv8s. In comparison to the larger models YOLOv7 and YOLOv7x, the improved algorithm achieves better detection performance while reducing the number of model parameters by approximately 30.9M and 64.5M, respectively. This reduction significantly decreases the computational requirements on the device, ensuring smooth operation of the improved model on mobile devices, making it more suitable for practical detection needs. At the same time, the recall of the enhanced model has increased by 12.7 % compared to Yolov7-tiny. This suggests that the refined algorithm enhances the prediction accuracy of positive samples in real-world scenarios. Moreover, the mAP@0.5 has increased by 10.2 % and mAP@0.5:0.95 has increased by 19.2 %, demonstrating the effectiveness of the enhanced method.
Table 1Results of the cross-comparison experiment
Models | Parameters | GFLOPs | P% | R% | mAP@0.5% | mAP@0.5:0.95% |
YOLOv7-tiny | 6.010M | 12.70 | 90.9 | 73.0 | 81.6 | 51.9 |
YOLOv5n | 1.765M | 4.20 | 90.1 | 71.6 | 83.1 | 54.6 |
YOLOv5s | 7.022M | 15.90 | 88.3 | 79.3 | 86.0 | 61.6 |
YOLOv8n | 3.011M | 8.20 | 92.8 | 74.2 | 85.1 | 64.1 |
YOLOv8s | 11.13M | 28.60 | 90.3 | 77.5 | 86.2 | 67.9 |
YOLOv7 | 37.19M | 105.10 | 91.0 | 81.1 | 87.7 | 65.6 |
YOLOv7x | 70.81M | 188.90 | 89.9 | 76.4 | 82.6 | 58.4 |
Ours | 6.225M | 13.72 | 92.5 | 85.7 | 91.8 | 71.1 |
In order to further validate the robustness and generalization of the algorithms in this chapter, the network model proposed in this paper is experimented on the public dataset MSCOCO [22], while leveraging the official pre-training weights to expedite the training process. This paper utilizes the COCO2017 version, a comprehensive dataset comprising 80 categories. It includes 118,287 training images, 5,000 validation images, and 40,670 test images. The dataset consists of approximately 41 % small targets, 34 % medium targets, and 24 % large targets. Therefore, employing the COCO dataset for testing the algorithm's robustness and generalization in this paper adds credibility. has some credibility. Table 2 presents the test results of the algorithms discussed in this chapter alongside the current mainstream algorithms on the public dataset COCO. The training parameters of the network model in this paper are configured in a similar manner to those in the previous paper. The “default” entry indicates that the corresponding data is not available in the public dataset.
Table 2Cross-sectional comparison experiments on the MS COCO dataset
Models | Input | Parameters | FLOPs | mAP@0.5% | mAP@0.5:0.95% |
YOLOv7-tiny-SiLU [23] | 640×640 | 6.2M | 13.8G | 56.7 | 41.7 |
YOLOv7 [23] | 640×640 | 36.9M | 104.7G | 69.7 | 51.4 |
EfficientDet-D1 [24] | 640×640 | 6.6M | 6.1B | 59.1 | – |
DETR [25] | 640×640 | 41M | 86G | 62.4 | 44.2 |
CenterNet [26] | 511×511 | – | – | 64.5 | 50.7 |
Retina Net [27] | 640×640 | – | – | 61.1 | 44.1 |
Mask R-CNN [28] | – | – | – | 62.3 | 43.4 |
Ours | 640×640 | 6.225M | 13.72G | 64.5 | 49.7 |
Table 2 presents the experimental results indicating that the enhanced algorithm performs competitively in average detection accuracy at an IOU threshold of 0.5 when compared to the contemporary network model. Text: ### Compared with the YOLOv7-tiny model using the SiLU activation function, the model in this paper shows a 7.8 % increase in mAP@0.5 and an 8 % increase in mAP@0.5:0.95 for similar size and arithmetic. In comparison with the YOLOv7 network model, there is only a 1.7 % decrease in mAP@0.5:0.95 in terms of detection accuracy, indicating that the improved model closely matches the large model in detection ability. When compared with the lightweight network algorithm EfficientDet-D1, despite differences in model parameters and computation, the mAP@0.5 is 5.4 percentage points higher. In comparison with the two-stage detection algorithm Mask R-CNN during the same period, the improved algorithm, as a disadvantaged single-stage detection algorithm, still demonstrates an advantage in detection accuracy. Compared with the single-stage detection algorithms DETR and RetinaNet during the same period, the mAP@0.5:0.95 is improved by 5.5 % and 5.6 %. ### Respectively, when the input image is 511×511 pixels, the mAP@0.5:0.95 loss is only 1 percentage point compared to the CenterNet network, demonstrating the effectiveness of the enhanced method.
After analyzing the impact of the enhanced network model compared to the current mainstream algorithmic model, longitudinal comparison experiments were conducted on a self-constructed Ibis dataset to explore the relationships between the improved methods discussed in this paper. YOLOv7-tiny is used as the baseline to test the effects of different modules on the overall algorithm. Considering the varying dataset sample sizes classified differently during the experiment, the prediction anchor frames were reclassified using the K-means clustering method on the self-built dataset in this paper. Therefore, the ablation experiment also took this aspect into consideration. By integrating different modules, the test compared the model parameters' indicators, including GFLOPs, accuracy, recall, and average detection precision. The specific results are shown in Table 3.
Table 3Longitudinal comparison test results
Models | Parameters | GFLOPs | P% | R% | mAP@0.5% | mAP@0.5:0.95% |
YOLOv7-tiny | 6.010M | 12.70 | 90.9 | 73.0 | 81.6 | 51.9 |
v7-tiny+k-means | 6.010M | 12.70 | 91.5 | 76.5 | 85.4 | 58.2 |
v7-tiny+CARAFE | 6.053M | 13.30 | 90.0 | 77.1 | 83.6 | 54.5 |
v7-tiny+T-ELAN-ATT | 6.107M | 13.12 | 88.4 | 79.1 | 83.5 | 56.0 |
v7-tiny+k-means+CARAFE | 6.053M | 13.30 | 87.5 | 80.1 | 85.8 | 58.5 |
v7-tiny+CARAFE+T-ELAN-ATT | 6.225M | 13.72 | 90.6 | 84.2 | 89.8 | 66.5 |
v7-tiny+k-means+T-ELAN-ATT | 6.107M | 13.12 | 91.6 | 76.3 | 84.7 | 58.8 |
v7-tiny+k-means+CARAFE+T-ELAN-ATT | 6.225M | 13.72 | 92.5 | 85.7 | 91.8 | 71.1 |
Table 3 demonstrates that the detection results of the self-built dataset in this paper significantly improved by using k-means to re-cluster the predicted anchor frames during YOLOv7-tiny training. The parameters and computational volume remained unaffected, while the precision increased by 0.6 percentage points, the recall by 3.5 percentage points, the mAP@0.5 by 3.8 %, and the mAP@0.5:0.95 by 6.3 %. This indicates that the predicted anchor frames align more closely with the labeled real frames in the self-built dataset after the k-means re-clustering. Clustering, the predicted anchor frames are closer to the labeled true frames of the self-constructed dataset. After introducing the CARAFE module, the model’s recall is increased by 4.1 percentage points, demonstrating an improvement in the model’s ability to detect positive samples in the real environment. Following the integration of the T-ELAN-ATT module, the model’s average detection precision is significantly enhanced, and the recall is increased by 6.1 percentage points. However, the accuracy is decreased by 2.5 percentage points, indicating that the introduction of the E-SEWSA attention mechanism in the backbone enhances the model's feature extraction capability but slightly impacts the prediction accuracy. The mAP@0.5:0.95 increases by 4.1 %, confirming the effectiveness of the module in enhancing the overall performance of the network model. Comparing the CARAFE module and the enhanced E-SE module after the integration of k-means, it is evident that the mAP@0.5:0.95 has increased to varying extents. This validates a beneficial correlation between the k-means re-clustering prediction anchor frames and the module's introduction. However, the recall rate diminishes when combined with the T-ELAN-ATT module. Furthermore, due to experimental constraints, the combination with other attentional mechanisms has not been explored. Due to limitations in experimental conditions, we did not conduct experiments combining other attention mechanisms. We speculate that re-predicting the anchor frame may cause the attention mechanism to focus on a broader sensory field. However, the feature fusion part may not be contextually connected, leading to incomplete filtering of the prediction frame. The recall rate of the CARAFE module combined with the T-ELAN-ATT module increased significantly. This demonstrates that the integration of these two enhanced methods refines the feature extraction capability of the T-ELAN-ATT module and the CARAFE module, allowing the network to effectively learn the target within the actual frame. The network can learn the personality characteristics of the target samples in the real frame and filter the accurate prediction frame by linking the context. Finally, by combining the three methods of improvement, the optimal network model is achieved, with only a 0.215M increase in parameters, a 10.2 % increase in mAP@0.5, and a 19.2 % increase in mAP@0.5:0.95. This demonstrates that the enhanced network framework enhances the extraction of features from the actual labeled data and improves the similarity between predicted frames and real frames, thereby enhancing the model's detection performance.
In order to clearly demonstrate the effectiveness of incorporating the Attention Mechanism module in this chapter, a visualization experiment of the E-SEWSA Attention Mechanism was conducted, and the results of the experiment are presented in Fig. 7. From the figure, it can be clearly seen that after adding the E-SEWSA attention mechanism, the attention dispersed on the whole picture is concentrated into the calibrated box, and the highlighted part represents giving more attention. There is still some distraction after using the attention mechanism, which is unavoidable and within acceptable limits, proving the effectiveness of the attention module proposed in this chapter.
Fig. 7Comparative effectiveness of attention mechanisms: a) represents the original image; b) represents the attention heat map generated without adding the E-SEWSA attention mechanism; and c) represents the attention heat map generated with the addition of the E-SEWSA attention mechanism

a)
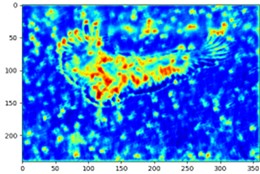
b)
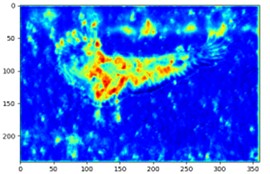
c)
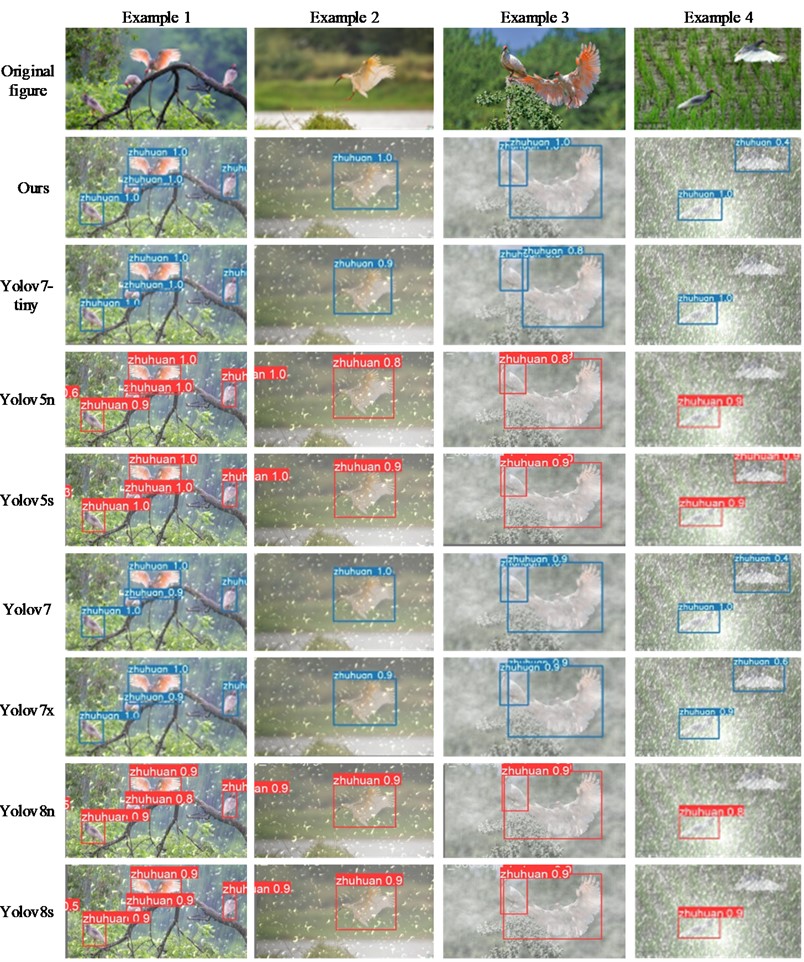
The training test comparison graph between the improved algorithm proposed in this paper and different algorithms of YOLO series is shown in Figure 8. From the figure, we can visually compare the advantages of the improved algorithms in this paper in terms of detection accuracy as well as bounding box precision, especially comparing the YOLOv7-tiny model, the detection targets lost under the interference of stormy weather environments can be accurately framed, and at the same time, there are different degrees of improvement compared to the other algorithms of different versions of the YOLO series, such as the YOLOv5n model, YOLOv8n model and YOLOv8s model. In the rain line, raindrop and fog environment with slight occlusion, compared with the YOLOv7-tiny model, the prediction frames of the improved model in this paper are obviously more accurate, and compared with the relatively larger models YOLOv7 and YOLOv7X, the small difference in prediction frames is difficult to compare intuitively, which proves that the improved model is very close to or even exceeds the larger models in terms of detection accuracy. Also comparing the more advanced YOLOv8 series models of the same magnitude, the improved algorithms in this paper also show obvious advantages in cloudy and rainy weather environments. Compared with YOLOv5n and v5s, there are also different degrees of improvement. Compared with other YOLO series algorithms, the improvement of this paper makes the algorithm detect the effect of intuitive observation and predict the anchor frames more accurately, and the detection accuracy is significantly improved compared with YOLOv7-tiny, and the detection results are similar compared with YOLOv7, which proves the validity of the improved method in this paper.
Fig. 8Test chart of different algorithm training
4. Conclusions
The improved algorithmic model in this paper solves the problem that the YOLOv7-tiny algorithm is unable to identify the ibis target effectively under rainy weather environment. By adding the E-SEWSA attention mechanism and using the CARAFE up-sampling module, the network is able to extract the feature information obtained from the convolution more fully and accurately during the training process. After experiments, it is found that the improved algorithm model in this paper is better than the Yolov7-tiny algorithm in recognising ibis targets in complex environments such as rainy days and occlusion, reaching 91. 8% in mAP@0.5 and 71.1 % in mAP@0.5:0.95. However, the model still has a lot of compression space to further compress the improved algorithmic model to adapt to run efficiently on mobile devices.
References
-
W. Chao et al., “Population size and distribution of the wild crested ibis,” (in Chinese), Journal of Zoology, Vol. 49, No. 5, pp. 666–671, 2014.
-
F. Chen, Y. Tong, and X. H. Cao, “Visual saliency-based face target detection in complex environments,” (in Chinese), Computer Technology and Development, Vol. 27, No. 1, pp. 48–52, 2017.
-
H. B. Kui et al., “Multi-target detection and tracking algorithm for smart car urban complex environment by fusing historical trajectories,” (in Chinese), Journal of Xi’an Jiaotong University, Vol. 52, No. 10, pp. 132–140, 2018.
-
J. Redmon, S. Divvala, R. Girshick, and A. Farhadi, “You only look once: Unified, real-time object detection,” in 2016 IEEE Conference on Computer Vision and Pattern Recognition (CVPR), pp. 779–788, Jun. 2016, https://doi.org/10.1109/cvpr.2016.91
-
P. Jiang et al., “A Review of Yolo algorithm developments,” Procedia Computer Science, Vol. 199, pp. 1066–1073, 2022.
-
Y. Zhao, L. Liu, and L. J. Zhao, “Complex environment infrared weak target detection based on YOLOv3,” (in Chinese), Aviation Arms, Vol. 26, No. 6, pp. 29–34, 2019.
-
J. Redmon and A. Farhadi, “Yolov3: An incremental improvement,” arXiv:1804.02767, 2018.
-
H. Zhao et al., “Apple fruit recognition in complex environment of orchard based on improved YOLOv3,” (in Chinese), Journal of Agricultural Engineering, Vol. 37, No. 16, pp. 127–135, 2021.
-
L. Yuan et al., “Improved YOLOv5 road target detection method for complex environment,” (in Chinese), Computer Engineering and Application, Vol. 59, No. 16, pp. 212–222, 2023.
-
A. Vaswani et al., “Attention is all you need,” in Advances in Neural Information Processing Systems, 2017.
-
J. Hu, L. Shen, S. Albanie, G. Sun, and E. Wu, “Squeeze-and-excitation networks,” IEEE Transactions on Pattern Analysis and Machine Intelligence, Vol. 42, No. 8, pp. 2011–2023, Aug. 2020, https://doi.org/10.1109/tpami.2019.2913372
-
J. Wang, K. Chen, R. Xu, Z. Liu, C. C. Loy, and D. Lin, “CARAFE: content-aware reassembly of features,” 2019 IEEE/CVF International Conference on Computer Vision (ICCV), Oct. 2019, https://doi.org/10.1109/iccv.2019.00310
-
Q. Guo et al., “EfficientDeRain: learning pixel-wise dilation filtering for high-efficiency single-image deraining,” in 35th AAAI Conference on Artificial Intelligence, 2021.
-
K. Garg and S. K. Nayar, “Photorealistic rendering of rain streaks,” ACM SIGGRAPH 2006 Papers, Jan. 2006, https://doi.org/10.1145/1179352.1141985
-
T. Minka, “Estimating a Dirichlet distribution,” 2000.
-
J. B. Mcdonald and Y. J. Xu, “A generalization of the beta distribution with applications,” Journal of Econometrics, Vol. 66, No. 1-2, pp. 133–152, 1995.
-
D. J. Finney, “Probid analysis: a statistical treatment of the sigmoid response curve,” Annals of the Entomological Society of America, Vol. 45, No. 4, 1952, https://doi.org/10.1093/aesa/45.4.686
-
T.-Y. Lin, P. Dollar, R. Girshick, K. He, B. Hariharan, and S. Belongie, “Feature pyramid networks for object detection,” 2017 IEEE Conference on Computer Vision and Pattern Recognition (CVPR), Jul. 2017, https://doi.org/10.1109/cvpr.2017.106
-
S. Liu, L. Qi, H. Qin, J. Shi, and J. Jia, “Path aggregation network for instance segmentation,” 2018 IEEE/CVF Conference on Computer Vision and Pattern Recognition (CVPR), Jun. 2018, https://doi.org/10.1109/cvpr.2018.00913
-
E. J. Kirkland and E. J. Kirkland, “Bilinear interpolation,” Advanced Computing in Electron Microscopy, pp. 261–263, 2010.
-
N. Ketkar and N. Ketkar, “Stochastic gradient descent,” Deep learning with Python: A hands-on introduction, pp. 113–132, 2017.
-
T. Y. Lin et al., “Microsoft coco: common objects in context,” in Computer Vision-ECCV 2014: 13th European Conference, Vol. 13, pp. 740–755, 2014.
-
C.-Y. Wang, A. Bochkovskiy, and H.-Y. M. Liao, “YOLOv7: Trainable bag-of-freebies sets new state-of-the-art for real-time object detectors,” arXiv:2207.02696, Jan. 2022, https://doi.org/10.48550/arxiv.2207.02696
-
M. Tan, R. Pang, and Q. V. Le, “EfficientDet: scalable and efficient object detection,” in 2020 IEEE/CVF Conference on Computer Vision and Pattern Recognition (CVPR), Jun. 2020, https://doi.org/10.1109/cvpr42600.2020.01079
-
N. Carion et al., “End-to-end object detection with transformers,” in Computer Vision-ECCV 2020: 16th European Conference, Glasgow, UK, August 23-28, 2020, Proceedings, Part I, Vol. 16, pp. 213–229, 2020.
-
K. Duan, S. Bai, L. Xie, H. Qi, Q. Huang, and Q. Tian, “CenterNet: keypoint triplets for object detection,” arXiv:1904.08189, Jan. 2019, https://doi.org/10.48550/arxiv.1904.08189
-
T.-Y. Lin, P. Goyal, R. Girshick, K. He, and P. Dollar, “Focal loss for dense object detection,” IEEE Transactions on Pattern Analysis and Machine Intelligence, Vol. 42, No. 2, pp. 318–327, Feb. 2020, https://doi.org/10.1109/tpami.2018.2858826
-
K. He et al., “Mask r-cnn,” in Proceedings of the IEEE International Conference on Computer Vision, pp. 2961–2969, 2017.
About this article

The authors have not disclosed any funding.
The datasets generated during and/or analyzed during the current study are available from the corresponding author on reasonable request.
Jun-Lin Huang is primarily responsible for enhancing the algorithm, conducting experimental training of the model, planning the research content, and writing the paper. Peng-Chao Zhang is primarily responsible for the research findings and paper revisions. Jia-Jun Zhang is responsible for resolving errors that occur during the execution of the algorithm. Yue Kai and Zhi-Miao Guo are responsible for shooting the dataset and preprocessing the images.
The authors declare that they have no conflict of interest.
