Abstract
Understanding the potential distribution in liquids is critical due to its significant differences from general media. The main problem addressed in this research is the lack of clarity on how electrode polarization affects potential distribution in liquid electrolytes. To investigate this, we experimentally measured the potential distribution characteristics in liquids under DC and AC voltages, explaining the variability through electrode polarization theory. Our action included introducing electrode polarization potential correction in COMSOL software simulations, which showed strong agreement with our experimental results. Further, we investigated the potential distribution characteristics in Na2SO4 solutions with varying concentrations, using ionic potential to explain voltage formation inside the liquids. The results highlight the improved accuracy in modeling potential distributions in liquid electrolytes, which is significant for advancing various electrochemical processes.
Highlights
- Experimental Investigation of Potential Distributions in Liquids – This study explores the characteristics of potential distributions under DC and AC voltages, highlighting differences from general media and analyzing them through electrode polarization theory.
- Validation through Simulation with Electrode Polarization Correction – A correction for electrode polarization potential was introduced in COMSOL simulations, achieving close agreement between experimental and simulated results.
- Impact of Ionic Concentration on Potential Distributions – The research examines potential distribution characteristics in Na₂SO₄ solutions of varying concentrations, providing insights into the role of ionic potential in voltage formation within liquids.
1. Introduction
The plotting of equipotential lines is an important experiment in physics experiments at high school and college level. A number of researchers have made some extensions and in-depth studies of this experiment [1-3]. We know from some textbooks that there is a great variability in the electric field and potential distribution in different media [4-5]. One notable contribution came from Elizalde-Torres, J., who innovatively developed a gel material that served as a point-to-point potential measurement tool. This gel was ingeniously employed to gauge the potential difference across its surface, shedding light on the intricate nature of potential distribution [6]. In a similar vein, Fongsuwan, C. engineered a device specifically designed for the automated measurement of potential distribution among multiple electrodes immersed in liquids [7]. Although Fongsuwan’s work was valuable in its own right, it did not delve into the comparative analysis of these differences or provide a comprehensive explanation for the results obtained. The results of numerical simulations can provide valuable references for experiments. These simulations offer insights that can guide experimental design and interpretation [8-9]. This paper analyzed the potential distribution characteristics of liquids at DC and AC voltages and explained the difference in potential distribution at AC and DC voltages. The experimental and simulation results were compared using COMSOL simulation. Differences in potential distribution in liquids and on conducting paper are explained. We intend to provide valuable insights that will prove instrumental in assisting students as they endeavor to grasp the underlying mechanisms governing electric fields and potential distribution within diverse materials. The objective of this experiment is to elucidate the distinct potential distribution patterns under DC and AC conditions and to enhance the understanding of electric field behavior in various conductive media.
2. Theoretical analysis
If ignoring the current in the medium, the electric field distribution in the medium can be expressed as:
When the medium is isotropic, there are:
Bring Eq. (2) into Eq. (1) and organize it:
If there is no free charge in the study area: , and the polarization of the medium is isotropic: . Eq. (3) is simplified to Poisson's equation:
The boundary conditions of Eq. (4) are:
For two electrodes, their potential is a constant value: .
There is no free charge on the surface of the solution or the surface of the insulated water tank: .
There are free-moving ions in the solution, and with the addition of an electrode, ions are mainly diffusion from a higher concentration to a lower concentration. The ions migrate through the solution due to electrostatic attraction between the ions and the electrode. Electrodes can only exchange electrons from the neighbouring solution. The solution can be divided into a compact inner layer and a diffuse outer layer, and these two regions have significantly different ion distributions than the rest of the solution. The process of electrolysis is the transfer of electrons through redox reactions at the two electrodes [10]. When the electrode potential is high enough, the electrodes can provide a high enough activation energy for the electrons to increase the rate of the reaction, which increases the concentration of the reaction products at the bilayer, which in turn affects the concentration polarization. During the reaction, the actual electrode potential is affected by the ion concentration. The concentration of solution ions close to the electrode (104-107 Å) is significantly different from the concentration in the liquid domain. The actual potential will be lower than the theoretical potential, which means that the voltage acting directly on the liquid domain will be lower [11].
3. Experimental setup and methods
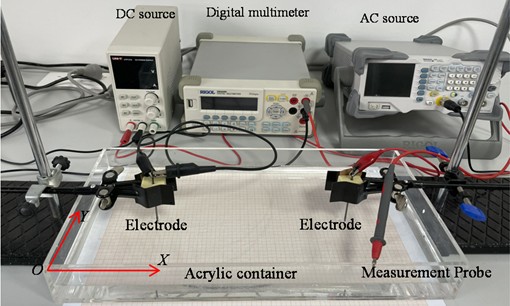
The experimental setup is shown in Fig. 1. A solution with a depth of 4.0cm was added to a 40 cm×20 cm×8 cm acrylic container, and a piece of coordinate paper was used to calibrate the position of the electrode, and a voltage measurement point was placed at the bottom. Cylindrical graphite electrodes (2B pencil leads from Sakura, Japan) of diameter 2.00 mm and length 5.0 cm were fixed with rubber cement and then placed at (10 cm, 10 cm), (10 cm, 30 cm) (with the lower left corner of the container as the origin of the coordinate system) using a clamp. Two graphite electrodes are inserted into the liquid surface at a depth of 2.00 cm. A voltage was applied to each of the two electrodes. The DC voltage was supplied by a power supply (LINI-T UTP1310), and a signal generator supplied the AC voltage. (RIGOL DG1022). The negative electrode of the digital multimeter (RIGOL DM3058E) is connected to the negative terminal of the graphite electrode, and the other electrode measures the voltage at different locations in the solution.
Fig. 1Diagram of the experimental setup
4. Results and discussion
4.1. Simulation of the equipotential surfaces in water
The numerical simulation results presented in this study provide critical insights into the potential distribution in water, serving as a valuable reference for experimental research. Using the steady-state model in the electrostatic field module of COMSOL, the geometry parameters were defined according to the experimental vessel dimensions (40 cm×20 cm×8 cm) and the electrode configuration (diameter 2.00 mm, length 5.0 cm and placed at (10 cm, 10 cm), (10 cm, 30 cm). The relative permittivity of water was set to accurately represent its dielectric properties, and an electrode voltage of 10 V was applied. The mesh was refined near the electrodes to capture the steep potential gradients. The resulting equipotential surface distribution, shown in Fig. 2, is indicative of the strong, localized electric fields near the electrodes, with the field intensity diminishing rapidly further away. The dense packing of equipotential lines near the electrodes suggests that the majority of the potential drop occurs in their vicinity, reflecting the complex interaction between the electric field and water’s dielectric response.
Fig. 2Simulation of isotropic surface distribution in water
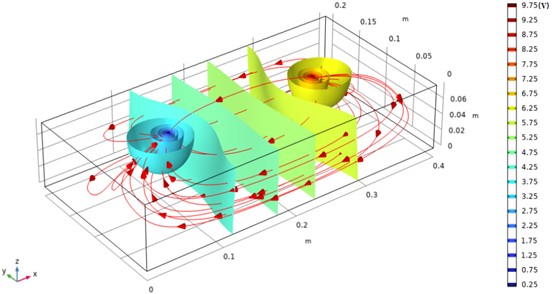
The qualitative comparison of the simulated equipotential surfaces to the potential distribution of two equal but dissimilar charges indicates that the potential distribution in the liquid retains key features of classical electrostatics. This similarity implies that the system may be effectively modeled using simplified theoretical approaches for analytical exploration. Furthermore, the findings highlight the influence of electrode geometry and placement on the overall potential distribution. Specifically, the separation distance between the electrodes plays a crucial role in determining the extent of field overlap and the resulting equipotential pattern. The observed field characteristics suggest that for a given electrode separation, the interactions between electric fields can result in complex potential contours, which are critical for understanding charge migration and distribution in dielectric liquids.
4.2. Equipotential lines under DC voltage
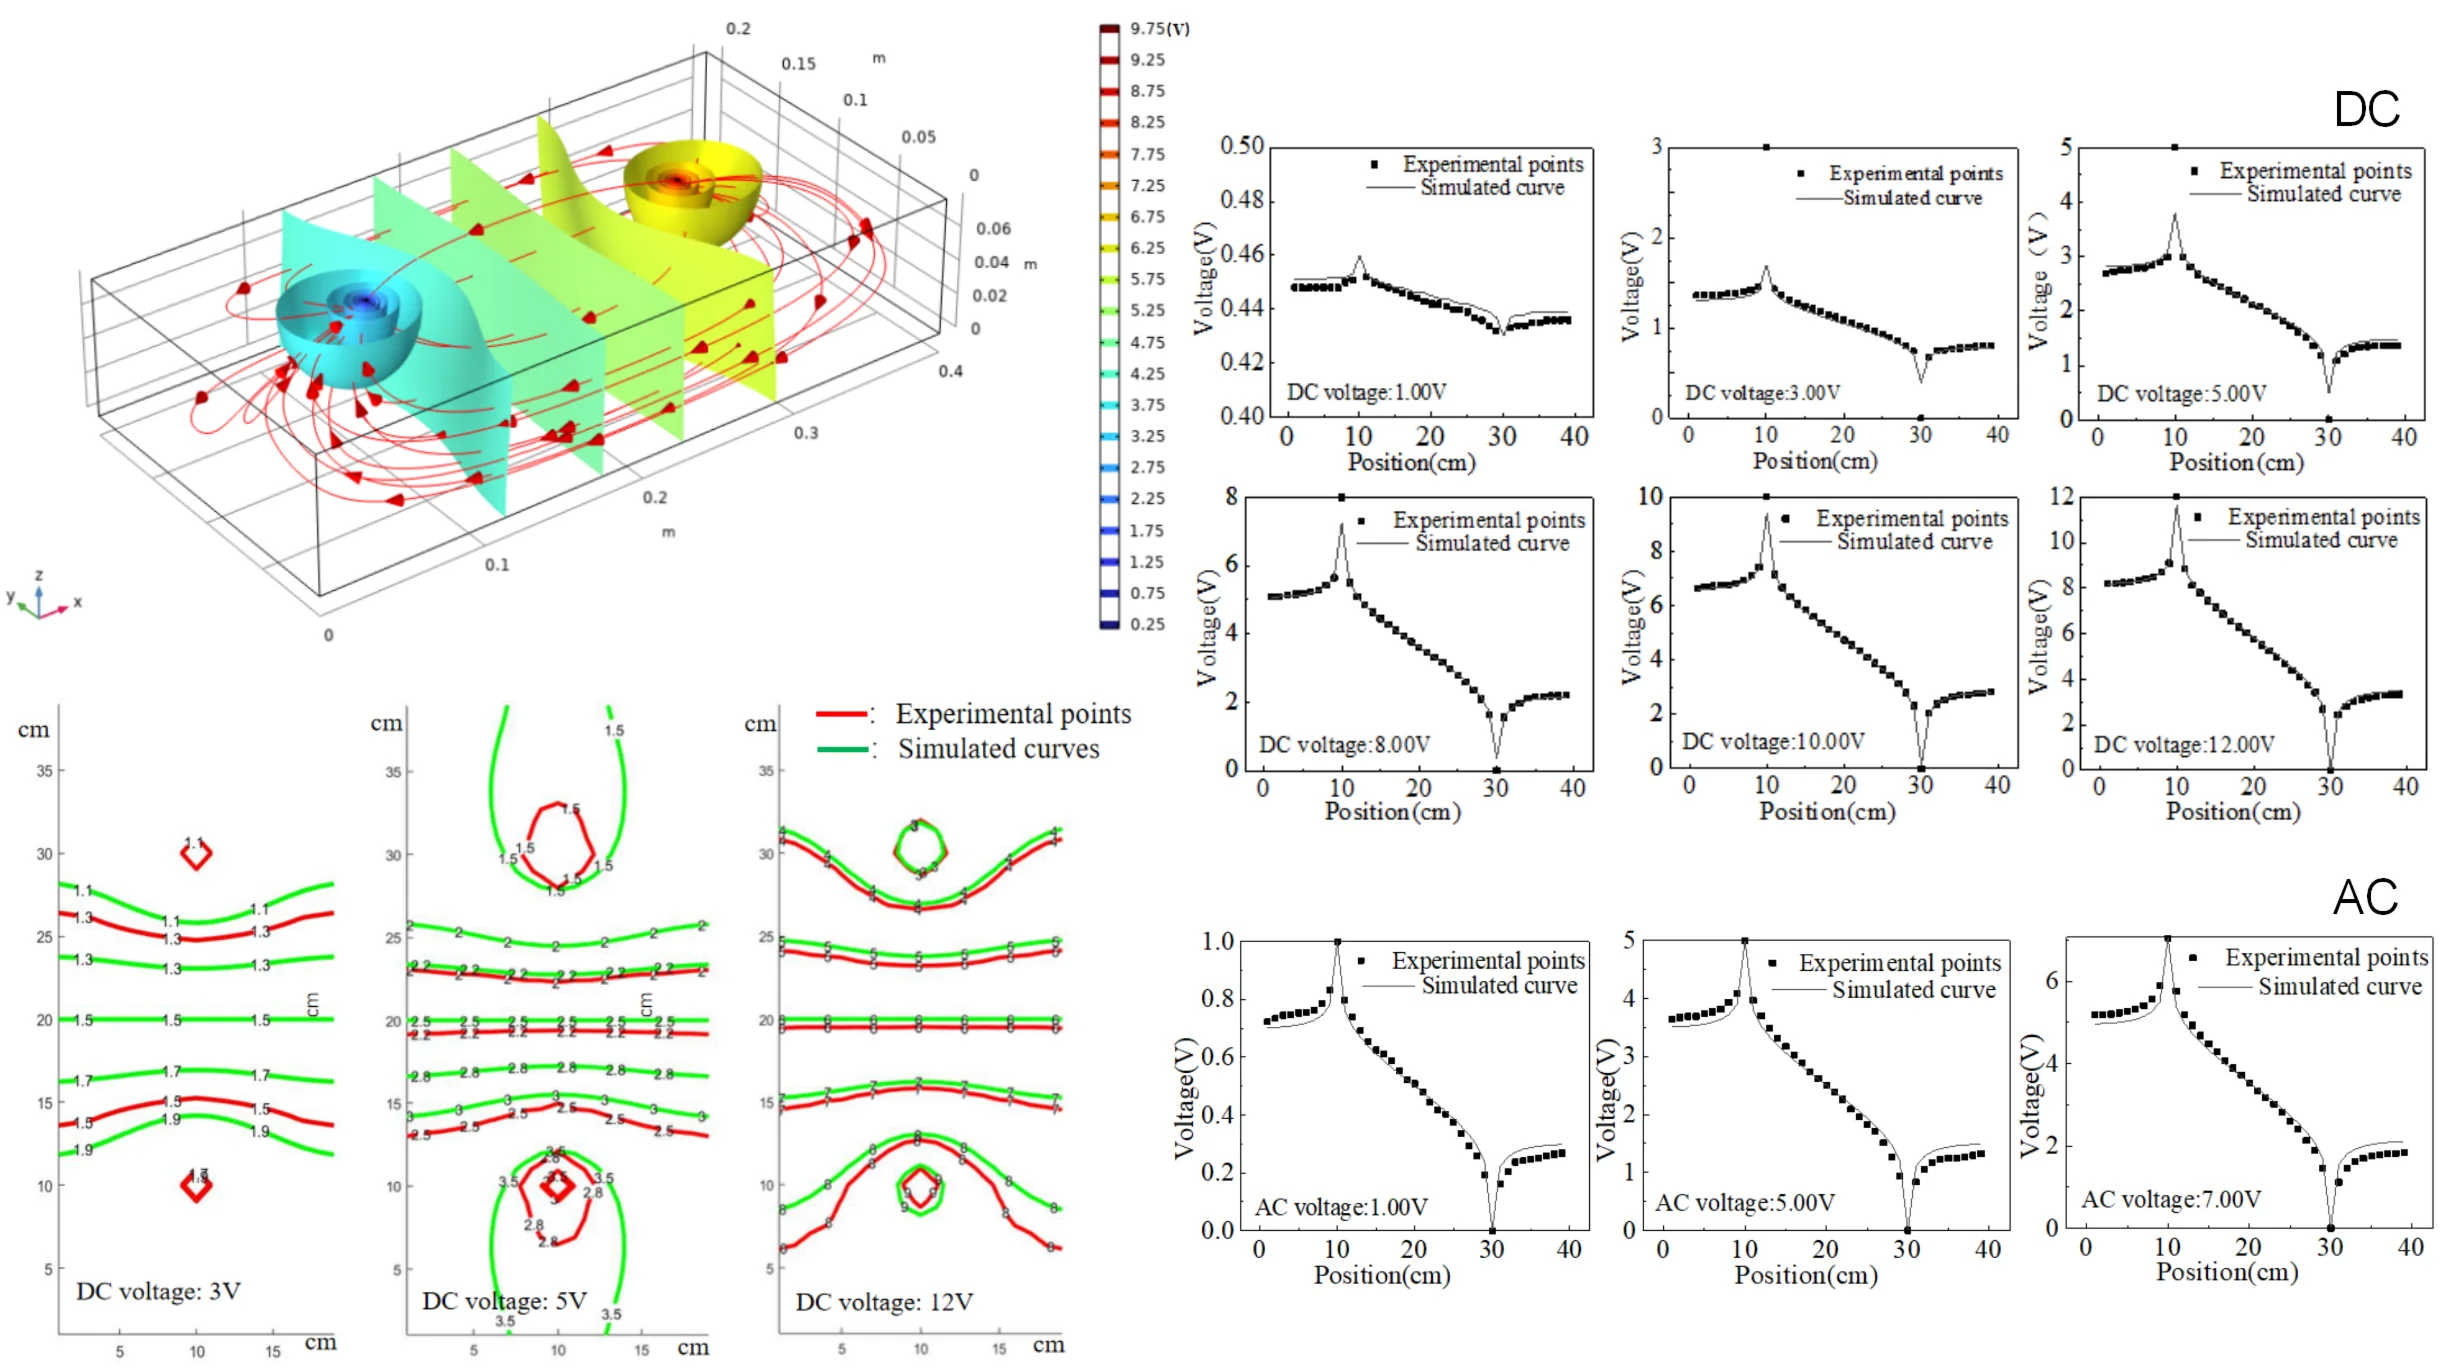
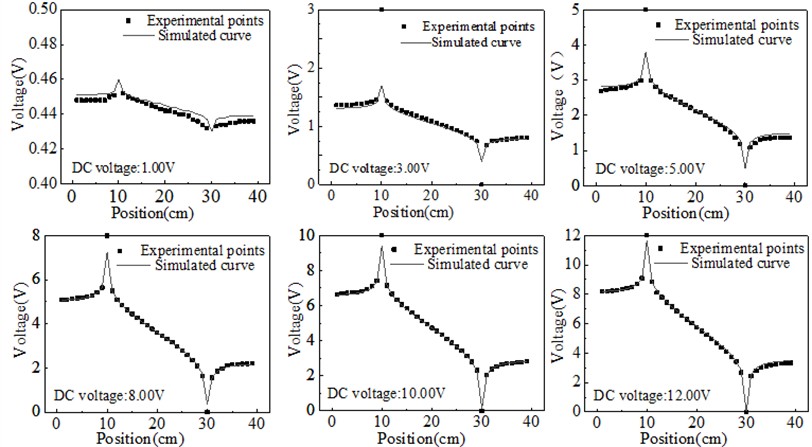
The equipotential lines in pure water were measured with a multimeter at different DC voltages. The positional information of the same potentials was also extracted in the simulated potential plot in COMSOL software. The simulated and experimental potentials are plotted in the same graph, and the comparison results are shown in Fig. 3.
Fig. 3Comparison of experimental and simulated equipotential lines under different DC voltages
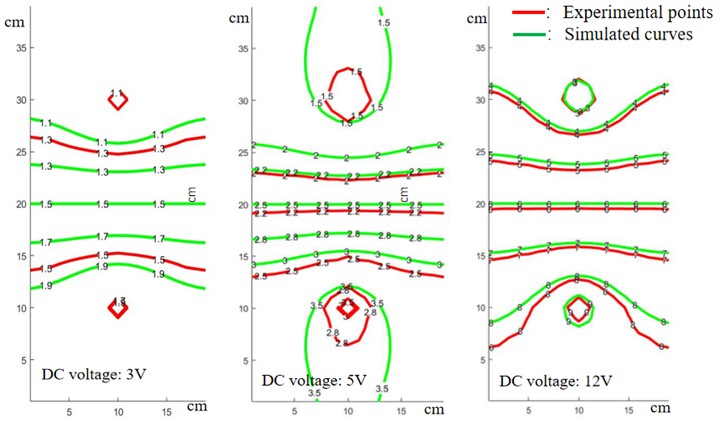
The results shown in Fig. 3 reveal an uneven gradient in the experimental equipotential lines along the axis connecting the two electrodes, indicating variations in the local electric field strength. Despite these irregularities, the equipotential lines exhibit clear axial symmetry about the connection line, suggesting that the overall distribution adheres to the expected symmetry of the system. Notably, as the voltage applied to the electrodes increases, the deviation between the experimental and theoretical potential values diminishes, demonstrating that higher applied voltages improve the consistency between the experimental measurements and theoretical predictions. This behavior is attributed to the polarization conditions at the electrode-solution interface, where sufficiently high voltages promote ion migration across the contact surface, thereby reducing surface polarization effects that typically cause discrepancies.
To address the observed deviations, incorporating polarization potential corrections in the simulation is recommended, as it would more accurately represent the electrode-solution interactions and mitigate errors between the simulated and experimental results. Such corrections can account for the non-ideal polarization behaviors that arise at lower voltages, ensuring a more accurate depiction of the potential distribution. Subsequently, a detailed analysis of the potential distribution along the connection line between the electrodes was performed for different potential differences, as depicted in Fig. 4. The results show that variations in potential difference significantly influence the symmetry and gradient of the potential distribution. This suggests that the influence of polarization effects becomes more prominent at lower voltages, and the error can be minimized by either increasing the applied voltage or by refining the simulation model to include the polarization potential correction. This approach allows for a deeper understanding of how electrode polarization influences the potential distribution and provides a basis for optimizing experimental setups to achieve better alignment with theoretical predictions.
Due to the geometric size limitations of our measurement electrodes, the number of experimental data points near the electrodes is relatively small. When the voltage is low, there is still a certain error after using electrode polarization potential correction on the symmetrical axis of the two electrodes. When the voltage is high, the experimental points are consistent with the simulation curve, indicating that the corrected theory is correct.
Fig. 4Equipotential lines on the connection between two electrodes under DC voltage
4.3. Equipotential lines under AC voltage
The electric potential analysis was also conducted using alternating current, and the results of equipotential lines at 50 Hz AC 1.00 V, 5.00 V, and 7.00 V for the two electrodes are shown in Fig. 5.
Fig. 5Equipotential lines on the connection between two electrodes under AC voltage
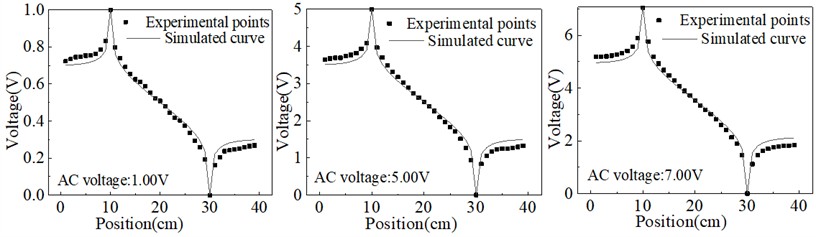
The equipotential line distribution under AC voltage conditions, as depicted in Fig. 5, exhibits distinctive characteristics compared to the DC voltage scenario. The periodic reversal of polarity between the anode and cathode results in a dynamic redistribution of the potential, significantly mitigating concentration polarization effects in the vicinity of the electrodes. This reduction in concentration gradient stems from the continuous oscillation of ion migration directions, which prevents the buildup of ion concentration layers at the electrode surfaces. Consequently, the experimental equipotential distribution under AC voltage shows improved agreement with theoretical predictions, demonstrating the effectiveness of AC voltage in diminishing polarization-induced discrepancies.
However, despite the overall alignment between experimental and theoretical equipotential lines, a residual deviation remains near the boundary and in the intermediate region between the electrodes. This deviation can be attributed to the inherent limitations of AC voltage at a fixed frequency of 50 Hz, which is insufficient to completely eliminate the concentration accumulation near the electrode surfaces. The alternating field, while capable of reducing polarization, does not entirely prevent ion aggregation during each half-cycle, particularly at lower frequencies where ions may still accumulate and influence the local potential distribution. Therefore, the results suggest that increasing the frequency of the applied AC voltage could potentially further reduce the concentration polarization and improve the uniformity of the potential distribution. This analysis underscores the complex interplay between AC voltage parameters and electrode polarization effects, providing valuable insights for optimizing AC-driven electrostatic systems to achieve better concordance between experimental measurements and theoretical models.
4.4. Equipotential lines of solutions with different ion concentrations
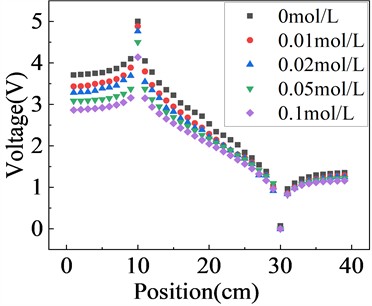
The potential distribution between the two electrodes of Na2SO4 solution with different concentrations under a 5 V AC voltage is shown in the Fig. 6. The higher the ion concentration, the lower the potential at the same position compared to the theoretical potential, and the deviation is maximum at the anode. This phenomenon arises due to the behavior of ions subjected to an alternating current (AC) electric field, exhibiting characteristics akin to resistive impedance, reducing the effective electrode potential.
Fig. 6Equipotential lines of solutions with different concentrations under AC voltage 5 V
5. Conclusions
The study provides critical insights into the influence of electrode polarization effects in liquid systems, demonstrating how concentration polarization distorts the actual electrode potential and results in deviations between experimental and theoretical values. By incorporating corrections to reduce the influence of electrode polarization, the simulations achieved strong agreement with experimental data, validating the electric field model’s capability to accurately represent potential distributions in liquid environments after accounting for electrode effects. Under AC voltage, periodic polarity changes effectively reduce concentration gradients and, as a result, mitigate polarization effects. This outcome aligns closely with theoretical predictions and underscores the potential of AC voltage to minimize concentration polarization through dynamic ion redistribution.
From an engineering perspective, these findings are significant for optimizing electrochemical processes, where precise control over potential distribution is critical. The results suggest that applying AC voltage could be a practical approach for minimizing polarization-related inefficiencies in systems such as electroplating, desalination, and electrochemical sensing. However, the current model’s assumption of complete elimination of electrode effects may oversimplify the system, as it does not account for complex interactions like electrode surface reactions or ion-specific migration behaviors. Thus, to enhance the applicability of this model in real-world scenarios, further research should focus on incorporating parameters such as temperature fluctuations, ion mobility variations, and surface reaction kinetics. This would allow for more accurate simulations and better-informed design choices in industrial applications where electrode polarization significantly impacts system performance and efficiency.
References
-
P.-M. Binder, R. M. Figueroa-Centeno, K. J. Hui, and K. M. Schlechter, “High-density electric potential plots,” European Journal of Physics, Vol. 36, No. 3, p. 035029, May 2015, https://doi.org/10.1088/0143-0807/36/3/035029
-
A. Nair and V. Sawtelle, “Real-time visualization of equipotential lines using the IOLab,” The Physics Teacher, Vol. 56, No. 8, pp. 512–514, Nov. 2018, https://doi.org/10.1119/1.5064557
-
J. A. Phillips, J. Sanny, D. Berube, and A. Hoemke, “Beyond the point charge: equipotential surfaces and electric fields of various charge configurations,” The Physics Teacher, Vol. 55, No. 2, pp. 71–73, Feb. 2017, https://doi.org/10.1119/1.4974113
-
David J. Griffiths, Introduction to Electrodynamics. Britain: Addison-Wesley, 2012.
-
F. F. Chen, Introduction to Plasma Physics and Controlled Fusion. America: Springer, 2016.
-
J. Elizalde-Torres, M. González-Cardel, E. J. Vega-Murguía, I. Castillo-González, and M. Rodríguez-Nava, “A conductive gel for the plotting of equipotential lines,” Physics Education, Vol. 50, No. 4, pp. 468–471, Jul. 2015, https://doi.org/10.1088/0031-9120/50/4/468
-
C. Fongsuwan, P. Teangsriwan, C. Traiwan, and S. Buaprathoom, “A system displaying equipotential lines from electrodes in real time,” in Journal of Physics: Conference Series, Vol. 1380, No. 1, p. 012163, Nov. 2019, https://doi.org/10.1088/1742-6596/1380/1/012163
-
O. Ifayefunmi, M. S. Ismail, and M. Z. A. Othman, “Buckling of unstiffened cone-cylinder shells subjected to axial compression and thermal loading,” Ocean Engineering, Vol. 225, p. 108601, Apr. 2021, https://doi.org/10.1016/j.oceaneng.2021.108601
-
M. S. Ismail, O. Ifayefunmi, S. H. S. M. Fadzullah, and M. Johar, “Buckling of imperfect cone-cylinder transition subjected to external pressure,” International Journal of Pressure Vessels and Piping, Vol. 187, p. 104173, Nov. 2020, https://doi.org/10.1016/j.ijpvp.2020.104173
-
S. Trasatti, “Electrochemical Theory | Electrokinetics,” in Encyclopedia of Electrochemical Power Sources, Elsevier, 2009, pp. 23–31, https://doi.org/10.1016/b978-044452745-5.00021-6
-
G. Minton, “Electrochemical theory and physics,” in Lithium-Sulfur Batteries, Wiley, 2019, pp. 3–32, https://doi.org/10.1002/9781119297895.ch1
About this article

Experimental Technology Research Project of Zhejiang University in 2022(SYBJS202205) and The Universities Teaching Research Project of Teaching Guidance Committee (East China) in 2023(2023JZWHD12).
The datasets generated during and/or analyzed during the current study are available from the corresponding author on reasonable request.
Xingxing Yao: funding acquisition, investigation, resources, validation, writing-review and editing, writing-review and editing. Jialong Luo: conceptualization, data curation, formal analysis, investigation.
The authors declare that they have no conflict of interest.
