Abstract
Factors influencing conductor galloping are so complicated that the development of galloping theories and anti-galloping technologies for transmission lines is limited. Study on influence parameters to the galloping is crucial to investigate galloping mechanism and anti-galloping methods. In this paper, three important dimensionless parameters, damping ratio, reduced wind velocity and reduced mass ratio, are proposed by dimensionless analysis based on the conductor galloping model. The expression of galloping equivalent amplitude is derived by using the average method, and the analytic solution is obtained when the aerodynamic curve is fitted by cubic and quintic polynomials respectively. For the aerodynamic coefficients, wind tunnel testing results of three typical eccentric ice accretion shapes, D shape, U shape and airfoil shape, are introduced to analyze the influence of the dimensionless parameters to the conductor galloping. Firstly, a new formula to calculate the galloping critical wind velocity is derived, which is more accurate than the result given by Den Hartog criterion. Secondly, the influence of reduced wind velocity and damping ratio to the galloping equivalent amplitude is studied. The results have an important guidance to anti-galloping design for transmission lines.
1. Introduction
It is very known that conductor galloping of the transmission line is a classical self-excited aeroelastic oscillation phenomenon due to wind action [1]. This motion is characterized by low frequencies (about 0.1-3 Hz) and large amplitudes (about 20~300 times conductor diameter) with a single or a few loops of standing waves per span [2, 3]. Damages caused by conductor galloping can be equally dramatic and very costly with broken conductors and fittings, damaged tower components and even whole towers [4-6]. As a result, the consequential economic and social costs of power loss to whole areas can also be very considerable. So the phenomenon of conductor galloping has been gaining more and more attention from the mechanism to the anti-galloping method all over the world [3].
Conductor galloping has been widely studied since the 1930s [7, 8]. A vertical galloping mechanism was firstly proposed by Den Hartog [7]. Whereafter, several other mechanisms, such as torsinal galloping mechanism [9], torsional feedback mechanism and nonlinear instability [10, 11], were also proposed based on the different emphases and phenomenon interpretations. Although the conductor galloping has been studied extensively, hitherto it is still not full understood because of its nonlinearity and complex influence factors. And it has been realized through field observations and tests that the factors influencing conductor galloping characteristics are so complicated that they include not only weather conditions and structural factors of transmission lines, but also many other random factors. Based on the theoretical and experimental points of view, the main factors may include ice accretion type and shape, wind velocity and direction, span lengths, conductor self-damping, attachment type between conductor and tower, number of sub-conductors and their arrangement, torsional frequency and stiffness, operating tension, sub-conductor spacing, spacer properties, retrofit devices, and so on [3].
Some investigations have been performed to determine the non-dimensional factors and provide the best candidates for galloping analysis. Lilien and Dubois [12] proposed four comprehensive dimensionless parameters due to galloping characteristic analysis for bundle conductors. The CIGRE work group of conductor galloping summarized the proposed dimensionless parameters of single and bundle conductors [3]. Other researches mainly focus on the conductor galloping characteristics or the single physical parameter [13-18]. So, in-depth analysis for the influencing factors to the conductor galloping is also lacking from the existing literatures. The existing studies on factors influencing conductor galloping are still not satisfactory.
So it is significant to study the factors influencing the conductor galloping, especially for the development of effective anti-galloping methods as the galloping mechanism has not been solved completely. In this paper, three important dimensionless parameters, damping ratio, reduced wind velocity and reduced mass ratio, are proposed by dimensionless analysis based on the conductor galloping model. The galloping equivalent amplitude is derived by solving the nonlinear galloping equation whose aerodynamic force is obtained by polynomial fitting by using the average method. And the formula to calculate the galloping critical wind velocity is also presented. Based on three typical eccentric ice accretion shapes, D shape, U shape and airfoil shape, the influence of dimensionless parameters to the galloping equivalent amplitude is also studied. The results obtained in this study have an important guidance to the anti-galloping design for transmission lines.
2. Galloping analysis model
Based on the differential equation of motion for one DOF system, there is:
where m is the mass per unit length, cy is the damping coefficient, ky is the stiffness coefficient, ¨y, ˙y, y, Fy are the acceleration, velocity, displacement and force vector in y direction respectively. Assume that the axial deformation is neglected. Fig. 1 gives a schematic diagram of an iced conductor and shows definitions of the aerodynamic forces.
Fig. 1Galloping analysis model of an iced conductor
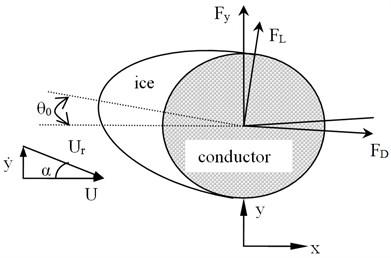
Wind velocity is known as U, and the relative wind velocity of the vibrant conductor is Ur=√˙y2+U2. α is the modification of the angle of attack introduced by the vertical velocity ˙y. And considering α as a relatively small amount, the angle of wind attack can be calculated as:
Based on the quasi-steady assumption [3], the dynamic angle of attack θ is defined as:
where θ0 is the initial static off-set angle of the iced conductor. And the aerodynamic forces can be expressed as follow:
where ρ is the mass density of air, D is the reference length of the iced cross section which is generally substituted by the conductor diameter, and CD, CL is the drag and lift coefficients of the profile respectively.
By considering the angle α, the aerodynamic force on Y direction is obtained as:
where Cy=CLcosα-CDsinα≈CL-CDα.
Generally, the properties of lift and drag coefficients CL and CD mainly depend on the ice shape, ice angle, and ice thickness etc. And they can be obtained by the wind tunnel test. In order to establish the aerodynamic model conveniently, the force coefficient Cy is usually expressed as a polynomial function with respect to the dynamic angle of attack θ based on the quasi-steady theory, and the polynomial curve can be given in the form as:
where bk is the fitting coefficient and N is the order of the polynomial.
Substituting Eq. (3), (5) and (6) into Eq. (1), there is:
By introducing dimensionless displacement u=yD and dimensionless time τ=ωyt in which ωy is vertical natural frequency ωy=√kym, three dimensionless parameters are defined from Eq. (7) as follow:
damping ratio ξy=cy2mωy,
reduced wind velocity Uy=UωyD,
and mass ratio μy=ρD22m.
Then by dimensionless analysis, Eq. (7) becomes:
where .
Assuming that as the dimensionless frequency, Eq. (8) can be rewritten as:
where and is an expression of mirror quantity.
Eq. (9) can be solved by using the average method. So assuming the solution of Eq. (9) is:
where is amplitude, and .
Substituting Eq. (10) into Eq. (9), we can obtain:
where and are the slow variable functions with respect to . So the right items of the Eq. (11) are averaged in one cycle, and we can obtain:
Using , , and
Eq. (12) becomes:
Considering the steady state solution (periodic solution) of Eq. (13), amplitude does not change with respect to time. So Eq. (13) becomes:
From the first expression of Eq. (14), it presents a high order equation with respect to the amplitude variable . And the order of the equation depends on the order of the fitting polynomial. Solving Eq. (14) by using and , we can get the following results.
(1) When the curve of in Eq. (6) is fitted by cubic polynomial, namely , a forth order equation with respect to can be derived from Eq. (14). And an analytic solution can be obtained as follows:
(2) When the curve of in Eq. (6) is fitted by quintic polynomial, namely , a 6th order equation with respect to can be derived from Eq. (14). And an analytic solution can be also obtained from Eq. (14) as follows:
where the expressions:
(3) When the curve of in Eq. (6) is fitted by seven order polynomial or above, namly 5, it is difficult to obtain an analytic solution from Eq. (14). But it can be solved by numerical methods.
3. Influencing parameters analysis
From Eq. (14), three dimensionless dominant parameters, damping ratio, reduced wind speed and mass ratio, can be studied. And the influence to the galloping amplitude can be also obtained by solving Eq. (14). In this study, as an example, the expression (15) is used to analyze the influence of these parameters to the galloping amplitude. In the practical transmission lines, the parameter has small variation to a given conductor type because is mainly related to the structural characteristics of the conductor. So other two parameters, and , are mainly considered in the following analysis.
According to field observations, three common ice shapes covered on the conductor surface, U shape, D shape and airfoil shape, are introduced in this study. Fig. 2 shows the schematic diagrams of the three eccentric ice accretions on the conductor respectively, in which is ice thickness.
Fig. 2Schematic diagrams of three typical iced conductors
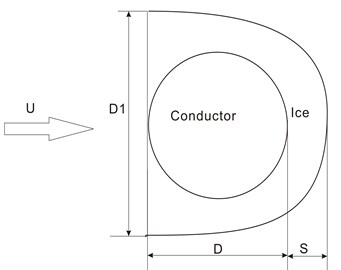
(a) D-shape iced conductor
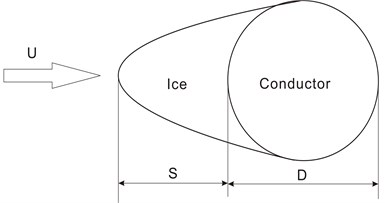
(b) U-shape iced conductor
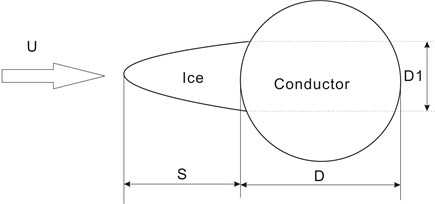
(c) Aerofoil-shape iced conductor
Field observations and tests show that the characteristic timescale of conductor galloping is much larger than the characteristic timescale of the flow, and the vortex shedding frequency is much higher than the frequency of galloping [22]. So the quasi-steady assumption is used wildly to obtain the aerodynamic forces.
The validity of quasi-steady theory has been tested based on the existing studies. The curves of aerodynamic force coefficients in this study are obtained by the wind tunnel tests according to the stationary iced conductors at different angles of incidences.
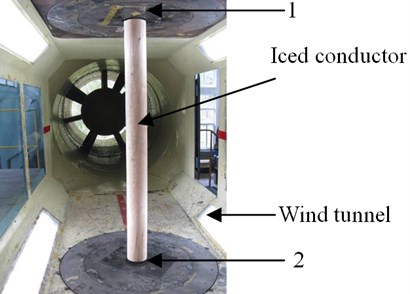
The size of our wind tunnel is 1.4 m×1.4 m×2.8 m for width, height and length. It is a close loop with an open section for the testing area. And it allows the maximum wind speed of 68 m/s and the minimum steady wind speed is about 10 m/s. The turbulence intensity is not more than 0.14 %. Fig. 3 gives a typical photo for the U-shape iced conductor in the tunnel test. The sample is fixed by two steel plates at the two endpoints 1 and 2 in Fig. 3, which can make the sample rotation in 360° range of angle of attack. Dynamomenters used to measure the aerodynamic coefficients are set at 1.
Fig. 3A typical photo in the tunnel test
As an example, the experimental data for U-shape, D-shape and airfoil-shape iced conductors with 6 mm and 26.8 mm are presented in Fig. 2. The conductor mass of unit length is 1.35 kg/m. The quasisteady measured coefficients of as functions of the angle of attack are shown in Fig. 4. And the fitting curves by using the cubic polynomial are also shown in Fig. 4.
Fig. 4Quasi-steady aerodynamic force coefficients measured in the wind tunnel and fitting curves by 3th order polynomial
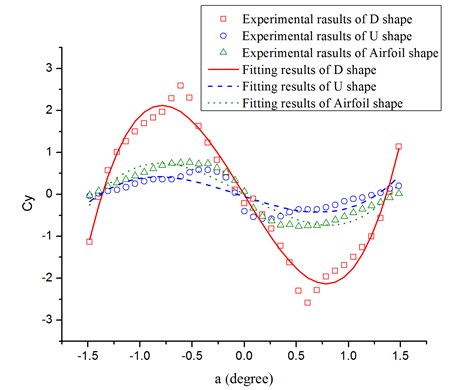
Fig. 5A typical time history and phase diagram on galloping for the D-shape iced conductor
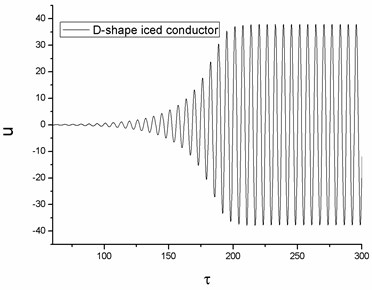
(a) response curve
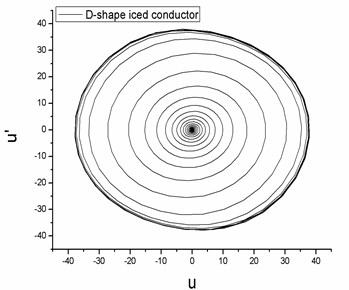
(b) phase diagram
3.1. Limit cycle oscillation analysis
The conductor galloping can be described mathematically by a Limit Cycle Oscillation as a typical classical self-excited aeroelastic vibration phenomenon. In order to obtain the limit cycle behaviors, Eq. (8) can be simulated by the Runge-Kutta method. Without loss of generality, the D-shape iced conductor is selected as the model with , , and . The time history response and phase diagram are shown in Fig. 5.
The iced conductor undergoes Limit Cycle Oscillation with amplitudes that depend on the initial conditions and the relative parameters. So it is necessary to understand the influence of domain parameters to the conductor galloping behaviors.
3.2. Critical wind velocity of conductor galloping
In order to obtain a simplified expression, suppose that the initial static offset angle 0. To make sure that the amplitude has only real roots from Eq. (15), the right item in Eq. (15) must equal to or greater than zero, then we can obtain:
In fact, from Eq. (17), two stability conditions are presented to excite the conductor galloping phenomenon.
Therefore, the critical wind velocity of the conductor galloping can be derived from Eq. (17), and we can obtain:
From Eq. (18), the critical wind velocity (condition I) coincides with the well-known Den Hartog criterion. And the critical wind velocity (condition II) is a new criterion which is more complex than . It is obvious that is only relative to the first-order coefficient of the fitting polynomial in Eq. (6). But is relative to both the first-order and the third-order coefficients, and . Due to , there is the expression . And the equality will be set up when . So there will have much lower critical wind velocity when the third-order coefficient of the fitting polynomial is also considered.
Submitting the fitting data presented in Fig. (4) into Eq. (18), the galloping critical wind velocities are obtained with respect to the damping ratio for different ice-shape conductors. The results are shown in Fig. (6). From Fig. (6), the critical wind velocity of conductor galloping increases as the damping ratio increases. And the magnitude of the critical wind velocity calculated by is lower than by . For D-shape iced conductor (Fig. 6(a)), the critical wind velocity decreases about 8.3 % by than by . And for U-shape iced conductor (Fig. 6(b)) and aerofoil-shape iced conductor (Fig. 6(c)), it decreases about 7.1 % and 9.5 %, respectively. The lower critical wind velocity denotes the easier conditions to excite conductor galloping, which need to improve the exiting anti-galloping design for transmission lines.
Fig. 7 shows a contrast on the galloping critical wind velocity with the given three ice-shape conductors. From the results, it is obvious that ice shape presents a significant influence to galloping occurrence. The D-shape iced conductor is more liable to galloping phenomenon than the other two ice shapes, which coincide with the results by field observations and tests. In the same conditions, the U-shape iced conductor has the maximum galloping critical wind velocity. Actually, the U shape and the airfoil shape are two more familiar eccentric ice accretions on conductors than the D shape. But the D-shape iced conductor is mostly applied in galloping tests and simulations just because it is much easier to excite conductor galloping phenomenon.
Fig. 6Galloping critical wind velocity vs. damping ratio for the three ice-shape conductors
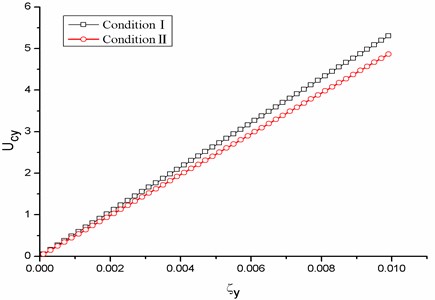
(a) D-shape iced conductor
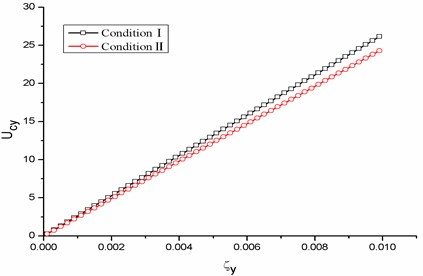
(b) U-shape iced conductor
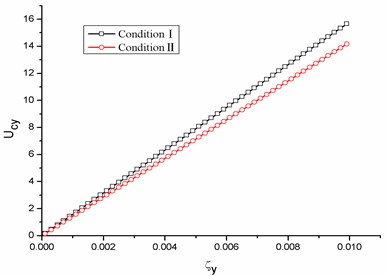
(c) Aerofoil-shape iced conductor
Fig. 7Contrast on galloping critical wind velocity with the three ice-shape conductors
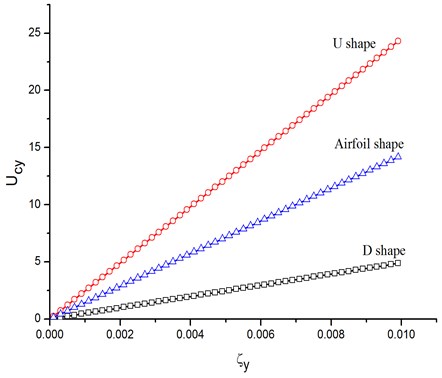
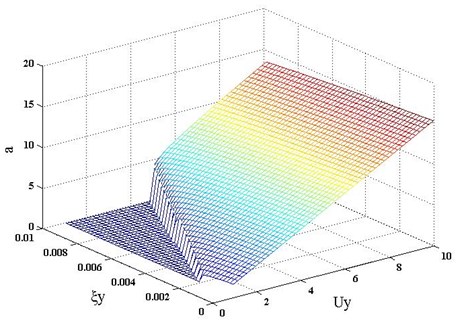
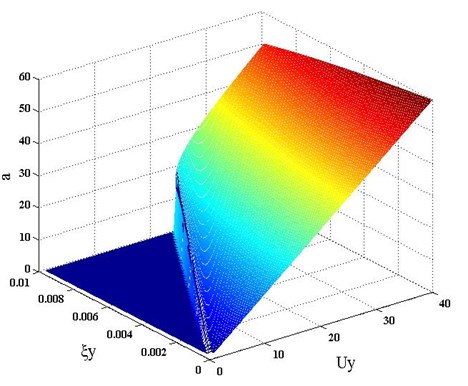
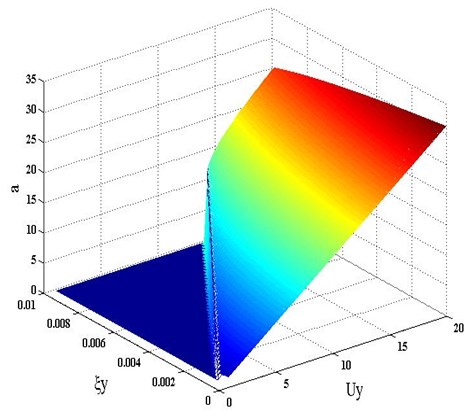
Fig. 8Galloping equivalent amplitude vs. damping ratio and reduced wind velocity for the three ice-shape conductors
(a) D-shape iced conductor
(b) U-shape iced conductor
(c) Aerofoil-shape iced conductor
3.3. Parameter analysis
Submitting the fitting data presented in Fig. (4) into Eq. (18), the galloping equivalent amplitude can be also calculated by different damping ratio and reduced wind velocity. Fig. 8 gives the results obtained by D-shape, U-shape and aerofoil-shape iced conductors. The galloping equivalent amplitude increases as the damping ratio decreases. But the influence of the damping ratio to the amplitude is not more conspicuous than to the critical wind velocity, because the self-damping of the conductors is very small that the magnitude is relatively close to 0.5 % of critical for the vertical movement [3].
The reduced wind velocity has a much obvious influence to the galloping equivalent amplitude. The amplitude increases as the wind velocity increases, which show an approximate linear relationship. And these results can provide the convenience for the anti-galloping design to analyze and select the effective design conditions and structural parameters.
4. Conclusions
To analyze the factors influencing conductor galloping for the transmission lines, three dimensionless parameters, reduced wind velocity, damping ratio and reduced mass ratio are proposed based on the conductor galloping model. The expression of galloping equivalent amplitude is derived and the analytic solutions are obtained when the aerodynamic curve is fitted by cubic and quintic polynomials respectively. Then the influence of dimensionless parameters to the conductor galloping is obtained by using the aerodynamic forces of three typical iced conductors with U-shape, D-shape and airfoil shape. A new more accurate formula to calculate the galloping critical wind velocity is proposed and the influence of the reduced wind velocity and the damping ratio to the galloping equivalent amplitude is studied. And from the results, we can obtain the following conclusions.
(1) Reduced wind velocity and damping ratio are two important parameters to affect the conductor galloping characteristics besides the aerodynamic parameters. The study on the two parameters can provide the convenience for the anti-galloping design of analyzing and selecting effective design conditions and structural parameters.
(2) When the third-order coefficient of the fitting polynomial for the aerodynamic curve is also considered, the galloping critical wind velocity is much lower than the magnitude calculated by Den Hartog criterion.
(3) In the same conditions, the galloping critical reduced wind velocity has the relation, , for the three typical eccentric iced conductors with D-shape, U-shape and airfoil shape.
(4) The reduced wind velocity has a much obvious influence to the galloping equivalent amplitude. The amplitude increases as the wind velocity increases, which show an approximate linear relationship.
(5) The influence of damping ratio to the galloping equivalent amplitude is limited due to the small self-damping. But the influence to the critical wind velocity is conspicuous, and the critical wind velocity increases as the damping ratio increases.
References
-
Blevins R. D. Flow-induced vibration. Second Edition, Van Nostrand-Reinhold, New York, 1990.
-
Guo Y. L., Li G. X., You C. Y. Galloping on transmission lines. China Power Press, Beijing, 2003, (in Chinese).
-
CIGRE Study Committee B2 WG11. State of the art of conductor galloping. Electra, No. 322, 2007.
-
Gupta S., Wipf T. Structural failure analysis of 345 kV transmission line. IEEE Transaction on Power Delivery, Vol. 9, Issue 2, 1994, p. 894-903.
-
Zhu K. J., Liu C. Q., Ren X. C., Dong Y. M. Research on anti-galloping of UHV transmission line. High Voltage Engineering, Vol. 33, Issue 11, 2007, p. 61-65, (in Chinese).
-
Ding X. G., Tao W. Q. Measures for reduction of damage caused by fluttered power transmission wires. High Voltage Engineering, Vol. 30, Issue 2, 2004, p. 54-55, (in Chinese).
-
Den Hartog J. P. Mechanical Vibrations. Fourth Edition, McGraw-Hill, New York, 1956.
-
Nigol O., Buchan P. G. Conductor Galloping. Den Hartog Mechanism. IEEE Transactions on Power Apparatus and Systems, Vol. 100, Issue 2, 1981, p. 699-707.
-
Nigol O., Buchan P. G. Conductor Galloping: Torsional Mechanism. IEEE Transactions on Power Apparatus and Systems, Vol. 100, Issue 2, 1981, p. 708-720.
-
Yu P., Popplewell N., Shah A. H. Instability trends of inertially coupled galloping part II: periodic vibration. Journal of Sound and Vibration, Vol. 183, Issue 4, 1995, p. 679-691.
-
Yu P., Shah A. H., Popplewell N. Inertially coupled of iced conductors. Transactions of the ASME, Vol. 59, 1992, p. 140-145.
-
Lilien J. L., Dubois H. Overhead line vertical galloping on bundle configurations: stability criterions and amplitude prediction. Proceedings of the International Conference on OHL Design and Construction, 1988, p. 65-69.
-
Qin Z. H., Chen Y. S., Zhan X. P., Liu B., Zhu K. J. Research on the galloping and anti-galloping of the transmission line. International Journal of Bifurcation and Chaos, Vol. 22, Issue 2, 2012, p. 1250038-1-34.
-
Wang S. H., Jiang X. L., Sun C. X. Study status of conductor galloping on transmission line. High Voltage Engineering, Vol. 31, Issue 10, 2005, p. 11-14, (in Chinese).
-
Rawlins G. R. Research on vibration of overhead ground wires. IEEE Transaction on Power Delivery, Vol. 3, Issue 2, 1988, p. 769-775.
-
Gurung C. B., Yamaguchi H., Yukino T. Identification and characterization of galloping of tsuruga test line based on multi-channel modal analysis of field data. Journal of Wind Engineering & Industrial Aerodynamics, Vol. 91, Issue 7, p. 903-924.
-
Keutgen R., Lilien J. L. Benchmark cases for galloping with results obtained from wind tunnel facilities. Validation of a finite element model. IEEE Trans. on Power Delivery, Vol. 15, Issue 1, 2000, p. 367-374.
-
Fu P., Farzaneh M., Bouchard G. Two-dimensional modelling of the ice accretion process on transmission line wires and conductors. Cold Regions Science and Technology, Vol. 46, Issue 2, 2006, p. 132.
-
Desai Y. M., Yu P., Shah A. H., Popplewell N. Perturbation-based finite element analysis of transmission line galloping. Journal of Sound and Vibration, Vol. 191, Issue 4, 1996, p. 469-489.
-
John H. G. M., Guy L. L. Two-degree-of-freedom inclined cable galloping part 2: analysis and prevention for arbitrary frequency ratio. Journal of Wind Engineering and Industrial Aerodynamics, Vol. 96, Issue 3, 2008, p. 308-326.
-
John H. G. M, Guy L. L. Two-degree-of-freedom inclined cable galloping part I: general formulation and solution for perfectly tuned system. Journal of Wind Engineering and Industrial Aerodynamics, Vol. 96, Issue 3, 2008, p. 291-307.
-
Barrero-Gil A., Sanz-Andrés A., Roura M. Transverse galloping at low Reynolds numbers. Journal of Fluids and Structures, Vol. 25, 2009, p. 1236-1242.
About this article
The authors are grateful for financial support from the National Natural Science Foundation of China (51008288).
