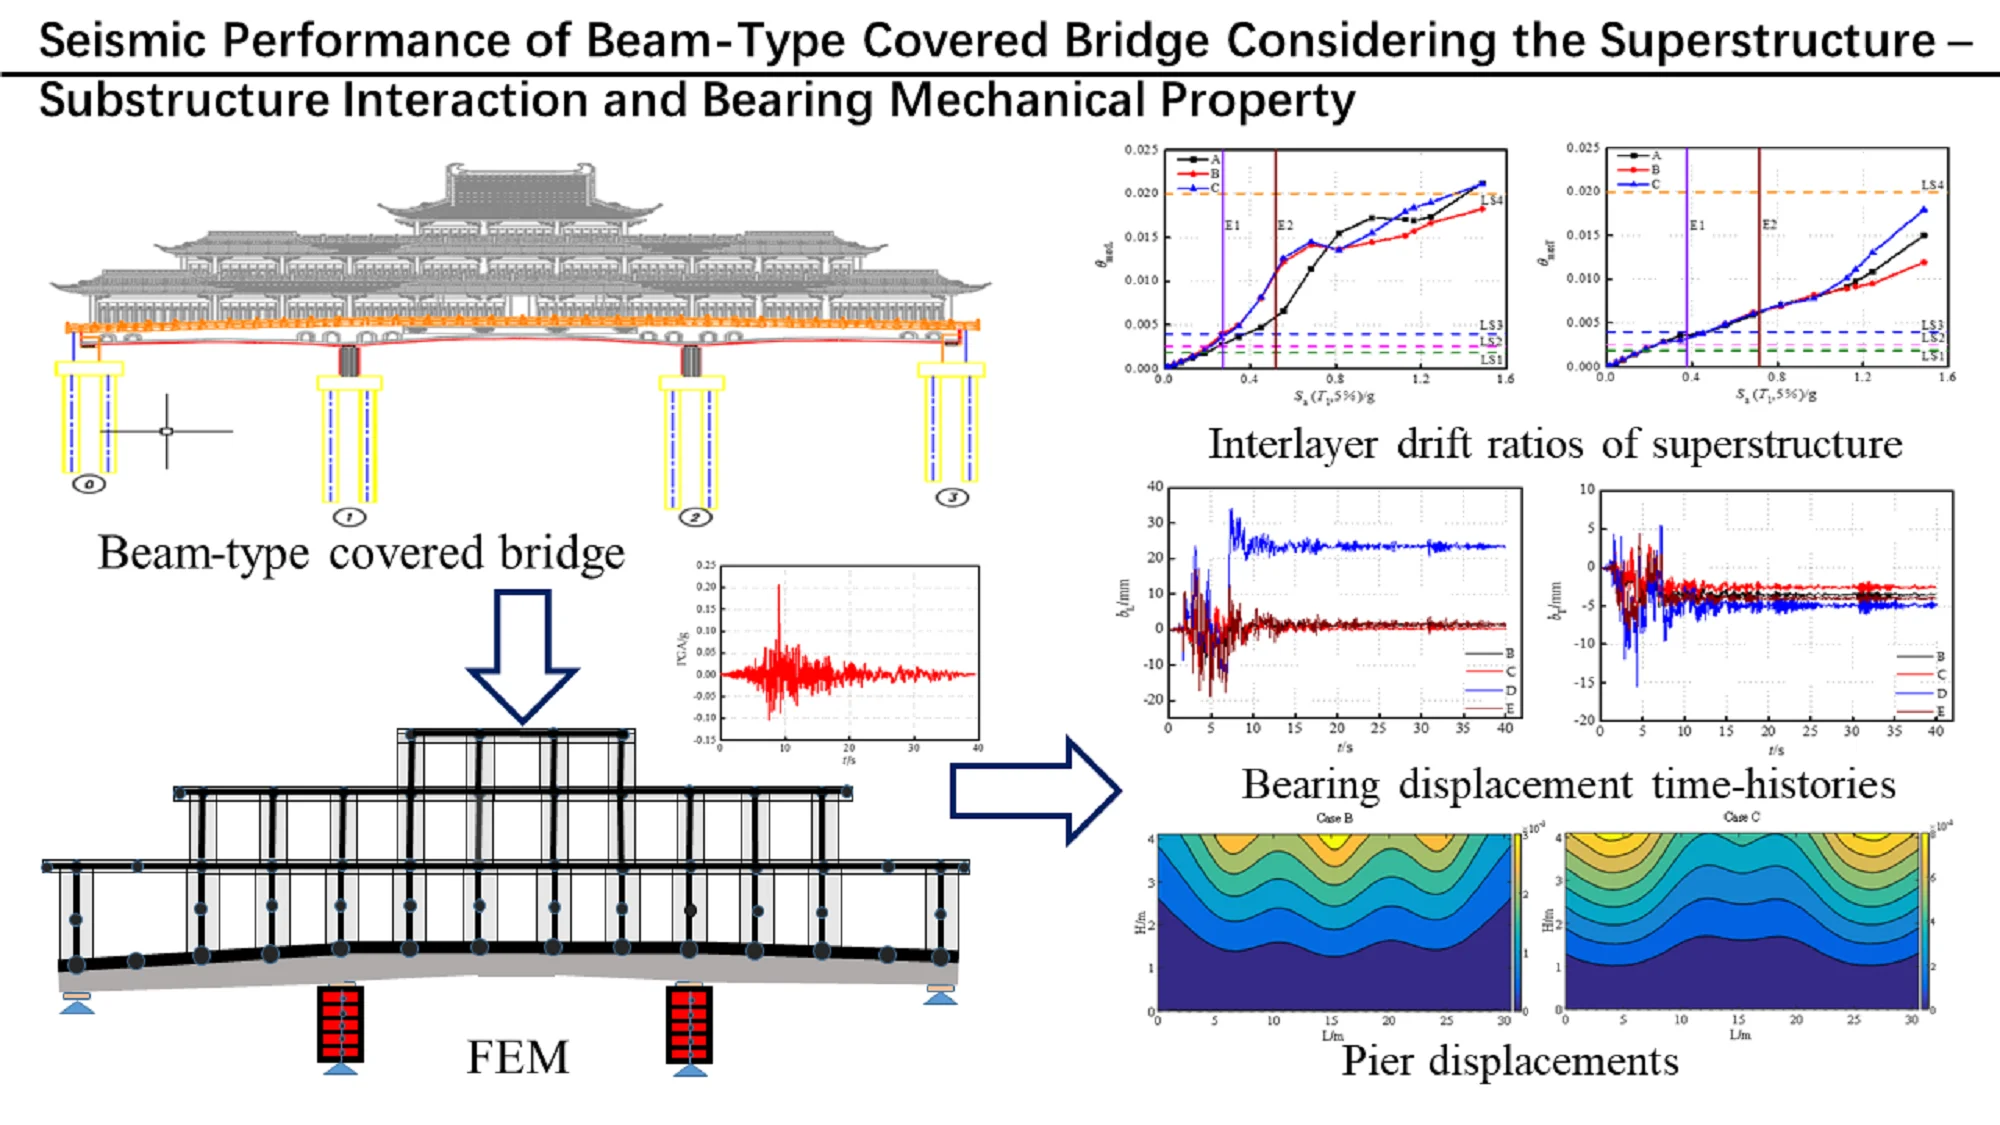
Abstract
Modern covered bridges have attracted attention due to their multifaceted commercial functionalities, making them increasingly prevalent in construction projects throughout China. To investigate the seismic performance of the beam-type covered bridge, finite element models (FEMs) of conventional building structure, conventional bridge structure and covered bridge structure were established via OpenSEES. The effects of bearing mechanical properties on the seismic response of the whole covered bridge and impacts of lower bridge structure on the interlayer drift ratio of upper building, as well as influences of upper building structure on bearing displacement and pier displacement and stress were deeply explored by using (Incremental dynamic analysis) IDA method. Furthermore, the seismic performance of the covered bridge was evaluated under two levels of seismic hazards. Results indicate that under the seismic events may occur, the interaction between superstructure and substructure is adverse to the longitudinal seismic performance of the superstructure and wall pier of the covered bridge, but do not significantly impact the lateral seismic response of the superstructure. The existence of the superstructure notably reduces the displacement of bearings. Moreover, higher bearing stiffness lead to a more pronounced interlayer drift ratio within the superstructure of the covered bridge. The influence of bearings on the displacement and stress of wall piers is not affected by the superstructure- substructure interaction. This study involved the nonlinearity of the structure and the randomness of seismic actions and clarified the impacts of factors on the seismic response of the beam-type covered bridge. Finally, a reasonable layout of the bearings was proposed.
Highlights
- Covered bridges are quite distinct from ordinary bridge structures and building structures.
- Superstructure - substructure interaction effectively reduced bearing displacements.
- Superstructure - substructure interaction is unfavorable for the longitudinal seismic resistance of upper building structure.
- Bearings with smaller sliding stiffness are more beneficial for the seismic performance of the building structure and wall piers.
- Greater stiffness of the bearings results in larger inter-layer drift ratios of building frame structure.
1. Introduction
The rapid development of modern covered bridges in China is attributed to their attractive appearance, seamless integration of bridge technology and architectural art, and the convergence of functionality and aesthetics. These covered bridges effectively utilize space, conserve land resources, and fulfill a variety of functional requirements. As a combined structure of bridge and building, the covered bridge comprises two distinct elements: the bridge and the commercial frame building structure constructed atop it. Thus, the covered bridge structure is a periodic structure consisting of a number of identical structural members. The associated levels of response caused by seismic events must be predictable in order that the structure can be designed with a minimum probability of catastrophic damage or malfunction in service [1]. Unlike conventional building structures located on the ground, the seismic response of the commercial covered bridge’s building structure is intricately linked to the bridge structure, which serves as its “foundation”. Consequently, the bridge structure must possess large stiffness to accommodate the substantial dead load generated by the upper building and the lateral loads during earthquakes. This unique structure differs significantly from ordinary building and bridge structures in terms of structure categories, construction techniques, force transmission paths, and static and dynamic responses. Under the earthquake actions, the interaction between the bridge and the building could render covered bridges susceptible to significant seismic damage, leading to irreparable losses.
From recent earthquakes, the primary seismic damage to reinforced concrete frame structures is manifested in evident in the form of beam and column cracking, infill wall cracking, and non-structural component failure. Specific manifestations include concentrated deformation of weak layers, cracking of frame columns, concrete collapse, exposed and bent steel bars, and concrete and steel bars exceeding the design strength in the node area due to insufficient stirrup configuration. These deficiencies are mainly a consequence of poor structural capacity design methodology [2]. The seismic damage to bridges is often related to their structural characteristics. Bearing is the load-bearing component connecting the upper and lower structures in a beam-type covered bridge constraint system. And bearing failures can cause changes in the stiffness of the bridge structure and significant damage to the whole structure. In addition to bearing damage and possible displacement and collision of the girder, the bridge structure will also experience common pier column bending and shear failure.
However, the previous research on covered bridges has tended to focus on static characteristics, mainly involving stress characteristics and bridge rehabilitation and renovation, but not including the seismic damage aforementioned. Seo et al. [3] carried out on-site vehicle live load experiments on 11 single-span covered bridges in the United States and recommended a live load experimental scheme applicable to traditional covered bridges. They also performed a feasibility evaluation of this scheme using finite element model analysis. Machitemes [4] completed on-site testing of displacement and strain for three truss-arch covered bridges and proposed an idealized truss arch element for use in the performance analysis. Lamar et al. [5] conducted the internal force analysis on an arch-truss and a lattice-truss covered bridge under dead and live loads. They studied the dimensions and positions of chord and lattice components, as well as the mechanical behavior and advantages of supporting beams. Sangree [6] analyzed the overall and component stress performance of four wooden covered bridges through experimental testing and finite element method. The research objects of these studies are timber- arch covered bridges, which are different from the structural form and material category of reinforced concrete continuous beam-type covered bridge investigated.
The research on covered bridges in dynamics has been primarily paid attention to elastic analysis or linear time history analysis under earthquake action. Several studies have contributed to this field. Yang [7] conducted the static and dynamic mode analyses of a covered bridge with and without superstructure during the construction and completion stages. Xu et al. [8] analyzed the weak locations and bearing capacity of the structure under rare earthquakes by changing the direction of earthquake input for a covered bridge with rubber isolation bearings. Wang [9] developed a covered bridge model considering the upper covered structure and a bridge model. The influence of the superstructure on the static performance of the bridge structure was analyzed, and the seismic performance of the two models was compared using the response spectrum method and time history analysis method. However, the effects of nonlinear factors were not considered in the analysis. Chen [10] and Xie [11] have conducted dynamic analysis for arch covered bridges and used time history analysis as a result verification. Song et al. [12] took a three span prestressed concrete continuous covered bridge as an example to conduct nonlinear dynamic analysis, forming vulnerability curves for piers and bearings, and deducing the upper and lower bounds of the system vulnerability curves for the entire covered bridge model and bridge model. The impacts of the superstructure on the vulnerability of the bridge system were analyzed. It was concluded that the superstructure has a significant effect on the seismic vulnerability of the bridge system, and the probability of serious and complete damage to the bridge was significantly increased. Lu [13] carried out linear and nonlinear time history analysis to evaluate the isolation design for a commercial covered bridge equipped with lead rubber bearings (LRB) under earthquakes. The results showed that suitable LRBs can achieve a good isolation effect for the covered bridge. Zhang et al. [14] determined the seismic fortification category of commercial covered bridge structures using specific engineering cases and corresponding standards. They also compared the seismic response between overall covered bridge and bridge models in response spectrum analysis, while analyzing the impact of the upper building structure on the seismic capacity of the bridge structure.
It was noted that the construction of conventional timber covered bridges was relatively common, but the main focus abroad has primarily been on repair [15], protection [16], and rehabilitation [17]. It is significant to go deeper into the seismic performance of covered bridges in seismic prone areas. The special structural system of commercial beam-type covered bridges is quite distinct from ordinary bridge structures and building structures. The seismic damage of a covered bridge would also include the damage to bridge structure and building structure. The response of any single structural system under earthquake action may not accurately reflect the overall structural response of a covered bridge. Therefore, conducting seismic performance research on various components of a covered bridge structure solely from the perspective of building or bridge structures, while neglecting the interaction between the two, may lead to inaccurate conclusions. In addition, the impacts of bearings on the structure of covered bridges should also be given due attention and discussion.
The response spectrum analysis of covered bridges in previous studies was linear elastic analysis, which cannot be directly applied when the structures enter the plastic working stage under strong earthquakes. Meanwhile, the envelope value of the structural response obtained from the response spectrum method cannot reflect the experience of the structure during seismic actions, nor can it reflect the impact of seismic duration. The process of structural responses changing with seismic actions can be obtained in linear dynamic time history analysis, but the nonlinear behavior of the structure is not considered, which also can be found in the response spectrum method. In terms of structure, previous research have mainly focused on the impact of the upper building structure on the lower bridge structure, and the analysis of influencing factors is not comprehensive enough.
This study developed Finite Element Models (FEMs) for frame building structure, bridge structure, and entire covered bridge structure with considering various types and arrangements of bearings. The incremental dynamic analysis (IDA) method [18] was employed to conduct in-depth research on the effects of the interaction between the superstructure (building structure on the bridge) and the substructure (bridge structure) and bearing mechanical property on the seismic responses of covered bridge structure, spanning from the elastic to elastic-plastic stages. Moreover, the seismic performance of the beam-type covered bridge was assessed under two-level seismic hazard. It is noted that this study incorporates the nonlinear behaviors of the covered bridge structure, which aims not only the influence of the building structure on the bridge structure, but also how the lower structure affects the upper structure.
2. Case study
2.1. Benchmark covered bridge
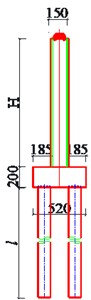
An existing beam-type covered bridge in China has been selected in the present study. The total length of the bridge is 75.90 m, and the width is 29.20 m (Fig. 1). The site of the covered bridge is situated in Seismic Zone II of the Chinese seismic zoning. The designed peak acceleration of the ground motion for the covered bridge is 0.2 g, and the predominant period of site is 0.4 s.
The superstructure of the covered bridge is integrated onto the bridge. The local three-story frame structure has a height of 21.5 m, and dimension of 75.0 m×22.8 m. The concrete strength of members of the superstructure is 35 MPa. The reinforcements embedded in the covered bridge are HPB300, HRB335, and HRB400. The diameter of the columns from bridge deck to elevation of 6.400 m (the 1st floor) is 0.8 m, while the diameter of columns in other floors (the 2nd floor and 3rd floor) is 0.7 m. Longitudinal reinforcements vary in configuration depending on the position of the column, with main diameters of 32 mm, 28 mm, 25 mm, 22 mm, and 20 mm. The stirrups have a diameter of 8mm.
Fig. 1Configuration of the beam-type covered bridge (unit: cm)
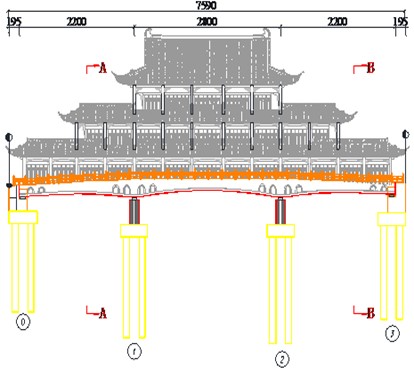
The transverse layout of the beam-type covered bridge is as follows: 3.2 m (pedestrian street) + 2.4 m (veranda) + 18 m (shopping mall) + 2.4 m (veranda) + 3.2 m (pedestrian street). This design integrates the shopping mall and the bridge into an urban complex. The girder of the bridge is a cast-in-place box girder with variable height, having a length of 72 m, with the main span being 28 m and two end spans of 22 m each. The concrete strength of the bridge girder is 50 MPa. Spherical steel bearings (SSB) are used in the bridge structures.
Fig. 2Round ended solid wall pier (unit: cm)
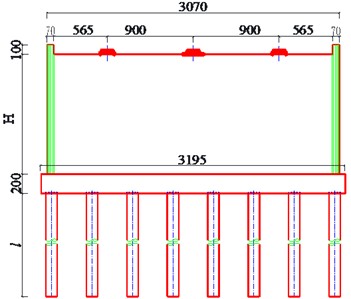
a) Elevation
b) Lateral view
The girder bridge is supported by two round-ended reinforced concrete (RC) wall piers. The height of each pier is 4.1 m, having a sectional dimension of 30.70 m×1.5 m (Fig. 2). The concrete strength of the wall piers is 40 MPa, and the diameters of longitudinal reinforcements and stirrups in the piers are 28 mm and 12 mm respectively, with 16 mm tie bars.
2.2. Designed cases
The essence of different bearing types and arrangements is reflected in the mechanical characteristics of bearings. To explore the impact of bearing types on the seismic performance of covered bridges, this study compared the use of hyperbolic spherical isolation bearings (HSIB). Furthermore, 3 and 5 spherical steel bearings (SSB) were placed on each pier or abutment to investigate the influence of bearing arrangements. It is important to note that considering the interaction between the superstructure and substructure involves not only about changes in structural stiffness, but also changes in structural mass. Based on the research objectives, the cases of the beam-type commercial covered bridge are designed, as shown in Table 1. The nomenclature of the finite element models can be seen in Table 2.
Table 1Designed cases
Case | a | Typeb | Model |
A | 0 | Spherical steel bearing (SSB) | Superstructure |
B | 3 | SSB | Covered bridge structure |
C | 5 | SSB | Covered bridge structure |
D | 3 | SSB | Substructure |
E | 5 | SSB | Substructure |
F | 3 | Hyperboloid spherical isolation bearing (HSIB) | Covered bridge structure |
aThe number of bearings on the top of each pier or abutment bThe type of bearings installed on the top of each pier or abutment | |||
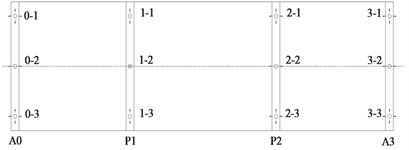
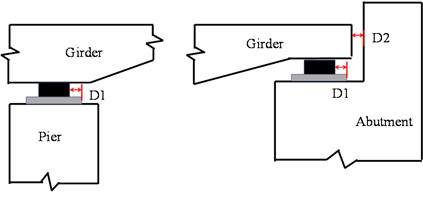
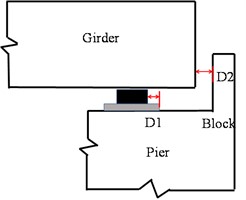
The distinction between case B and case C, as well as case D and case E, mainly rests with the contrast in stiffness after bearings sliding. The diversity between case B and case F lies in the entire restoring force model, that is, the initial stiffness and the stiffness after sliding are inconsistent. The layout of bearings for case B and case D and case F are shown in Fig. 1. A0 and A3 represent abutments, and P1 and P2 denote wall piers. When spherical steel bearings are installed on the piers, P1 serves as a fixed pier. The bearing layouts for case C and case E indicates the installation of 5 bearings on each pier or abutment. *–1, *–2 and *–3 represent the bearings equipped on bridge abutments or piers.
Table 2Nomenclature of the finite element models
Model | Interpretation |
Covered bridge structure | The whole structure includes the superstructure and substructure |
Superstructure | The building frame structure includes the columns and beams |
Substructure | The bridge structure includes the girder, bearings and wall piers |
2.3. Structural models
The general finite element analysis program OpenSEES was used to carry out all of the analyses. A series of 3D nonlinear models was constructed to encompass the inherent variability presented in the covered bridge considered in this study. Each of these models incorporated the major components such as the superstructure, i.e. building frame structure and substructure, i.e. bridge structure including bearings and wall piers.
The constitutive relationship of the concrete, as proposed by Kent-Scott-Park et al. [19], was defined using Concrete02. The reinforcement was defined using the Menegotto-Pinto [20] stress-strain relationship that included the isotropic strain hardening property. Steel02 was employed to accurately describe the deformation characteristics of bars. The initial loading curvature coefficient and the degeneration coefficients of curvature and under reciprocating loading, and the strain hardening coefficient of bars are taken as 18.5, 0.925, 0.15 and 0.01, respectively.
Fig. 3FEM of the beam-type covered bridge
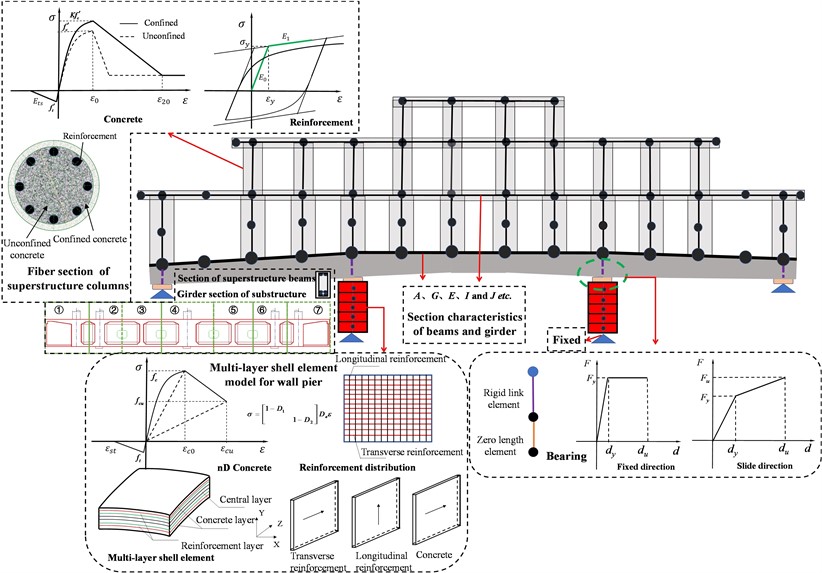
The RC columns of the superstructure were modeled with the force-based beam column elements. The cross-section of the beam column element adopted the fiber cross-section was composed of concrete fibers for the core area, concrete fibers for the protective layer, and reinforcement fibers, as shown in Fig. 3. Corresponding material models were assigned to different fibers. Shear and torque springs were added to simulate the shear and torsion characteristics of the cross-section. For simplicity in modeling, elastic beam column elements were used for framed beams simulation. The floor panels and other ancillary facilities of the superstructure were applied as dead loads to the FEMs.
It is considered unlikely that the girder will behave in a nonlinear fashion under seismic excitation. Due to the large width of the main girder of the covered bridge, it is obviously not suitable to use a single beam element to simulate. In line with the position of the columns and bearings in the superstructure, the girder was divided into seven parts horizontally (Fig. 3). Each part was modeled using elastic beam element having equivalent stiffness and mass. The cross-sectional characteristics of the elements including sectional area, elastic modulus, and moment of inertia, etc. were obtained based on the material properties and cross-sectional dimensions of the girder. They were assigned to the elastic beam elements of girder in sequence. The separated parts were connected by rigid beams to form a grillage structure.
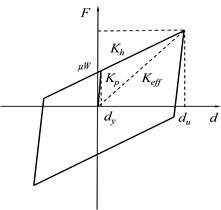
The bearings were modeled by a zero-length link element. The hysteretic behavior of SSB was represented using a bilinear kinematic model available in OpenSEES (Fig. 3). Parameters such as the initial stiffness , post-yield hardening ratio , and yield force were needed to define the hysteresis behaviors, which were obtained from the design parameters of SSB in the covered bridge. The HSIB can be used as both a fixed bearing and a sliding bearing, and had a large stiffness after yielding. The restoring force model of HSIB can be approximately bilinear, as shown in Fig. 4.
Fig. 4Details of hyperboloid spherical isolation bearing
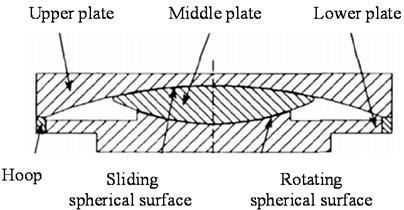
a) Diagrammatic sketch
b) Restoring force model
The parameters of bearings for case B and case C, and case F were shown in Table 3. In the table, 0-0, 1-0, and 2-0 represent the side bearings when 5 bearings are arranged on the bridge abutment or pier. and represent the initial stiffness and stiffness yield ratio, respectively. The seismic actions were bidirectional input along the longitudinal (H1) and transverse (H2) directions of the structure.
The wall piers were modeled using a multi-layer shell element [21] (Fig. 3) based on the principle of composite strength of materials, which was divided into one or more orthotropic reinforcement layers and several concrete layers with equivalent thickness according to the reinforcement situation and actual size of the component. The concrete in the layered shell model was two-dimensional concrete material (nDMaterial PlaneStressMaterial) on basis of damage mechanics and diffuse crack model. is an elastic constitutive matrix, and and are scalar damages in tension and compression, respectively. It can be expressed as:
where, the relationship between equivalent stress and principal stress is as follows:
Table 3Mechanical properties of bearings (kN/m)
Case B | Direction | A0 | |||||
0-0 | 0-1 | 0-2 | |||||
H1 | – | – | 6.00e+04 | 0.0850 | 3.75e+04 | 0.1441 | |
H2 | – | – | 6.00e+04 | 0.3311 | 3.94e+06 | 0 | |
Direction | P1 | ||||||
1-0 | 1-1 | 1-2 | |||||
H1 | – | – | 7.88e+06 | 0 | 7.88e+06 | 0 | |
H2 | – | – | 3.00e+05 | 0.1009 | 7.88e+06 | 0 | |
Direction | P2 | ||||||
2-0 | 2-1 | 2-2 | |||||
H1 | – | – | 3.00e+05 | 0.0259 | 2.25e+05 | 0.0390 | |
H2 | – | – | 3.00e+05 | 0.1009 | 7.88e+06 | 0 | |
Case C | Direction | A0 | |||||
0-0 | 0-1 | 0-2 | |||||
H1 | 2.25e+04 | 0.2492 | 3.75e+04 | 0.1441 | 5.25e+04 | 0.0991 | |
H2 | 2.25e+04 | 0.9708 | 3.75e+04 | 0.5614 | 3.94e+06 | 0 | |
Direction | P1 | ||||||
1-0 | 1-1 | 1-2 | |||||
H1 | 7.88e+06 | 0 | 7.88e+06 | 0 | 7.88e+06 | 0 | |
H2 | 1.13e+05 | 0.3567 | 1.50e+05 | 0.2544 | 7.88e+06 | 0 | |
Direction | P2 | ||||||
2-0 | 2-1 | 2-2 | |||||
H1 | 1.13e+05 | 0.0916 | 1.50e+05 | 0.0653 | 2.25e+05 | 0.0390 | |
H2 | 1.13e+05 | 0.3567 | 1.50e+05 | 0.2544 | 7.88e+06 | 0 | |
Case F | Direction | A0 | P1 | ||||
H | |||||||
4.2e+0.4 | 0.0281 | 2.10e+05 | 0.0169 | ||||
If , . Else, . is initial damage threshold, and when , 0. , , and are the characteristic parameters of materials obtained from uniaxial tensile test and compression test, respectively. After concrete cracking, the model considered the degradation of concrete shear stiffness through a shear transfer coefficient less than 1. The reinforcement in shell element was simulated using a multi-dimensional reinforcement material (nDMaterial PlateRebar) in a dispersed reinforcement layer. This reinforcement model was foundation on the existing uniaxial steel model of OpenSEES and developed from the angle of bars. The piers and bearings at the abutments have been modeled as fixed at the base and the pounding effect was not considered. The piers have been modeled using various elements with mass lumped at discrete points. The total number of nodes is 506, and the total numbers of column elements, beam elements, girder elements, bearing elements, and pier elements are 190, 366, 91, 18, and 340. The sum number is 1005.
2.4. Ground motions
A set of suitable earthquake records was chosen from the Pacific Earthquake Engineering Research Center (PEER) database and scaled as the ground motion inputs, as shown in Table 4. The seismic responses of covered bridge components were gained through the IDA method.
Table 4Records of original ground motions
No. | Ground motion | Seismic station | Component | PGA / g | / s | / s |
1 | San Fernando 1971 | LA - Hollywood Stor FF | 90 | 0.2248 | 0.01 | 79.44 |
180 | 0.1949 | |||||
2 | Tabas_ Iran 1978 | Boshrooyeh | – | 0.1055 | 0.02 | 34.98 |
– | 0.1081 | |||||
3 | Imperial Valley -06 1979 | Parachute Test Site | 225 | 0.1127 | 0.005 | 39.395 |
315 | 0.2055 |
Performance-based seismic design requires determining the seismic response and seismic capacity of a structure under a certain level of seismic action. At the core of assessing a structure's seismic performance lies the comparison between its capacity and demand. To ascertain if a structure's seismic response surpasses its capacity, conducting a seismic response analysis of the structure is paramount. The structural seismic response analysis is to establish the equations of the structure under seismic action, as shown in Eq. (4):
In the equation, [] represents the mass matrix, and [] is the damping matrix. [] is the structural stiffness matrix, and [ denotes the identity matrix. , , and represent the displacement, velocity, acceleration vectors, and the acceleration time history of ground motion, respectively. Inputting a series of seismic ground motion intensities and conducting a nonlinear time history analysis allows to obtain a structure’s seismic response by Eq. (4).
The first step in analyzing the dynamic response of a MDOF system is to get the periods of free vibration and the corresponding mode shapes of the structure, as it provides information related to the seismic response of the structure. If the vibration mode Eq. (5) has the nonzero solution, frequency equation can be derived as Eq. (6):
where, is the eigenvalue, and represents the eigenvector.
The modal analyses were conducted for case A and case B, and their basic periods were 0.6937 s and 0.7178 s, respectively. It can be deduced that the structures belong to medium to long period structures. Previous research has shown that PGV and corresponding to the first natural vibration period have an ideal correlation with medium to long period structures [22]. Therefore, when conducting nonlinear dynamic analysis, the spectral acceleration (, 5 %) was used as seismic intensity measurement (IM), and the seismic actions were bidirectional input [23]. The records were scaled based on the more severe component of the motion, and the same scale factor was applied to the other component as recommended by Somerville and Collins [24].
The Hunt & Hill method [25] was used to scale the seismic actions in order to study the responses of the covered bridge in the whole process from the elastic, elastoplastic and capacity limit state to the final collapse. The Hunt & Hill method was developed on the basis of the variable step method and has faster convergence.
Fig. 5Original ground motion record No. 3
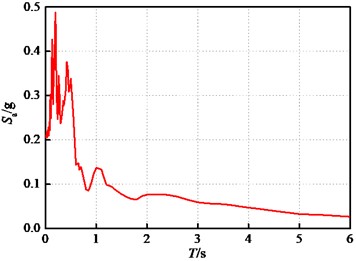
a) Response spectrum
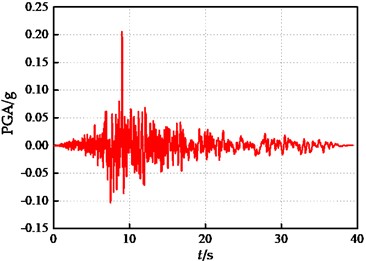
b) Acceleration time history
Fig. 5 shows the original record of ground motion No. 3 in the longitudinal direction taken as an example to illustrate the process of scaling. According to Fig. 5(a), the corresponding spectral acceleration with a damping ratio of 5 % is 0.1825 g, which means (, 5 %) = 0.1825 g. If (, 5 %) = 0.005 g was taken for the first analysis, the scaled coefficient 0.005/0.1825 = 0.0274. Then, the scaled coefficient was multiplied by the acceleration value of the original seismic record at each moment to obtain the acceleration of the -th analysis, i.e. .
Table 5Scaled coefficient λ of ground motions
No. | Formula | (, 5 %) / | |||
1 | 0.005 | 0.005 | 0.018 | 0.022 | 0.027 |
2 | 0.005+0.01 | 0.015 | 0.055 | 0.065 | 0.082 |
3 | 0.015+0.01+1×0.05 | 0.075 | 0.276 | 0.324 | 0.411 |
4 | 0.075+0.01+2×0.05 | 0.185 | 0.681 | 0.800 | 1.014 |
5 | 0.185+0.01+3×0.05 | 0.345 | 1.269 | 1.492 | 1.890 |
6 | 0.345+0.01+4×0.05 | 0.555 | 2.042 | 2.401 | 3.041 |
7 | 0.555+0.01+5×0.05 | 0.815 | 2.999 | 3.525 | 4.466 |
8 | 0.815+0.01+6×0.05 | 1.125 | 4.139 | 4.866 | 6.164 |
9 | 1.125+0.01+7×0.05 | 1.485 | 5.464 | 6.423 | 8.137 |
10 | 1.125+(1.485-1.125)/3 | 1.245 | 4.581 | 5.385 | 6.822 |
11 | 1.125+(1.245-1.125)/3 | 1.165 | 4.286 | 5.039 | 6.384 |
12 | (1.125+0.815)/2 | 0.970 | 3.569 | 4.196 | 5.315 |
13 | (0.815+0.555)/2 | 0.685 | 2.520 | 2.963 | 3.753 |
14 | (0.555+0.345)/2 | 0.450 | 1.656 | 1.946 | 2.466 |
15 | (0.345+0.185)/2 | 0.265 | 0.975 | 1.146 | 1.452 |
16 | (0.185+0.075)/2 | 0.130 | 0.478 | 0.562 | 0.712 |
17 | (0.075+0.015)/2 | 0.045 | 0.166 | 0.195 | 0.247 |
The scaled coefficients are presented in Table 5. No. denotes the scaled number of each seismic record. Following 17 times time history analyses, the seismic responses of components were obtained. The PGA ranges of ground motions in two directions after scaled are between 0.002 g~1.228 g and 0.002 g~1.6722 g, respectively.
3. Limit states of damages
For the damage of covered bridge, it can be divided into 5 damage states (DSs), corresponding to 4 limit states (LSs). The damage states of the components were defined as: no damage, slight damage, moderate damage, severe damage, and complete damage. The damage measurements (DMs) were used to quantify the limit values of LSs.
Previous studies have highlighted two indicators of RC frame structures: interlayer drift ratio [26-28] and structural vertex drift ratio [29-31]. The former is more commonly used. Accordingly, the maximum interlayer drift ratio and were adopted to serve as the DMs of the superstructure for the beam-type covered bridge. However, the seismic design code for buildings [26] only provided the elastic drift ratio limit of 1/550 and elastic-plastic drift ratio limit of 1/50 for RC frame structures, which is obviously not detailed enough in terms of quantitative indicators. There are no clear and unified limits for interlayer drift ratio. Based on the previous researches [26-28, 32-33], this study adopted the most unfavorable limit states as the principle, selecting 1/550, 1/400, 1/250, and 1/50 as the seismic performance evaluation index limits for the superstructure in each limit state.
At present, relative deformation or displacement is commonly used to represent the DM of bearings, while rubber bearings were often represented by shear deformation and displacement ductility ratio. The upper and lower surfaces of the spherical steel bearings are completely anchored between the beam bottom and the pier top, allowing the longitudinal and transverse displacement of the bearings to be used as the DMs. This study defined the failure states of the bearings based on geometric dimensions and physical parameters and the constitutive model in Fig. 3. The yield displacement and designed displacement were used as performance indicator values for LS1 and LS2, respectively. Considering the potential for bearings to slide out or slide on bridge piers or abutments under earthquake actions, the minimum distance and maximum distance between the effective support length of the pad stone and the clearance of the bridge abutment to the main girder in the longitudinal direction were taken as performance indicators for LS3 and LS4, respectively. Similarly, in the transverse direction, the minimum and maximum values between the effective support length of the pad stone and the gap of the lateral shear keys to the main girder were taken as performance indicators for LS3 and LS4, respectively, as illustrated in Fig. 6.
Fig. 6The damage limit states of SSB
a) LS3
b) LS4
The performance of the wall piers out-of-plane is analogous to that of common pier columns [34]. Consequently, in this study, the displacement drift ratio was chosen as the damage index for wall pier. The limit values of each damage state referenced from previous research [35], as illustrated in Table 6. Here, is defined as follows:
where represents the displacement at the top of the pier and denotes the height of the wall pier.
Previous studies [36] have shown that bridge wall piers generally perform well in the strong direction while the response in the weak direction could be critical. The wall pier response in plane was found to make a negligible contribution to vulnerability when directly subjected to the pushover analyses in the strong direction. Thus, the objective of this study targets at the seismic behavior of the wall pier in the weak direction, while the seismic response in the transverse direction analyzed additionally.
Table 6Division of each limit state for components of covered bridge
Component | LS1 | LS2 | LS3 | LS4 | |
Superstructure | 1/550 | 1/400 | 1/250 | 1/50 | |
Fixed bearing | / m | 0.001 | 0.02 | 0.0625 | 0.1325 |
/ m | 0.001 | 0.02 | 0.1000 | 0.1375 | |
Slide bearing | / m | 0.002 | 0.05 | 0.0625 | 0.1325 |
/ m | 0.002 | 0.04 | 0.1000 | 0.1375 | |
Wall pier | 0.11 % | 0.38 % | 0.84 % | 2.23 % | |
4. Results and discussions
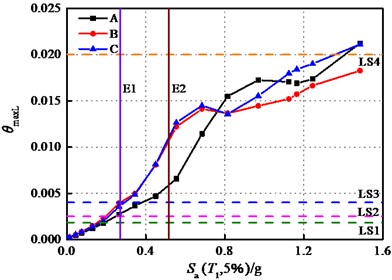
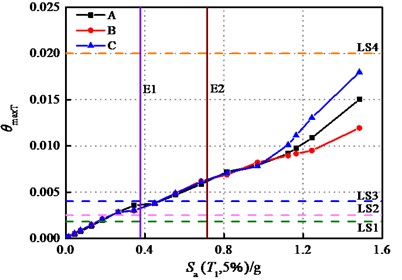
After inputting scaled seismic actions to case A, B, C, D and E, the seismic responses of the superstructure, bearings and wall piers of the covered bridge were obtained through nonlinear analyses. E1 and E2 in figures represent seismic actions with a 10 % probability of being exceeded in 50 years (PGA = 0.225 g, i.e. designed earthquake) and 2 % probability of being exceeded in 50 years (PGA = 0.4275 g, i.e. rare earthquake), respectively. The (, 5 %) () in the longitudinal direction are 0.272 g and 0.517 g, and in the transverse direction are 0.376 g and 0.715 g, respectively.
4.1. Superstructure
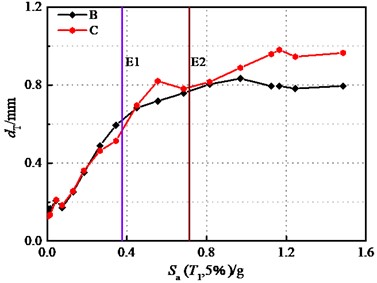
Fig. 7 shows the maximum interlayer drift ratios of the superstructure under longitudinal and transverse seismic actions. It can be evidently seen from Fig. 7(a) that when 0.763 g, the longitudinal peak value of the superstructure in case A is smaller than that in case B and case C, while the drift ratios in case B and case C are nearly equal. For 0.763 g, case C always has a greater displacement demand than case B, with the peak drift responses of case A surpassing that of case B and case C initially, but subsequently becoming smaller than those of case C after 1.079 g. Therefore, it can be concluded that due to the interaction between the upper building frame structure and the bridge structure, significant differences in seismic responses exist between the conventional building structure and superstructure of the covered bridge. What can be drawn from case B and case C is that it is the sliding stiffness of the bearings lead to the variation in longitudinal interlayer drift ratios of the superstructure. A smaller sliding stiffness leads to the corresponding minor drift ratio. When 0.555 g, the gaps of cases reaches the greatest, at which 0.007, 0.012, 0.013. The gap in seismic response can be quantified using the following equation:
where, represents the structural seismic responses of case B, and represents the responses of case A, C, D, and E.
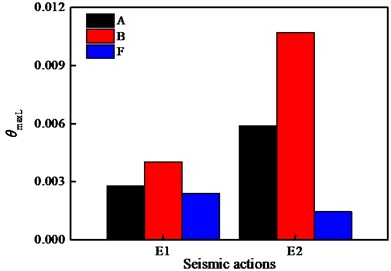
At the longitudinal seismic action of E1 and E2 IM levels, the maximum interlayer drift ratios of case B and case C are nearly identical, and the difference between the interlayer drift ratios of case A and case B are about 30.97 % and 43.42 %, respectively.
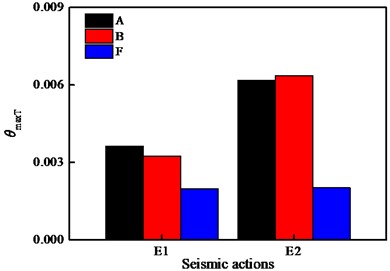
Fig. 7(b) illustrates that when 0.97 g, the magnitude of interlayer drift ratio in sequence is case B, case A, and case C. However, at the lateral seismic action of E1 and E2 IM levels, the cases sustain an identical drift ratio. Therefore, it can be explained that under the earthquakes may occur, the interaction between the superstructure and substructure is unfavorable for the longitudinal performance of the building structure of the covered bridge, while it is not sensitive to the lateral seismic response. The displacement of frame structure fixed on the ground is 0, but the bottom end of the superstructure column of covered bridge is consolidated with the bridge deck. If the bridge structure is treated as a column bottom constraint of building structure, the stiffness of this constraint is related to the stiffness of bridge structure. The yield ratios of longitudinal bearing stiffness are smaller than those of transverse bearing stiffness, and the longitudinal stiffness of bridge wall piers is much smaller than transverse stiffness.
Fig. 7Interlayer drift ratios of superstructure
a) Longitudinal
b) Transverse
The at each limit state are summarized in Table 7, and the seismic performance of superstructures under seismic actions was evaluated.
Table 7Sa(T1, 5 %) corresponding to performance benchmark (g)
Direction | Case | LS1 | LS2 | LS3 | LS4 |
H1 | A | 0.190 | 0.248 | 0.380 | 1.408 |
B | 0.154 | 0.196 | 0.269 | > 1.485 | |
C | 0.170 | 0.211 | 0.292 | 1.358 | |
H2 | A | 0.173 | 0.234 | 0.475 | > 1.485 |
B | 0.160 | 0.231 | 0.469 | > 1.485 | |
C | 0.161 | 0.231 | 0.469 | > 1.485 |
At the longitudinal E1 IM level, the superstructure of case A and case C both enter the moderate damage state, while the superstructure of case B reaches severe damage. In the transverse direction, the superstructures of all cases are in the moderate damage state. At the E2 IM level, the superstructures of various cases in both directions are in a severe damage state.
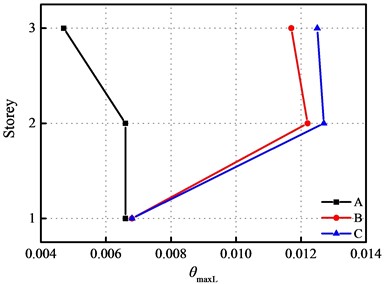
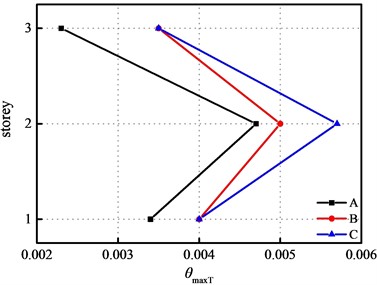
Due to changes in the diameters of the frame columns on the 3rd floor, the peak drift ratio occurs at the 2nd floor of the superstructure. The drift ratios of building structure at E2 IM level are presented in Fig. 8. That indicates case A has a relatively small drift ratio at the 3rd floor. The time history curves of interlayer displacements for case A and case B within the first 40 seconds are shown in Fig. 9. The time at which the longitudinal interlayer drift ratio reaches its maximum is 7.34 s and 7.88 s, respectively, while in the transverse direction, it is 4.69 s and 7.14 s, respectively. This suggests that the peak response of case A emerges earlier but smaller compared to that of case B. In this study, the superstructure retains substantially identical transverse drift ratio at E2 IM level.
Overall, the interaction between the building and the bridge would significantly make it disadvantageous to the longitudinal interlayer drift ratio of the superstructure of the covered bridge when the bearings remain a large stiffness. At the longitudinal E1 and E2 IM level, the existence of the bridge structure results in a gap over 30 % of the interlayer drift ratio. The sliding stiffness of the bearings can affect the seismic response of superstructure under extremely rare earthquakes. Although the superstructure of case B has entered the severe damage state under the longitudinal E1 IM level, on the whole, the at this state is close to the drift ratio limit value corresponding to the severe damage limit state. Moreover, when the seismic action is rarer than E1 IM level, the bearing distribution of case B is more conducive to reduce the interlayer drift ratio of the superstructure. When considering potential earthquakes, superstructures situated on bridge structures are more likely to suffer longitudinal damage than those located on the ground. According to the divided limit states, case A, case B, and case C have basically encountered moderate damage at the E1 IM level, while severe damage is observed at the E2 IM level.
Fig. 8Interlayer drift ratios of superstructure at E2 IM level
a) Longitudinal
b) Transverse
Fig. 9Time history curves of interlayer displacements at E2 IM level
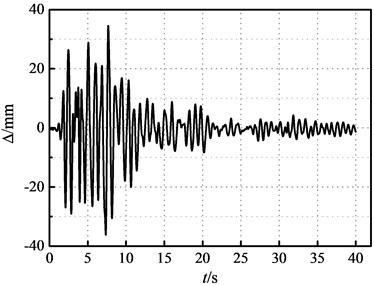
a) Case A
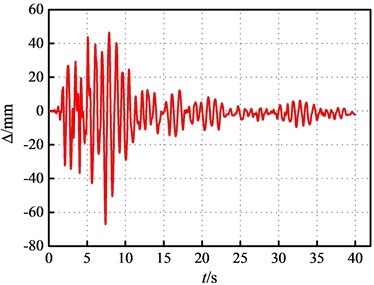
b) Case B
4.2. Bearings
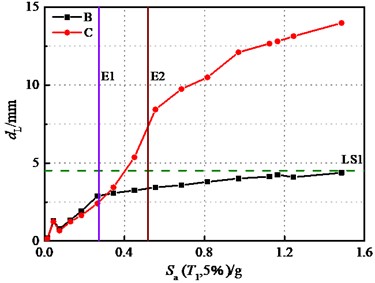
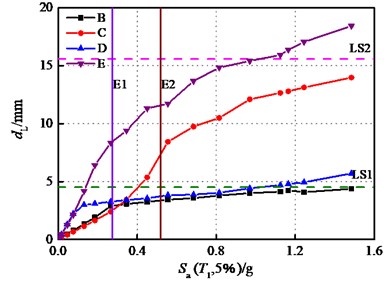
The displacement of sliding spherical steel bearing (SSB) for case B and case C is plotted in Fig. 10. Fig. 10(a) indicates that when 0.97 g, the bearing shifted from the normal working stage to the damage stage. Case B exhibits a less conservative demand in terms of longitudinal bearing displacement compared to the one from case C. This is because the bearings in case B provide smaller stiffness after sliding. Regardless of the magnitude of longitudinal motions, the sliding of the bearings in case B ultimately led to a collision between the girder and abutment, whereas the bearings in case C only reached the severe failure state.
It is evident in Fig. 10(b) that the lateral displacement of the bearings is minimally impacted by the sliding stiffness, but eventually leads to moderate failure. Both case B and case C only achieved the slight damage state at the E1 and E2 IM levels.
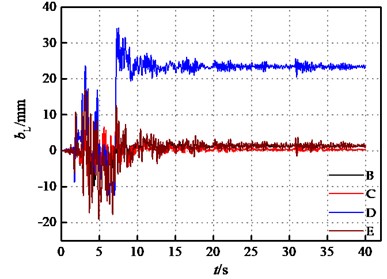
In this study, the time history analyses of case B, case C, case D and case E were performed by inputting the ground motion after 17-scaled seismic action of No. 1, so as to deeply investigate the influences of the superstructure – substructure interaction on the components of covered bridge. The effects of this interaction on the sliding displacement of the bearings are depicted in Fig. 11. It can be observed that the displacements of the bearings of case D and case E are generally greater than those of case B and case C. The longitudinal displacements of case D and case E exhibits significant dispersion, similar to Fig. 10(b), the transverse displacements shows a slight distinction due to the sliding stiffness. The bearings of case D even suffered complete damage in the longitudinal direction. However, the comparison here involves the seismic response generated by the scaled seismic action No.1, where the bearings of case B and case C only entered the slight damage state, whereas bearings of case D and case E both reached the moderate damage state.
Fig. 10Bearing displacements
a) Longitudinal
b) Transverse
Fig. 11Bearing displacements under the seismic action No. 1
a) Longitudinal
b) Transverse
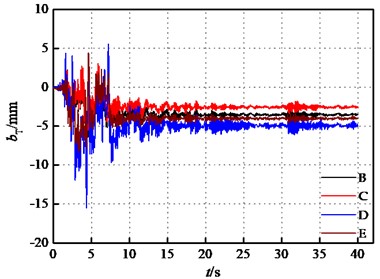
Fig. 12The bearing displacement time-histories at E2 IM level of seismic action No. 1
a) Longitudinal
b) Transverse
It can be concluded that the existence of the upper building significantly contributes to reducing the bearing displacements of the lower bridge structure. At the E2 IM level, the longitudinal displacement of the bearings in case D and case E increased by 2.30 and 1.02 times compared to case B, while the transverse displacement increased by 1.27 and 0.93 times, respectively. The time history curves of the bearing displacements in various cases at the E2 IM level are plotted in Fig. 12. The displacement in case D exceeds other cases, and it could not be restored to its original location in the longitudinal direction.
The drift ratio of the superstructure and the bearing displacement of the bridge indicate that, in potential seismic events, the stiffness distribution of the bearings has a limited effect on the structural seismic response of the covered bridge. But the existence of the lower bridge structure is adverse to the longitudinal seismic performance of the superstructure, while the presence of the upper building structure clearly mitigated the seismic response of the bearings. It can be revealed that the interaction between the building and bridge of the covered bridge has the opposite effects on the seismic response of the superstructure and bearings. Nevertheless, more details should be given to the seismic response of the bridge piers for a more comprehensive understanding.
The influences of the sliding stiffness of the bearings on the structural response were discussed in the previous section. The emphasis was placed on the sliding stiffness because the fixed bearing was installed, and its initial stiffness was relatively large, which played a decisive role in the seismic response of each component prior to sliding. To account for the impacts of the initial stiffness on the seismic response of the bridge, hyperboloid spherical isolation bearings (HSIB) were employed. Furthermore, in the longitudinal and transverse directions of seismic motions were adjusted to the corresponding spectral acceleration value of E1 and E2 to input for case F for comparison. It was found that the displacement of the wall pier is fractional, indicating that the HSIB reduced the displacement response of the pier. Thus, this study only focused on the seismic response of the frame building structure on the bridge and bearing itself when the HSIB was utilized.
Fig. 13Comparison of inter story drift ratios
a) Longitudinal
b) Transverse
Fig. 13 displays the comparison of the interlayer drift ratios of the building fixed on the ground and the building of the covered bridge with SSB and HSIB, while Fig. 14 pictures the displacements of the two types of bearings. It is notable that . At the E1 IM level, and . The contrastive result of interlayer drift ratios in the longitudinal and transverse directions at the E2 IM level is consistent with the trend at the longitudinal E1 IM level. The isolation effectiveness for the superstructure at the two levels are 40.54 %, 86.57 % respectively in the longitudinal direction, and they are 39.33 %, 68.36 % in the transverse direction. The damage state of the superstructure at E1 IM level changes from moderate to slight, which alters from severe to slight at E2 IM level in the longitudinal direction, while it shifts from severe to intact in the transverse direction. The SSB suffers the minor damage due to the fixed bearings based on the DMs, and the HSIB generates a significant amount of energy dissipation under the seismic actions. At the longitudinal and transverse E1 IM level, the displacements of HSIB are 46.97 mm and 44.10 mm, respectively, and those at the E2 IM level are 106.66 mm and 104.84 mm, respectively. The peak transverse displacements of the building structure are 59.81 mm, 59.70 mm, 125.96 mm, and 132.74 mm, respectively.
Fig. 14Comparison of bearing displacements
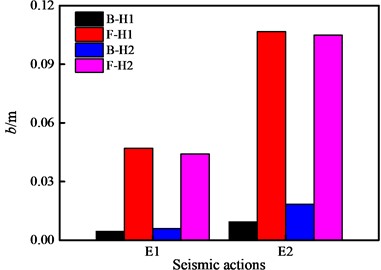
Case A can be conceptualized as having infinitely large bearing stiffness, while the stiffness of case F is smaller than that of case B. Fig. 13 illustrated that the greater the stiffness of the bearings, the greater the inter story drift ratios of the superstructure, especially when considering the interaction between the building and bridge. The HSIB significantly reduced the seismic response of building structure. Fig. 14 depicted the reason for this phenomenon, which was that the HSIBs have undergone a noticeable sliding, causing the translation of the upper building. However, case A was consolidated and the bearing stiffness of case B was relatively high, which was equivalent to strong constraints, leading to the more obvious vibration of the upper building during earthquakes. Due to the large lateral stiffness of the bridge pier and the bearings compared to both in the longitudinal direction, case A has a negligible dissimilarity in transverse interlayer drift ratios with case B. If only the influence of bearings is considered, the longitudinal response of the superstructure of case B should theoretically be weaker than that of case A. But Fig. 13(a) contradicted the notion. Thereupon, it can be concluded that the longitudinal stiffness and mass of wall piers amplified the seismic response of the superstructure of covered bridge.
Referring to the limit states above, the superstructure of the covered bridge installed with HSIB is only slightly damaged. The seismic performance for HSIB necessitates that the restrainer be damaged to allow the bearings to fulfill their role in seismic reduction and isolation, while the bridge piers and foundations remains elastic or nearly elastic under designed and rare earthquakes. The displacements of HSIB have exceeded the yield displacement, but they still fell within the design displacement range. It can be considered that the HSIB is within the slightly damaged state. However, the sliding of the HSIB could potentially cause collisions between the main girder and abutment or stop. Although collision effects were not considered in this article, it is essential to note that the overall structure of the covered bridge may actually face safety risks.
4.3. Wall pier
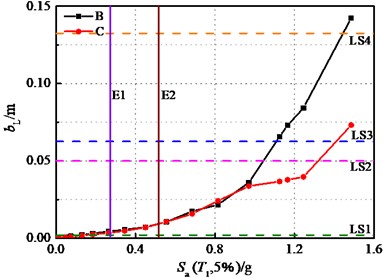
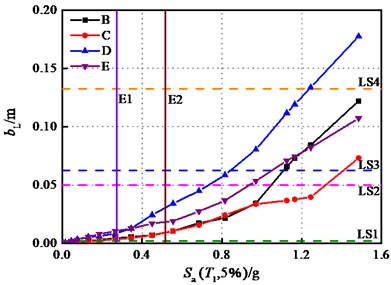
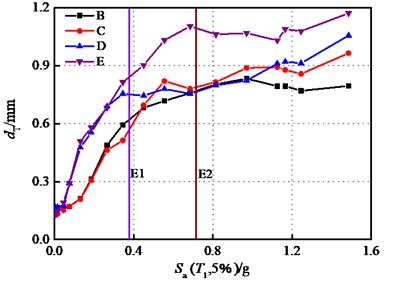
Fig. 15 illustrates the influences of the bearing stiffness on the displacement response of wall piers. All analyses in this study centered on fixed pier without considering the transverse damage of wall pier. The values of LSs were calculated based on Table 6 and the height of pier.
The longitudinal displacement of bridge pier in case B consistently remains smaller than that of case C when 0.304 g, and the transverse displacement demand contains below that of case C after 0.45 g. Under the seismic actions, case B remains slightly damaged as the ground motion intensity increased, while case C ultimately reaches the moderate damage state at the E2 IM level, with the displacement of the bridge pier in case C being 2.16 times that of case B. As a result, it can be explained that a well-considered distribution of bearings can effectively reduce the damage to bridge piers.
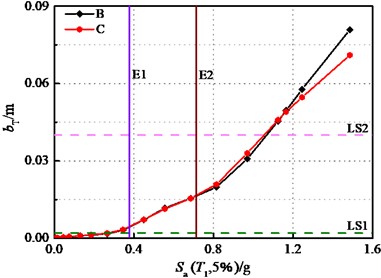
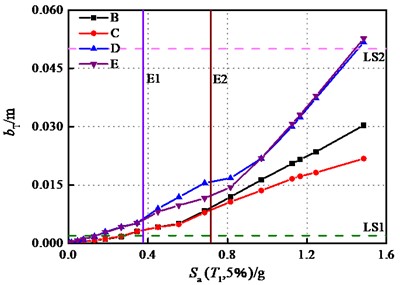
Fig. 16 further demonstrates that whether there is a superstructure or not, the stiffness of bearings has an important impact on the seismic response of the pier. Case D and case E indicate that this effect is more pronounced when there is no interaction between the building and the bridge. The pier displacements of case B and case D are under the displacement demands of case C and case E. The displacement gap between case B and case D is minimal, while case C and case E exhibit a relatively significant disparity. That implies the effect of the upper building on reducing the seismic response of the bridge piers equipped with bearings of smaller sliding stiffness is limited, which contrasts with the impact on wall piers installed with stiffer bearings.
Fig. 15Displacements of wall pier: (Part I)
a) Longitudinal
b) Transverse
Fig. 16Displacements of wall pier: (Part II)
a) Longitudinal
b) Transverse
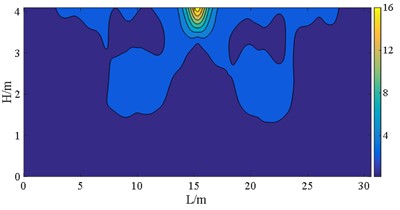
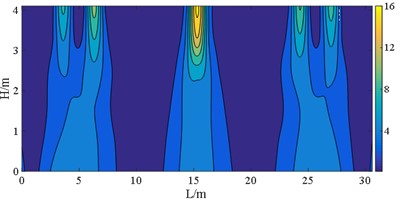
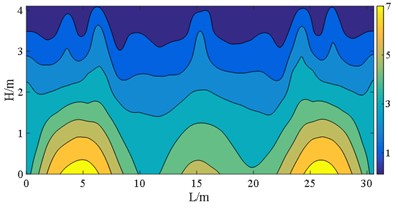
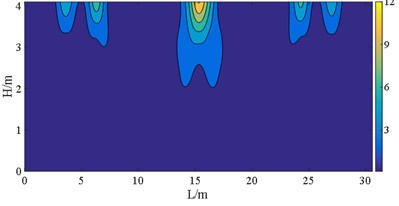
The displacement cloud maps of case B, case C, case D, and case E at E2 IM level are depicted in Fig. 17. Fig. 17(a) indicates that the maximum longitudinal displacements of the pier in cases B and D are located at the intermediate bearings, whereas the maximum longitudinal displacements of cases C and E position near the end bearings. Fig. 17(b) throw light on that the maximum lateral displacement occurs at the middle bearings, which is consistent with the theoretical expectations. Because of the assigned end bearings at the wall pier, cases C and E exhibit a broader range of transverse displacement response, covering almost the entire pier. The displacement cloud map shows that the displacement at each node of the same pier height of the wall type bridge pier is not the same. The reason is that due to the arrangement of larger stiffness bearings allowing for the complete transmission of seismic forces to the bridge piers, while the geometric characteristics of wall piers with larger widths indicate that their displacements are not identical as ordinary column piers. Consequently, it proclaims the distribution of bearings not only affects the value of displacement, but also plays an indispensable role in the displacement response of the wall pier at various locations. The closer to the bearings, the greater the deformation of the bridge pier due to its constraint effect, and the more significant the change in displacement.
Fig. 17Pier displacements at E2 IM level (unit: m)
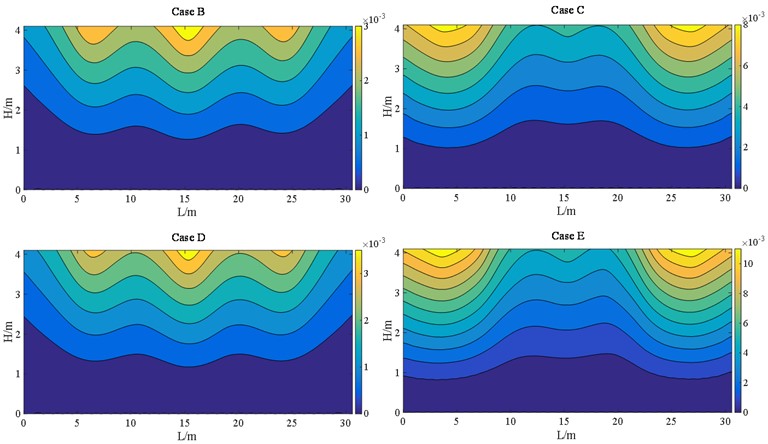
a) Longitudinal
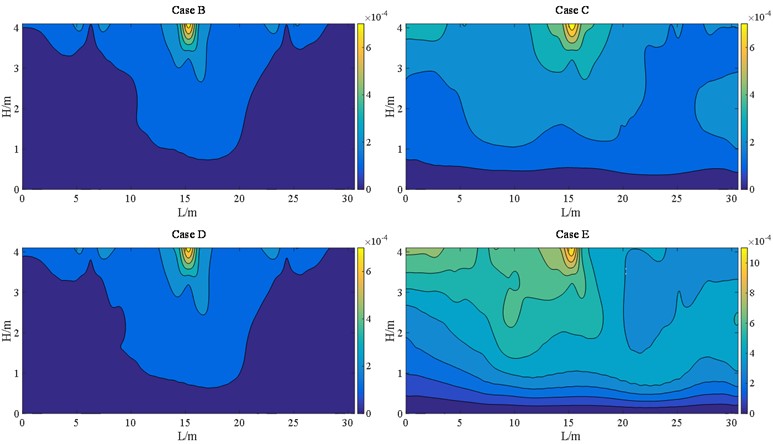
b) Transverse
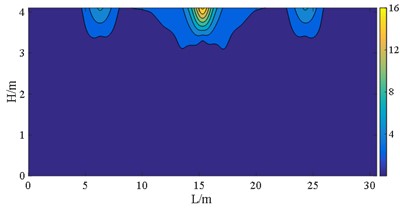
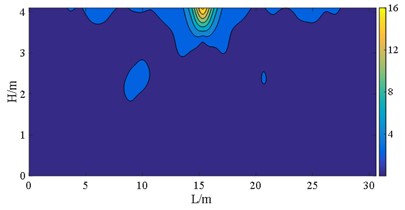
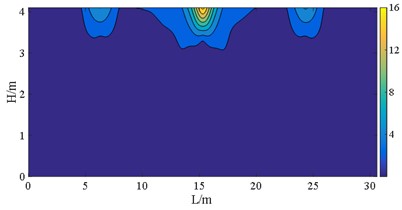
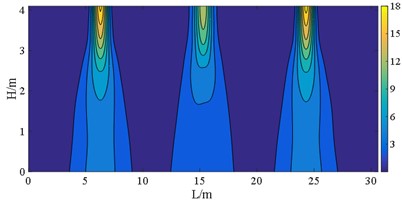
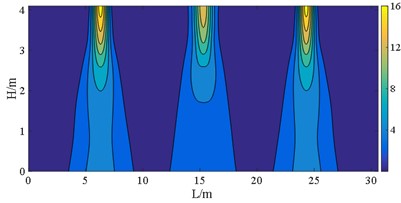
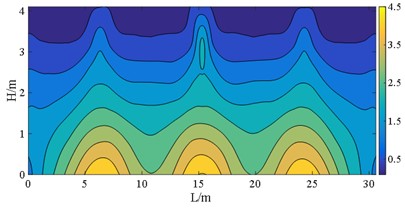
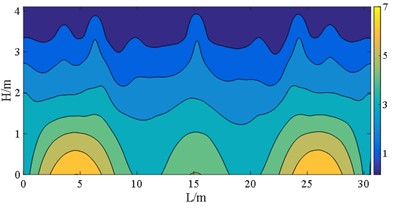
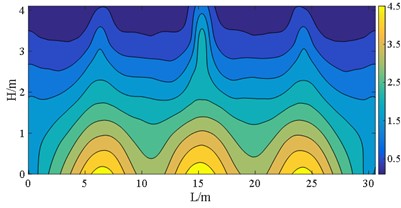
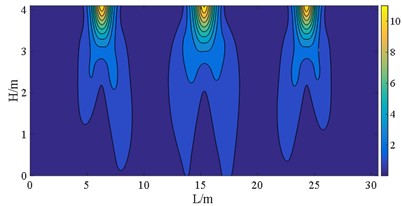
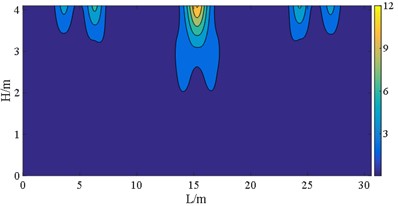
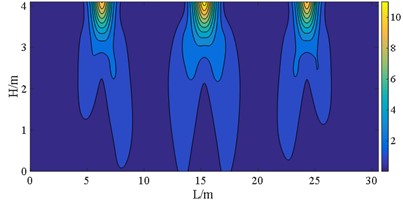
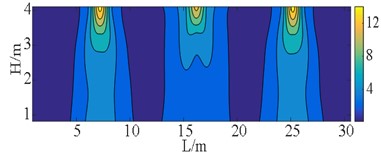
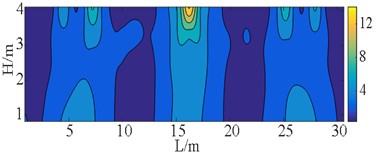
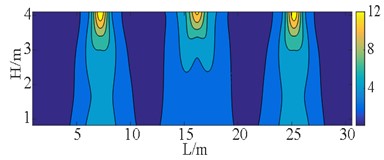
The stress S11, S22, S12, and S23 of the wall pier are depicted in Fig. 18 to Fig. 21. Here, S11 and S22 represent the principal stresses, while S12 and S23 represent the shear stresses. These stresses are expressed in the local coordinate system. In terms of superstructure - substructure interaction, there is no significant difference in displacement response between case B and case D at E2 IM level, as discussed in preceding section. As a consequence, the cloud atlases including VON-Mises stress of the two cases are in good agreement, as revealed from Fig. 16 to Fig. 22.
The figures demonstrate that the distribution of bearings can reflect the stress of the wall pier shafts. The coverages of S11 and S22 in case C are wider than those normal stresses of case B, and a similar comparison can be made between case E and case D. The stress range here refers to the area over which the stress occurs. However, the bearing arrangements in case D and case E are more favorable for S12. The stress concentrations can be observed in pier shafts of case C and case E in Fig. 18. Fig. 19 shows the peak S22 in case B is 4 MPa larger than stress of case C, the more dispersed vertical loads borne by the bearings in case C. But S23 and S12 in case C and case E present the contrary behavior to case B and case D, respectively. That indicates that larger sliding stiffness leads to higher shear stress, which is also well illustrated from Von-Mises stress. The peak stress on the wall pier remains within the strength of C40, satisfying with a given performance objective.
Fig. 18S11 at E2 IM level (unit: MPa)
a) Case B
b) Case C
c) Case D
d) Case E
Fig. 19S22 at E2 IM level (unit: MPa)
a) Case B
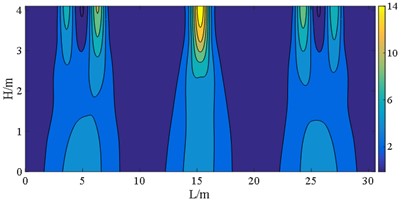
b) Case C
c) Case D
d) Case E
Research has shown that arranging bearings with lower sliding stiffness on each bridge pier is profit for withstanding the seismic forces acting on the superstructure. Irrespective of whether the interaction between the upper building structure and lower bridge structure is considered, these bearings disposing also helps to reduce the displacement and stress on wall piers. Considering the interaction between the upper building and the bridge can effectively decrease the displacement and stress distribution range of bridge piers with bearings of higher stiffness. Yet, the impact on the displacement and normal stress response of the bridge piers with bearings of lower stiffness is limited.
Fig. 20S23 at E2 IM level (unit: MPa)
a) Case B
b) Case C
c) Case D
d) Case E
Fig. 21S12 at E2 IM level (unit: MPa)
a) Case B
b) Case C
c) Case D
d) Case E
Fig. 22Von-Mises at E2 IM level (unit: MPa)
a) Case B
b) Case C
c) Case D
d) Case E
5. Conclusions
The goal of this study is to comprehensively investigate the seismic performance of the covered bridge, considering bearing stiffness and the interaction between the superstructure and substructure. Model variabilities have been thoroughly examined through times history analyses. The evaluations of the covered bridge under designed earthquake and rare earthquake, based on Chinese seismic design codes, were conducted. The following conclusions can be drawn:
1) The interaction between the superstructure and substructure can effectively reduce the displacement of bearings, as well as the displacement and stress distribution of the bridge pier with bearings of larger sliding stiffness. However, the impact on the displacement and stress response of the bridge pier with bearings of smaller sliding stiffness is limited. This interaction is unfavorable for the longitudinal seismic resistance of upper building structure of covered bridge subjected to maximum considered earthquake ground motions.
2) Bearings with smaller sliding stiffness are more beneficial for the seismic performance of the building structure and wall piers of the covered bridge, but it will also lead to an increase in displacements of bearings themselves. Additionally, greater stiffness of the bearings results in larger interlayer drift ratios of building frame structure of covered bridge.
3) The superstructure of covered bridge equipped with spherical steel bearings with lower sliding stiffness has primarily reached the moderate damage state during the designed earthquake and has suffered severe damage during rare earthquake. The wall pier of the covered bridge remains slight damage during the designed longitudinal earthquake. However, during the rare longitudinal earthquake, piers with spherical steel bearings of greater sliding stiffness experienced moderate damage.
4) The superstructure of the covered bridge utilized hyperboloid spherical isolation bearings keeps intact under the rare earthquake and incurred only slightly damage under earthquakes of other levels. Nevertheless, it's important to note that the sliding of hyperboloid spherical isolation bearings may cause face safety risks to the covered bridge. Thus, the arrangement of spherical steel bearings with smaller sliding stiffness is more advantageous to the whole beam-type covered bridge.
Covered bridges have gradually become iconic modern urban bridges with unique and complex structural forms, and their seismic performance research would be thorough and systematic. This study is based on deterministic analysis of the Chinese specifications, and it could be conducted the probability based seismic vulnerability analysis of covered bridges. The structural style of covered bridges is diverse, manifested in the differences in bridge structures. Further analysis of covered bridges with other types of bridge structures, such as arch bridges, could be carried out to fillful the field of this special structure in seismic engineering.
References
-
D. M. Mead, “Wave propagation in continuous periodic structures: research contributions from southampton,” Journal of Sound and Vibration, Vol. 190, No. 3, pp. 495–524, Feb. 1996, https://doi.org/10.1006/jsvi.1996.0076
-
Sreadha A. R., Dr. C. Pany, and M. V. Varkey, “A review on seismic retrofit of beam-column joints,” International Journal for Modern Trends in Science and Technology, Vol. 6, No. 9, pp. 80–93, Oct. 2020, https://doi.org/10.46501/ijmtst060914
-
J. Seo, T. K. Hosteng, B. M. Phares, and J. P. Wacker, “Live-load performance evaluation of historic covered timber bridges in the united states,” Journal of Performance of Constructed Facilities, Vol. 30, No. 4, p. 04015, Aug. 2016, https://doi.org/10.1061/(asce)cf.1943-5509.0000852
-
A. Machtemes, “Investigation of the structural behavior of historical covered timber bridges,” Iowa State University, Iowa, Apr. 2022.
-
D. M. Lamar and B. W. Schafer, “Structural analyses of two historic covered wooden bridges,” Journal of Bridge Engineering, Vol. 9, No. 6, pp. 623–633, Nov. 2004, https://doi.org/10.1061/(asce)1084-0702(2004)9:6(623)
-
R. H. Sangree, “Covered wooden bridges: An experimental and numerical investigation of system and component behavior,” John Hopkins University, Maryland, 2006.
-
T. T. Yang, “Study on landscape covered bridge of continuous rigid structure,” (in Chinese), Chongqing Jiaotong University, Chongqing, 2012.
-
G. L. Xu, H. Huang, and Y. S. Bai, “Study on seismic response of some gallery bridge under great earthquake,” (in Chinese), World Earthquake Engineering, Vol. 30, No. 4, pp. 174–179, 2014.
-
T. W. Wang, “Research on mechanical behavior of long-span reinforced concrete arch covered bridge,” (in Chinese), Southwest Jiaotong University, Chengdu, 2014.
-
L. Chen, “Study on dynamic characteristics and seismic response of reinforced concrete arch covered bridge,” (in Chinese), Xihua University, Chengdu, 2016.
-
Y. Xie, “The seismic performance analysis of bridge-building composite system,” (in Chinese), Southwest Jiaotong University, Chengdu, 2014.
-
S. Song, Y. J. Qian, and B. Feng, “Analysis on seismic fragility of landscape covered bridge considering bridge-building interaction,” (in Chinese), Journal of Highway and Transportation Research and Development, Vol. 32, No. 6, pp. 95–102, 2015.
-
W. Z. Lu, “Seismic isolation analysis and design of a long-span continuous steel truss bridge,” (in Chinese), Building Structure, Vol. 48, No. 9, pp. 14–18, 2018.
-
X. Q. Zhang and Y. B. Pu, “Seismic design and seismic response analysis of arch gallery bridge,” (in Chinese), Journal of Municipal Technology, Vol. 37, No. 4, pp. 82–86, 2019.
-
Q. Chun, K. van Balen, J. Pan, and L. Sun, “Structural performance and repair methodology of the Wenxing Lounge Bridge in China,” International Journal of Architectural Heritage, Vol. 9, No. 6, pp. 730–743, Aug. 2015, https://doi.org/10.1080/15583058.2015.1041191
-
J. P. Wacker and S. R. Duwadi, “Overview of the national historic covered bridge preservation (NHCBP) Program,” in Structures Congress 2010, pp. 509–518, May 2010, https://doi.org/10.1061/41130(369)47
-
C. C. Spyrakos, E. L. Kemp, and R. Venkatareddy, “Seismic study of an historic covered bridge,” Engineering Structures, Vol. 21, No. 9, pp. 877–882, Sep. 1999, https://doi.org/10.1016/s0141-0296(98)00041-8
-
D. Vamvatsikos and C. A. Cornell, “Incremental dynamic analysis,” Earthquake Engineering and Structural Dynamics, Vol. 31, pp. 491–514, 2002, https://doi.org/https://doi.org/
-
B. D. Scott, R. Park, and M. J. N. Priestley, “Stress-strain behavior of concrete confined by overlapping hoops at low and high strain rates,” ACI Journal Proceedings, Vol. 79, No. 2, pp. 13–27, 1982, https://doi.org/10.1016/0378-7788(82)
-
M. Menegotto and P. E. Pinto, “Method of analysis for cyclically loaded R. C. plane frames including changes in geometry and non-elastic behavior of elements under combined normal force and bending,” in Proceeding, Symposium on the Resistance and Ultimate Deformability of Structures Acted on by Well Defined Repeated Loads, pp. 15–22, 1973.
-
X. Lu, L. Xie, H. Guan, Y. Huang, and X. Lu, “A shear wall element for nonlinear seismic analysis of super-tall buildings using OpenSees,” Finite Elements in Analysis and Design, Vol. 98, pp. 14–25, Jun. 2015, https://doi.org/10.1016/j.finel.2015.01.006
-
Y. Cheng and G. L. Bai, “Basic characteristic parameters and influencing factors of long-period ground motion records,” Journal of Vibroengineering, Vol. 19, No. 7, pp. 5191–5207, Nov. 2017, https://doi.org/10.21595/jve.2017.18006
-
W. K. Lee and S. L. Billington, “Performance-based earthquake engineering assessment of a self-centering, post-tensioned concrete bridge system,” Earthquake Engineering and Structural Dynamics, Vol. 40, pp. 887–902, 2011.
-
P. Somerville and N. Collins, “Ground motion time histories for the I880 Bridge-Oakland,” Pacific Earthquake Engineering Research Center, University of California, Berkeley, CA, PEER Technical Report, 2002.
-
F. Jalayer and C. A. Cornell, “A technical framework for probability-based demand and capacity factor(DCFD)seismic formats,” Stanford University, Stanford, CA, No.RMS-43 RMS Program, 2002.
-
“GB50011-2010, Code for seismic design of buildings,” (in Chinese), China Architecture & Building Press, Beijing, 2016.
-
“SEAOC VISION2000, A Framework for performance-based engineering,” Structural Engineering Association of California, California, 1995.
-
K. G. Smith, “Innovation in earthquake resistant concrete structure design philosophies; a century of progress since Hennebique’s patent,” Engineering Structures, Vol. 23, No. 1, pp. 72–81, Jan. 2001, https://doi.org/10.1016/s0141-0296(00)00023-7
-
“FEMA273, NEHRP Commentary on the guidelines for the rehabilitation of buildings,” Federal Emergency Management Agency, Washington, 1996.
-
A. Ghobarah, N. M. Aly, and M. E. Attar, “Performance level criteria and evaluation,” in Seismic Design Methodologies for the Next Generation of Codes, Routledge, 2019, pp. 207–215, https://doi.org/10.1201/9780203740019-19
-
A. Ghobarah, “Performance-based design in earthquake engineering: state of development,” Engineering Structures, Vol. 23, No. 8, pp. 878–884, 2001.
-
“Performance-based durable earthquake design-present situation and topics,” Kashima Press, Tokyo, 2006.
-
Y. F. Liu and D. G. Lu, “Reliability analysis of two-dimensional series portal-framed bridge system based on mixed copula functions,” Key Engineering Materials, Vol. 574, pp. 95–105, Sep. 2013, https://doi.org/10.4028/www.scientific.net/kem.574.95
-
B. L., Y. Chen, L. Tu, and L. He, “A probabilistic capacity model and seismic vulnerability analysis of wall pier bridges,” Applied Sciences, Vol. 10, No. 3, p. 926, 2020.
-
Y. Sun, W. D. Zhuo, and Z. Z. Fang, “Definition and quantified description of seismic performance levels for regular bridges,” (in Chinese), Journal of Earthquake Engineering and Engineering Vibration, Vol. 31, pp. 104–112, 2011.
-
J. L. Bignell, J. M. Lafave, and N. M. Hawkins, “Seismic vulnerability assessment of wall pier supported highway bridges using nonlinear pushover analyses,” Engineering Structures, Vol. 27, No. 14, pp. 2044–2063, Dec. 2005, https://doi.org/10.1016/j.engstruct.2005.06.015
About this article

This study is supported by the Science and Technology Project of Department of Housing and Urban-Rural Development in Anhui Province (2019YF-007).
The datasets generated during and/or analyzed during the current study are available from the corresponding author on reasonable request.
Wenhua Qiu: conceptualization, methodology, formal analysis, validation, writing-original draft, writing-review and editing. Kehai Wang: project administration, supervision – original draft. Weizuo Guo: investigation, validation, writing-review and editing.
The authors declare that they have no conflict of interest.
