Abstract
Aiming at addressing the issues of structural parameter inversion and dynamic three-dimensional deformation prediction in mining areas, a method of structural parameter inversion in mining areas based on synthetic aperture radar interferometry is designed by optimising parameter settings and simplifying the calculation process. Meanwhile, a method is proposed to transform the 3D deformation prediction of the mining area into line-of-sight direction deformation prediction, based on the constraint relationship between horizontal movement and vertical deformation gradient, and using spatio-temporal Kalman filtering for spatio-temporal data processing. The outcomes showcase that the absolute errors of 3D deformation parameter prediction are within the interval of 0-63.8 m and the absolute errors are within the range of 0-8 %. The structural parameter inversion method for mining airspace zone proposed by the study has high accuracy and precision in both shape and parameter prediction of the airspace zone, and the prediction errors are all less than 10 %. Compared with the Weibull model, the prediction error of the Kalman filter model is reduced by 8 %, which helps to better understand and predict the deformation of the mine openings. The study offers powerful technical support for the prevention and control of ground deformation and mobile geological disasters caused by mining, which is meaningful for the safe production in mining areas.
1. Introduction
As the boost of the national economy, the demand for mineral resources is increasing, and the scale of mine mining is gradually expanding [1]. However, in the process of mining, the formation and expansion of the mining airspace brings great hidden danger to the safe production of mines and seriously threatens the life safety of miners [2]. In order to ensure the safe production of mines and realise the efficient use of mine resources, the structural detection of mining airspace has become a problem that needs solving urgently. The purpose of the structural detection of mining airspace is to understand the spatial distribution of the airspace, morphological characteristics, development trends and other information, to provide a scientific basis for the safe production of mines [3]. At present, the commonly used methods of detecting the hollow area mainly include geological exploration method, seismic exploration method, electromagnetic method, drilling method and so on. Although these methods to a certain extent can obtain the information of the hollow area, but limited by the development level of the detection technology, the existing methods in the detection accuracy, scope and efficiency of the existing methods still have certain problems [4]. Recently, as the boost of computer technology, three-dimensional deformation prediction methods have gradually become a research hotspot in the structural detection of mining airspace [5]. Based on the dynamic three-dimensional deformation prediction of the mining area structure detection method, through real-time monitoring of the surface deformation of the mining area, to predict the formation and development of the mining area, aiming at offering a more accurate and timely decision-making basis for the safe production of the mine. To this end, the study proposes a structural detection method for mining airspace zones based on dynamic three-dimensional deformation prediction. The study consists of four parts, the first part is a summary of related studies, the second part is the design of the method for detecting the structure of mining airspace zones, and the application is carried out in the third part, and the fourth part is a summary of the whole study. This research helps to enrich the theoretical system in the field of structure detection in mining airspace areas and improve the level of safe production in mining areas, and will provide useful reference and learnings for relevant engineers and technicians, and promote the development and application of structure detection technology in mining airspace areas.
2. Related works
Structural detection of mining airspace is a method to detect the spatial distribution and structural characteristics within the mining airspace by using geological exploration technology. Cao et al. detected the complex airspace of open pit mines by three-dimensional seismic exploration method, and surveyed the elevation of the anomalous area by combining the transient electromagnetic method. The results show that the joint use of the detection methods can achieve the visual display of the mining voids [6]. Zhang's team accurately determined the location of the abandoned mining voids and the morphology of the overburden layer through step-by-step detection, traditional detection and the combination of methods, providing accurate data for the evaluation of highway stability, and effectively solving the problem of the threat of the abandoned mining voids to the stability of the surface buildings [7]. Wang’s team aimed at coal mine Wang’s team proposed a new passive electromagnetic method and audio geomagnetic method for the detection of coal mining airspace. The outcomes showcase that these two methods could markedly identify the fault structure, judge the location of the collapse of the air-mining zone, as well as describe the potential distribution of fissure water infiltration [8]. Wen et al. explored the structure of the overburden and the stress distribution characteristics of the isolation workings for the Xinglongzhuang coal mine. The results showed that the fracture motion of the lower key layer had a dominant influence on microseismic activity and mining stress, as well as the microseismic energy caused by roof rupture accounted for 43.34 % of the total energy [9]. Zhang's research group combined shallow 3D seismic and transient electromagnetic methods in order to detect the distribution range of the voided area and water accumulation. The outcomes showcased that the data interpretation method enhances the prediction of the voided areas and waterlogging conditions [10].
Dynamic 3D prediction method is a technique for prediction in time series data, which mainly predicts future values by analysing the time evolution characteristics of the data. Dong et al. proposed a real-time wireless monitoring system and introduced a probabilistic prediction model based on time series and probabilistic prediction for slope displacement prediction. The results showed that the monitoring system and the prediction model possessed good safety control during construction, and the prediction accuracy could reach 90 % during operation [11]. Yakar’s group used UAV and remote sensing to model the rockfall site in three dimensions, and obtained information about the discontinuities of the rock slopes by analysing the three-dimensional point cloud data. The results show that point cloud analysis is useful for high-resolution terrain modelling and information acquisition in inaccessible areas [12]. Chen and his team members combined SAR pixel offset tracking and single-pair SAR imagery to monitor three-dimensional large surface displacements caused by underground coal mining. The outcomes showcase that the results of this method are in good agreement with GPS measurements [13]. Cai's research team proposed two types of fault resurrection and its mechanism of inducing coal explosions, including mining-induced quasi-static stress-dominated and seismic-induced dynamic stress-dominated, through the superposition of static and dynamic stresses. The outcomes showcased that fault-induced coal explosions are caused by the superposition of high static stresses within the fault column and dynamic stresses induced by fault resurrection [14]. Chang et al. analysed the dispersion and concentration distribution characteristics of diesel particulate matter in underground mining workings by using computational fluid dynamics techniques. The results showed that the zone of high concentration of diesel particulate matter in the return mining face could be identified by these simulations [15].
The probability prediction model based on time series research is a statistical method that uses historical time series data to predict the probability of future events. It mainly analyzes and models time series data to identify potential trends, cycles, seasonality, and other information, in order to predict the probability of future events. Tang et al. proposed a wind speed interval construction model based on error prediction, which utilizes variational mode decomposition for wind speed prediction. The weight of the prediction error is determined through particle swarm optimization algorithm to obtain the width of the prediction interval. The experimental results show that the model has high accuracy in constructing wind speed prediction intervals [16]. Pärssinen et al. used the probability programming tool CoronaMaster to predict pandemic cases, hospital capacity, and mortality rates. This tool is based on Bayesian inference and is suitable for time series prediction and uncertainty challenges with small sample sizes. By sampling the parameter space through training period data, CoronaMaster can provide model parameters and their confidence intervals for the shape function selected by the user [17]. Na et al. proposed an improved optimized echo state network system based on biogeography for multivariate time series prediction. The system can simultaneously select the optimal feature subset and optimize model parameters, and utilizes an S-type population mobility model, covariance matrix migration strategy, and Lévy distribution mutation strategy to enhance rotation invariance and exploration ability. The experimental results show that the system has high accuracy in predicting multivariate time series and is superior to other traditional machine learning models [18].
In summary, many researchers have done different studies and designs for the structural detection and 3D prediction models of mining areas. However, some of the research methods are complicated in operation and require high technical equipment and environment, which may not be suitable for all mining actualities. The structural detection and prediction methods for goaf in mining areas mentioned in the above studies mainly focus on static three-dimensional detection, passive electromagnetic methods, and audio geomagnetic methods. The research methods based on dynamic three-dimensional deformation prediction are relatively lacking. Therefore, the study proposes a structural detection method for goaf in mining areas based on dynamic three-dimensional deformation prediction. By combining geological exploration technology and three-dimensional seismic exploration methods, the spatial distribution and structural characteristics of goaf in mining areas can be more accurately detected, providing important data support for mine stability assessment and risk prevention and control.
3. Construction of structural detection method for mining airspace based on dynamic three-dimensional deformation prediction
A structural parameter inversion and dynamic three-dimensional deformation prediction problem for mining airspace is developed, and a structural parameter inversion method for mining airspace is designed, which uses synthetic aperture radar (SAR) interferometry to detect and monitor ground deformation, and improves the inversion accuracy and efficiency by optimising parameter settings and simplifying the calculation process. Secondly, a method is proposed to transform the 3D deformation prediction of the mining area into line-of-sight deformation prediction, which is based on the constraint relationship between horizontal movement and vertical deformation gradient, and utilises spatio-temporal Kalman filtering for spatio-temporal data processing.
3.1. Design of inversion method for structural parameters of mining airspace area
The inversion method of structural parameters of mining airspace is a method to infer the structural parameters of the underground mining airspace in the mining area through the observed phenomena such as surface settlement and changes in the water table in the mining area. Interferometric synthetic aperture radar (InSAR) technique is a method that uses SAR interferometry to detect and monitor ground deformation. The Post-Inversion Method (PIM) model is a commonly used method for processing InSAR data in the inversion of geometric parameters (GP) of the subsurface voided area.The PIM model obtains the GPs of the subsurface voided area, such as the size, shape, and location of the voided area, by inverting the InSAR data. However, the PIM model also has some disadvantages. For example, PIM models need to pre-set some parameters, such as the smoothness, coherence and noise level of the surface and subsurface media, etc. In addition to the key voiding zone GPs, PIM also requires a set of modelling parameters. These model parameters usually need to be determined from actual measurements and will vary with the mining geological conditions. In the PIM model, the angle of the main influence angle tangent (IAT) depends on the dominant nature of the overlying rock formation, which makes the difference between the main IAT in the strike and tendency downhill and uphill directions smaller, and it can be approximated by assuming that the main IAT is equal in all three directions [19]. In addition, the inflection deviation in the model is only used to calculate the calculated boundary lengths of strike and tendency, which are positively correlated with the strike boundary length and tendency boundary length. In the PIM model, the tangent of the main influencing angles of strike and dip can be approximately assumed to be equal, while the inflection point offset is only used to calculate the boundary length of strike and dip, which is positively correlated with the length of strike and dip boundaries. To simplify the calculation, it can be assumed that these parameters are equal. In the process of acquiring the surface deformation field by InSAR technology, the geometric 3D projection relationship of image imaging is shown in Fig. 1.
Fig. 1Image imaging geometry 3D projection relationship
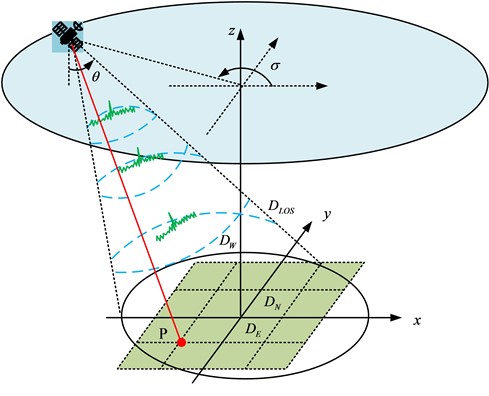
In three-dimensional projection, the vector projection sum in the direction of oblique moment is the line-of-sight direction deformation. Based on the three-dimensional geometric relationship, a linear equation is established as shown in Eq. (1) [20]:
where, the line-of-sight deformation serves as DLOS and the surface deformation components in the north-south, east-west and vertical directions are DN, DE and DW, respectively. The radar incidence angle serves as θ and the satellite heading azimuth is σ. The relationship between line-of-sight deformation and the GPs of the mine site is shown in Eq. (2) [21]:
where, the horizontal deformations of any point on the surface of the mining area from north to south and from east to west are U(x,y,φN,GP,MP) and U(x,y,φE,GP,MP), and the vertical deformation is W(x,y,GP,MP), respectively. However, InSAR data are usually high-resolution and high-noise, so they need to be downsampled to improve the computational efficiency and reduce the noise effect. Therefore, the study chooses the adaptive quadtree downsampling method to process the InSAR results, which can obtain the surface deformation information more efficiently and provide more accurate data support for the construction of the inverse model of the GPs of the mining area. Quadtree is a data structure that can dynamically adjust its structure according to changes in data to achieve optimal storage and query performance. The quadtree downsampling algorithm is an image sampling method based on the quadtree data structure. Firstly, divide the original image into equally sized quadtree structures, and then sample the nodes in the quadtree according to the set sampling strategy. During the sampling process, different sampling methods can be used, including random sampling, minimum coding sampling, clustering sampling, etc. In the quadtree downsampling algorithm, the selection of sampling strategy has a significant impact on the sampling results, and needs to be selected according to specific application scenarios and requirements. In InSAR processing, the adaptive quadtree downsampling method can effectively reduce data volume, improve data processing efficiency, and ensure data accuracy and integrity. Considering the coupling characteristics between the parameters, the study will improve the GP inversion method of mining airspace area by cross iteration, and reduce the dependence of model parameters by dividing the parameters. The crossover genetic fitness function is shown in Eq. (3):
where, the genetic fitness function is f, and the line-of-sight direction deformation of the predicted point is D'LOS(x,y). The parameters to be solved by the genetic algorithm are shown in Eq. (4):
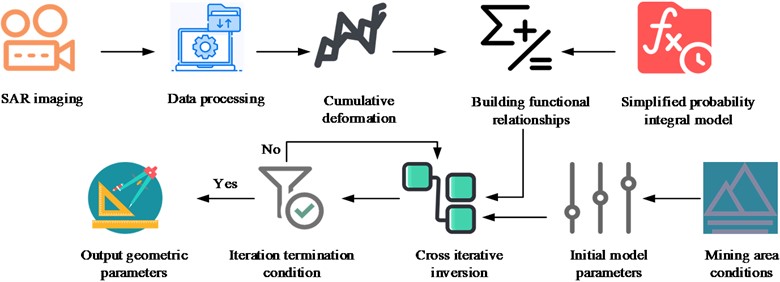
where, the solution of the parameter to be solved is Preq, the estimated value of the parameter to be solved is P1i, and the number of parameter valuation groups is k. The specific cross iteration is as follows: firstly, the first iteration is carried out, assuming that the initial PIM model parameters are known and their empirical values are determined, and then the genetic algorithm is used to invert another set of parameters. Then the second iteration is carried out, the parameters obtained from the inversion are regarded as known, and the remaining parameters are inverted. In the iteration process, iteration termination judgement is required, and the iteration is judged to be terminated when the set threshold is met, at which time the GPs of the extraction zone are known. If it does not meet the judgement conditions, the initial PIM model parameters obtained are used to repeat the iterative update until the threshold conditions are met. The whole process of updating parameters through continuous iteration, and finally get the GPs of the mining zone that meet the set threshold. The overall flow of the structural parameter inversion method for the mining air-mining zone is shown in Fig. 2.
Fig. 2Overall flow of the inversion method for structural parameters of the mining area's air-mining zone
3.2. Design of dynamic three-dimensional deformation prediction method for mining airspace area
In recent years, ground deformation and movement caused by mining has become a serious geological disaster. In order to prevent and control this disaster, the study proposes a method to transform the three-dimensional deformation prediction of the mining area into a one-dimensional line-of-sight orientated deformation prediction, which is based on the constraint relationship between horizontal movement and vertical deformation gradient, and uses spatio-temporal Kalman filtering for spatio-temporal data processing. At the same time, the adoption will also use the structural parameter inversion method for the mine's air-mining area to obtain a priori constraint parameters and solve the dynamic 3D deformation of the mine based on the predicted dynamic line-of-sight deformation. The time-varying linear combination of spatial field and temporal components in the dynamic 3D model Lt is shown in Eq. (5) [22]:
where, the spatial field H=[h1,h2,⋯,hp] dimension of the observation data is n×p; the dimension of the dynamic time component X(t)=[x1(t),x2(t),⋯,xp(t)] is p×1, and the system state of the mean component of the observation data serves as X(t). The representation of the observational data is showcased in Eq. (6) [23]:
where, the observation data is Yt and the observation error component is ωt. After Kalman filter modelling, the state equation is calculated as showcased in Eq. (7):
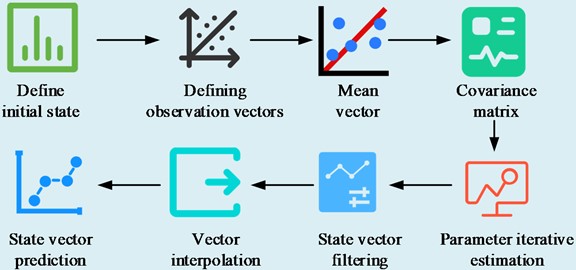
where, the system state vector (SV) is X'(t); the state transfer matrix is K, and the state update at the time of t is ε(t). The initial parameter estimation flow is shown in Fig. 3.
Firstly, the initial SV and state transfer matrix are set to meet the requirements of the spatio-temporal Kalman filtering model. Define the observation vector and establish the relationship with the SV. According to the nature of multivariate Gaussian distribution, set the mean vector and covariance matrix of the SV and observation vector. Use the maximum expectation algorithm for iterative parameter estimation to obtain the estimated value and covariance matrix of the SV. In this process, first initialize the SV, initialize the observation sequence, and initialize the model parameters, and then perform multiple iterations. In each iteration process, the probability of the state sequence is calculated based on the observation sequence and model parameters, and then the SV and covariance matrix are updated using the maximum expectation principle. This process will continue until convergence occurs. Finally, the estimated SV values and covariance matrix are obtained. The SV is filtered using the Kalman filter formula and the observation vector, and the filtered SV is interpolated to obtain the estimates of the missing data. Finally, the interpolated SVs and the state transfer matrix are used to predict the future SVs [24]. The kriging prediction for a point in the spatio-temporal field construction ˆLt(s) is shown in Eq. (8):
where, given the spatial trend as f(s) and the row vector of the spatial trend F as σξ(s), the trend matrix A and the bending energy matrix B are calculated as shown in Eq. (9):
Fig. 3Initial parameter estimation flow
In Eq. (9), the spatial covariance matrix constructed by σξ is ∑ξ. The spatial trend component is removed by least squares as shown in Eq. (10):
where, the spatial trend component is Yd(t), and the experimental semi-variance is calculated as shown in Eq. (11):
where, the experimental semivariance fitting function is ˆγd, which is usually chosen to be expressed in the form of an exponential or spherical semivariance function. The spatial covariance is calculated as shown in Eq. (12):
where, the abutment value is C and the distance operator is ‖⋅‖. The spectral decomposition of the bending energy matrix B is calculated as shown in Eq. (13):
where, the eigenvectors of the matrix B are the column vectors ui of U, and its eigenvalues are the diagonal elements λi of the diagonal matrix Λ. After the time-varying linear combination of the spatial field and the time component is represented by the linear combination of the eigenvectors, the spatial field can be shown in Eq. (14):
where, the spatial trend F=[fT(s1),fT(s2),⋯,fT(sn)]. In order to solve for the observation valuation, it is first necessary to compute an estimate of the SV based on the known observations and the SV prediction. Then, based on the estimated value of the SV and the corresponding gain, the predicted value of the state covariance is calculated. Next, for the missing observations, the filtering results of the observations at moment t can be derived by setting the corresponding matrix value to 0 and then based on the SV estimate. Finally, if it is necessary to predict the observation value at a certain moment, the state prediction at that moment is calculated, and then the prediction of the observation value is calculated using the state prediction and the corresponding gain. When the basic model is constructed, the cumulative line-of-sight to deformation sequence is shown in Eq. (15):
where, the cumulative line-of-sight deformation sequence with respect to the t1 time is dlos, and the cumulative line-of-sight deformation sequence after spatio-temporal interpolation filtering is shown in Eq. (16):
where, the cumulative line-of-sight deformation sequence after spatio-temporal filtering difference is d1los. After spatio-temporal interpolation filtering, as well as state transfer matrix and spatial field processing, the dynamic prediction of the cumulative line-of-sight deformation of the mine surface is shown in Eq. (17):
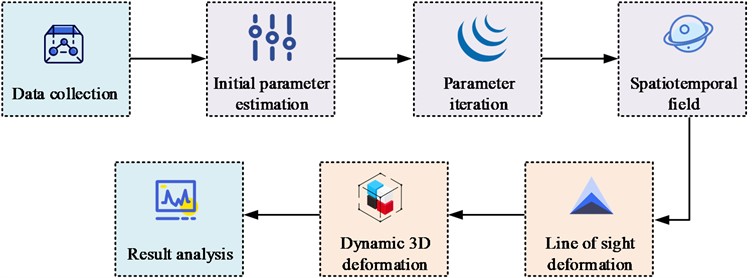
The cumulative line-of-sight to deformation dynamics in Eq. (17) is predicted as dpredictlos. Conventional methods require InSAR monitoring data from at least three tracks, this study performs dynamic 3D deformation prediction of the mine site by basing on single-track InSAR monitoring data. The method reduces the number of unknowns to m by constructing the constraint relationship between horizontal deformation and vertical deformation, which enables the decomposition of 3D deformation. The study establishes a basic model from InSAR time series processing to dynamic 3D deformation prediction through the functional relationship between horizontal deformation and vertical deformation gradient. In summary, the dynamic three-dimensional deformation prediction method for mining airspace is shown in Fig. 4.
4. Analysis of the application of the method of detecting the structure of the mining hollow area
The study takes the San Yuan coal mine as the research object, applies the proposed inversion method of the structural parameters of the mining area, and constructs a three-dimensional geological model through the geophysical exploration software GeoStudio, and predicts and analyses the structural parameters of the mining area.
Fig. 4Dynamic 3D deformation prediction method for mining airspace area
4.1. Analysis of the application of structural parameter inversion methods for mining airspace areas
Aiming at studying the influence of the proposed method of inversion of structural parameters in the mining area, the experiment takes the San Yuan coal mine as the research object and analyses the structural parameters of the empty mining area. In GeoStudio, a geophysical exploration software, a three-dimensional geological model is constructed according to the actual mining area, reflecting the geological structure and lithological distribution of the mining area. The structural parameters of the goaf in the mining area were experimentally analyzed, and the accuracy of cross iterative estimation and non iterative estimation was compared. At the same time, the Kalman filtering model was used to predict the dynamic three-dimensional deformation of the goaf in the mining area, and compared with the Weibull model. The experimental factors mainly include the specific geological conditions of the mining area, the accuracy and performance of geophysical exploration equipment, etc. During the experiment, the measurement equipment mainly includes geophysical exploration equipment, including GeoStudio software, Global Positioning System (GPS), etc. The seismic instrument model is Trimble T8, the electromagnetic instrument model is GEM Systems GSM-19T, and the magnetic instrument model is Bruker GSM-29, The GPS receiver model is Trimble R10. GeoStudio software version is 2021.1, including Seismic Electrical, Magnetic, and GPS modules. The accuracy and reliability of GeoStudio software are directly related to the construction of geological models, while the accuracy and performance of GPS directly affect the accuracy of deformation prediction. The statistical analysis of measurement data is shown in Table 1.
Table 1Statistical analysis of the measured data
Data name | Error | Sensitivity | Confidence interval |
Length | ±0.01 m | 83 % | 95 % |
Width | ±0.01 m | 92 % | 95 % |
Thickness | ±0.07 m | 91 % | 95 % |
In Table 1, the statistical analysis results of the measurement data indicate that the errors in length, width, and thickness are ±0.01 m, ±0.01 m, and ±0.07 m, respectively, with corresponding sensitivities of 83 %, 92 %, and 91 %, and confidence intervals of 95 %. Measurement data has high accuracy and reliability, and can be used as a basis for practical applications. The experiment evaluates the accuracy and precision of the inversion method for structural parameters of goaf in mining areas by comparing the three-dimensional surface maps of simulated goaf and actual estimated goaf, as well as parameter prediction results. Then, cross iterative estimation and non-iterative estimation methods were used to predict geometric parameters, and their accuracy was compared. The three-dimensional surface map and parameter prediction of the mine's empty mining area are shown in Fig. 5.
Fig. 53D surface map and parameter prediction of the mine's air extraction zone
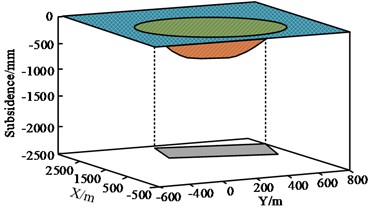
a) 3D surface diagram
b) Parameter prediction
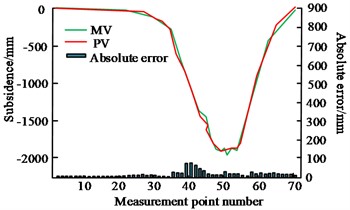
Fig. 5(a) shows the 3D surface map of the mining airspace area, and the aggregate shapes of the simulated airspace area and the actual estimated airspace area are similar, and the vertical projections basically coincide with each other. Fig. 5(b) shows the combined parameter prediction results of the mining airspace area, with MV denoting the measured data and PV denoting the predicted data. The absolute error of parameter prediction is in the interval of 0-63.8 m, and the absolute error is in the range of 0-8 %. The results show that the structural parameter inversion method for mining airspace zones proposed by the study has high accuracy and precision in both the shape of the airspace zones and parameter prediction. For verifying the reliability of the inversion of the GPs of the mining airspace. The study analyses the accuracy of cross iterative inversion based on the predicted and measured values of GPs. The comparison of predicted and measured values of GPs is shown in Fig. 6.
Fig. 6Comparison of predicted and measured values of geometrical parameters
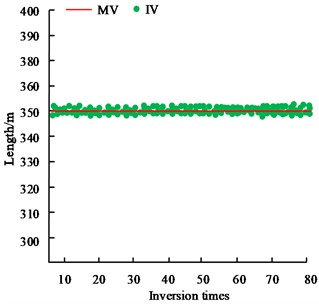
a) Length
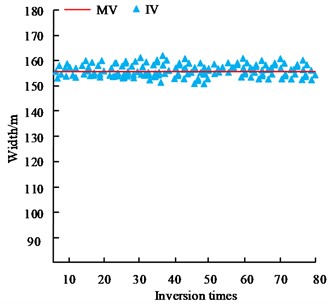
b) Width
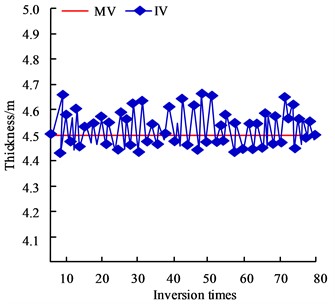
c) Thickness
In Fig. 6, MV represents the measured value and IV represents the inversion value. The absolute error is the difference between the measured value and the true value, and the relative error is the ratio of the absolute error to the true value. Fig. 6(a) showcases the comparison results of the length estimation and inversion value of the open area, which shows that the absolute error of the length inversion value is less than 0.2 m, and the relative error is less than 1 %. Fig. 6(b) showcases the comparison results of the estimated width of the open area and the inversion value, the absolute error of the inversion value of the visible width is less than 6m, and the relative error is less than 5 %. Fig. 6(c) showcases the comparison results of the estimated thickness of the hollow zone and the inversion value, which shows that the absolute error of the thickness inversion value is less than 0.3 m, and the relative error is less than 8 %. The results show that the estimates of the goaf geometric parameters (length, width and thickness) obtained by the inversion method have high accuracy and reliability compared with the estimated value. The comparison of the accuracy of cross iterative estimation and non-iterative estimation is shown in Fig. 7.
Fig. 7Comparison of accuracy of cross iterative estimation and non-iterative estimation
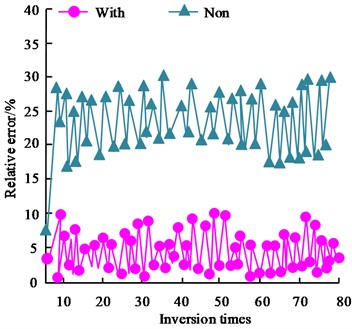
a) Length indicators
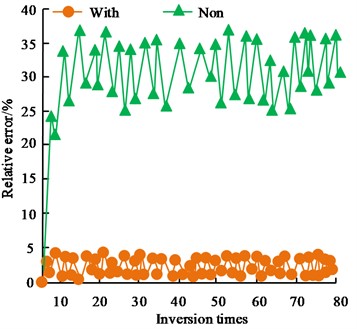
b) Angle indicators
In Fig. 7, With denotes cross iterative estimation and Non denotes non-cross iterative estimation. Fig. 7(a) showcases the comparison of the inversion errors for the length class parameters, and the non-crossed iterative estimation increases the relative error of the length class parameter estimation by about 18 %. Fig. 7(b) showcases the comparison of the inversion errors of the angle class parameters, and the non-cross iteration estimation increases the relative error of the angle class parameter estimation by about 24 %. Comprehensively, it showcases that the cross iteration estimation has a better effect compared with the non-cross iteration estimation. The effect of the PIM initial model error on the inversion results of the air-sea zone is shown in Fig. 8.
In Fig. 8, S, T and O denote the subsidence coefficient, tangent angle and offset in the initial parameters of the PIM model, respectively. Fig. 8(a) showcases the results of the effect of the error content of the initial parameters of the PIM model on the inversion of coal seam thickness. Fig. 8(b) showcases the results of the influence of the error content of the initial parameters of the PIM model on the inversion of the length of the mining zone. Fig. 8(c) showcases the results of the influence of the error content of the initial parameters of the PIM model on the inversion of the dip angle of the air-mined zone. When the error between the sinking coefficient and the tangent of the main influencing angle increases, the differences between the boundary length, boundary width, mining direction azimuth and the true value can be basically ignored. When the initial model parameter error of any PIM increases, there is no significant change in the accuracy of coal seam thickness and average mining depth. It demonstrates that the error content of the initial parameters of the PIM model has no obvious influence on the inversion accuracy of the geometrical parameters of the extraction zone.
Fig. 8Effect of PIM initial model error on the inversion results of the extraction zone
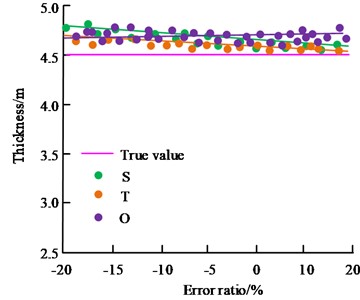
a) Thickness
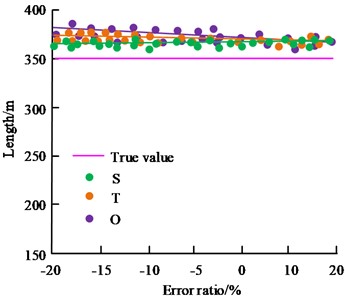
b) Length
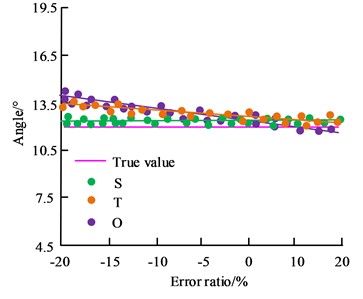
c) Angle
4.2. Analysis of the application of dynamic 3D deformation prediction methods for mining airspace areas
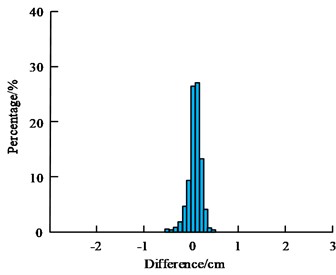
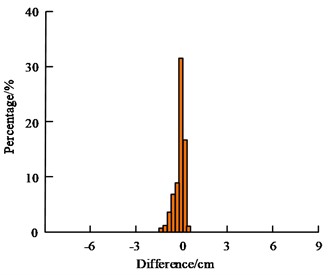
Aiming at verifying the prediction effect of the Kalman filter model (KFM) in the dynamic three-dimensional deformation prediction method of the mining area, the KFM was utilized for forecasting the line-of-sight direction deformation after the spatio-temporal field matrix and the unknown parameters were established. The difference-like results predicted by the KFM are shown in Fig. 9.
Fig. 9(a) showcases the prediction effect of the KFM for date 1, with a peak prediction difference of less than 40 percent and an average prediction error of less than 7 per cent. Fig. 9(b) shows the prediction effect of the KFM for date 2, with a peak prediction difference of less than 40 % and an average prediction error of less than 8 %. Fig. 9(c) shows the prediction effect of the KFM for date 3, with the peak prediction difference less than 40 % and the average prediction error less than 10 %. In summary, it can be seen that the KFM prediction error will gradually increase with the increase between, which is a common problem of model prediction, but the overall error is less than 10 %. Overall, the KFM shows a strong prediction ability. The results of the deformation prediction of the Global Positioning System (GPS) position in different directions are shown in Fig. 10.
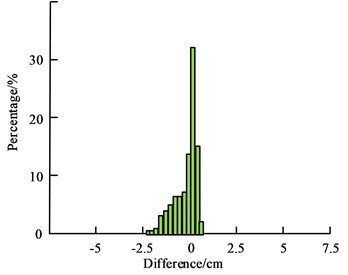
Fig. 10(a) shows the deformation prediction of the GIS location in vertical direction with the root mean square error of 1.5 cm, Fig. 10(b) shows the deformation prediction of the GIS location in east-west direction with the root mean square error of 1.7 cm, and Fig. 10(c) shows the deformation prediction of the GIS location in north-south direction with the root mean square error of 0.8 cm.
Fig. 9Disparity-like results predicted by the KFM
a) Data 1
b) Data 2
c) Data 3
Fig. 10Deformation prediction results for different orientations of GPS positions
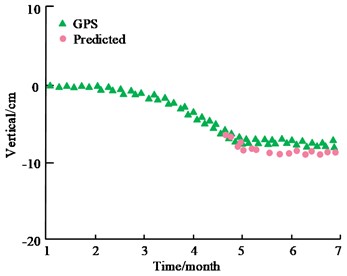
a) Vertical direction
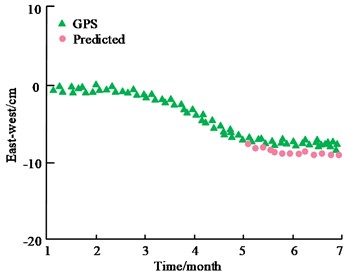
b) East-west direction
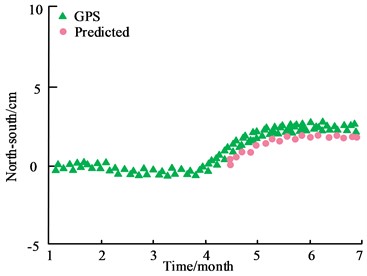
c) North-south direction
The results show that the proposed dynamic 3D deformation prediction method for mining airspace area shows high accuracy in predicting the deformation of mining area. deformation prediction method shows high accuracy in predicting the deformation of the mining area, which helps to better understand and predict the deformation of the mining airspace. In order to verify the application of the proposed dynamic 3D deformation prediction method based on the KFM, the Weibull model is used as a comparison in the experiment, and the fitting of the Weibull model is shown in Fig. 11. The Weibull model is a continuous probability distribution model used to describe the probability of a random variable reaching or exceeding a certain value at a certain moment. This model is based on a Weibull function, which is a combination of a power function and a logarithmic function.
Fig. 11The fit of the Weibull model
a) Point 1
b) Point 2
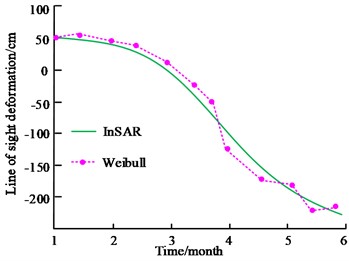
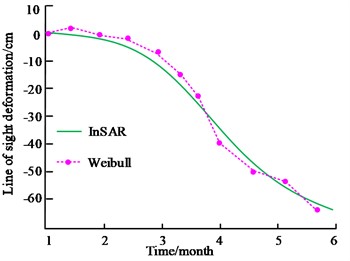
Fig. 11 showcases the fit of the Weibull model before the time-zero correction. Fig. 11(a) shows the fit of the Weibull model to measurement point 1. Fig. 11(b) showcases the fit of the Weibull model to measurement point 2. It demonstrates that the fitting accuracy of the Weibull model is poor and easily limited by the time zeros. Although the Weibull model can characterise the distribution of random variables, it may not be able to adequately capture the dynamics of the data when dealing with time series data. A comparison of the model's line-of-sight deformation prediction results is shown in Fig. 12.
Fig. 12Comparison of line-of-sight deformation prediction results of models
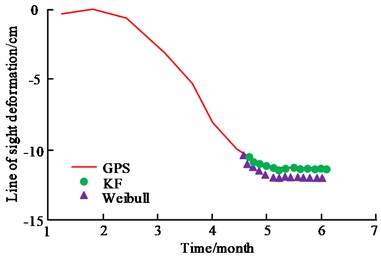
a) GPS
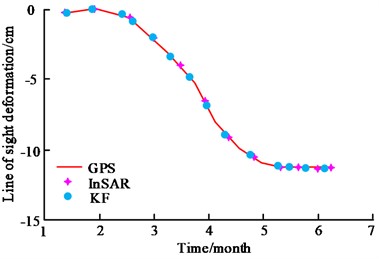
b) InSAR
In Fig. 12, KF denotes the KFM. Fig. 12(a) shows the fitting of GPS data for the KFM and the Weibull model, and the KFM has a better fit. Compared to the Weibull model, the prediction error of the KFM is reduced by 8 %. Fig. 12(b) shows the comparison between the fitting of the KFM and the InSAR measurement data, which shows that both of them have the same trend and the spatial characterisation is basically the same. It can be seen that the dynamic 3D deformation prediction method based on the KFM has better application and practicability when dealing with problems such as dynamic 3D deformation prediction in mining areas. During the period of 20210915, the deformation prediction comparison of the goaf in the mining area is shown in Fig. 13.
Fig. 13Prediction and comparison of goaf deformation in mining area
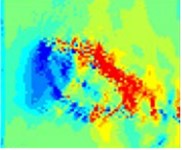
a) InSAR-horizontal
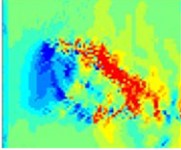
b) KFM-horizontal
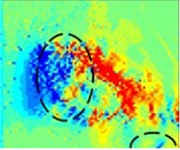
c) Weibull-horizontal
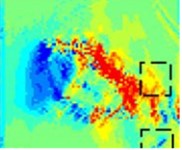
d) Logisitc-horizontal
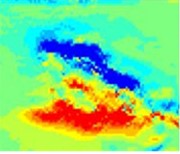
e) InSAR-vertical
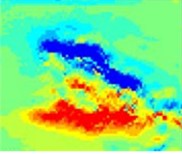
f) KFM-vertical
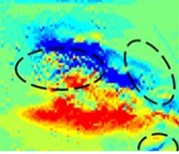
g) Weibull-vertical
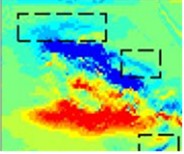
h) Logisitc-vertical
Fig. 13(a-d) represent the horizontal gradients predicted by each model, while Fig. 13(e-h) represent the vertical gradients predicted by each model. The black dashed line surrounding the area indicates a difference between the predicted value and the actual value. It can be seen that there is no significant difference between the predicted deformation of the KFM proposed in the study and the InSAR measurement data, indicating that the spatial continuity between the two is basically the same. However, there is a difference between the predicted deformation of Weilbull and Logisitc models and the InSAR measurement data. The results indicate that the proposed KFM has the highest prediction accuracy and can accurately predict the dynamic three-dimensional deformation of mining areas. In order to verify the effectiveness of the dynamic 3D deformation prediction method based on the KFM proposed in the study, the experiment will compare the mine subsidence prediction method based on InSAR technology and LSTM algorithm proposed in 2023 [25]. The experiment will use maximum absolute error (MAE), maximum relative error (MRE), mean absolute deviation (MAD), and Wilmot consistency index as evaluation indicators. The comparison results of the two methods are shown in Table 2.
Table 2Comparative results of the two methods
Method | MAE | MRE | MAD | Wilmot |
Presented in 2023 | 2 cm | 6 % | 1.1 % | 0.999 |
Research proposal | 1.8 cm | 5 % | 1.0 % | 0.999 |
From Table 2, it can be seen that the two methods have similar performance in prediction accuracy and both have high prediction accuracy. The methods proposed in the study on MAE, MRE, and MAD are slightly lower than those proposed in 2023. The Wilmot consistency index of the two methods is equal. The results indicate that the proposed method performs slightly better in prediction and evaluation than the method proposed in 2023, but the two methods are comparable in reliability.
5. Conclusions
Aiming at the inversion of structural parameters of mining areas and the prediction of dynamic 3D deformation, the study designed a method for the inversion of structural parameters of mining areas based on SAR interferometry, which optimises the parameter setting and simplifies the calculation process. Meanwhile, a method is proposed to transform the 3D deformation prediction of the mining area into line-of-sight deformation prediction, which is based on the constraint relationship between horizontal movement and vertical deformation gradient, and utilises spatio-temporal Kalman filtering for spatio-temporal data processing. The experiment showcases that the absolute error of the length inversion value is below 0.2 m, and the relative error is below 1 % when comparing the length prediction and inversion value of the hollow zone. Comparison of the estimated value of the width of the mining area and the inverse value shows that the absolute error of the inverse value of the width is less than 6 m, and the relative error is less than 5 %. The absolute error of the parameter prediction of the inversion method of the structural parameters of the mining area proposed by the study is within the range of 0-8 %. The overall error of the KFM is less than 10 %, which reduces the prediction error by 8 % compared to the Weibull model. This study offers strong technical support for the prevention and control of ground deformation and mobile geological hazards caused by mining. However, there are still some limitations in the study, such as further optimisation in model parameter setting and data processing. Future research will continue to explore and improve the structural parameter inversion and dynamic 3D deformation prediction methods of mining airspace in order to improve the prediction accuracy and practicality.
References
-
K. Fan, Q. Wang, W. Li, and Y. Chen, “Development process and height of the mining-induced water fractured zone over the longwall goaf,” Water Supply, Vol. 23, No. 2, pp. 779–795, Feb. 2023, https://doi.org/10.2166/ws.2023.010
-
J. Chang, B. Su, R. Malekian, and X. Xing, “Detection of water-filled mining goaf using mining transient electromagnetic method,” IEEE Transactions on Industrial Informatics, Vol. 16, No. 5, pp. 2977–2984, May 2020, https://doi.org/10.1109/tii.2019.2901856
-
P. Zhu, Q. Li, X. Li, G. Zhang, Y. Zhang, and Y. Zheng, “Investigation on the potential hazard zone of gas explosion in the goaf under longwall top caving coal mining condition,” Combustion Science and Technology, Vol. 195, No. 11, pp. 2570–2589, Aug. 2023, https://doi.org/10.1080/00102202.2022.2027393
-
B. Yan, H. Jia, Z. Yang, E. Yilmaz, and H. Liu, “Goaf instability in an open pit iron mine triggered by dynamics disturbance: a large-scale similar simulation,” International Journal of Mining, Reclamation and Environment, Vol. 37, No. 8, pp. 606–629, Sep. 2023, https://doi.org/10.1080/17480930.2023.2233866
-
D. Zhu, X. Song, H. Li, Z. Liu, C. Wang, and Y. Huo, “Cooperative load‐bearing characteristics of a pillar group and a gob pile in partially caved areas at shallow depth,” Energy Science and Engineering, Vol. 8, No. 1, pp. 89–103, Nov. 2019, https://doi.org/10.1002/ese3.511
-
B. Cao, J. Wang, H. Du, Y. Tao, and G. Liu, “Research on comprehensive detection and visualize of hidden cavity goaf,” Springer Science and Business Media LLC, Scientific Reports, Dec. 2022.
-
S. Zhang, P. Jiang, L. Lu, S. Wang, and H. Wang, “Evaluation of compressive geophysical prospecting method for the identification of the abandoned goaf at the Tengzhou Section of China’s Mu Shi expressway,” Sustainability, Vol. 14, No. 21, p. 13785, Oct. 2022, https://doi.org/10.3390/su142113785
-
N. Wang, Z. Wang, Q. Sun, and J. Hui, “Coal mine goaf interpretation: survey, passive electromagnetic methods and case study,” Minerals, Vol. 13, No. 3, p. 422, Mar. 2023, https://doi.org/10.3390/min13030422
-
Y. Wen, A. Cao, W. Guo, C. Xue, G. Lv, and X. Yan, “Strata movement and mining-induced stress identification for an isolated working face surrounded by two goafs,” Energies, Vol. 16, No. 6, p. 2839, Mar. 2023, https://doi.org/10.3390/en16062839
-
S. Zhang, W. Guan, S. Chang, Q. Meng, Y. Dong, and Q. Chen, “Integrated geophysical prediction of goaf and water accumulation in Pingshuo Dong Open-Cut Mine with ultrashallow and high drops,” Processes, Vol. 11, No. 6, p. 1653, May 2023, https://doi.org/10.3390/pr11061653
-
M. Dong et al., “Deformation prediction of unstable slopes based on real-time monitoring and deep AR model,” Sensors, Vol. 21, No. 1, p. 14, Dec. 2020, https://doi.org/10.3390/s21010014
-
M. Yakar, A. Ulvi, A. Y. Yiğit, and A. Alptekin, “Discontinuity set extraction from 3D point clouds obtained by UAV Photogrammetry in a rockfall site,” Survey Review, Vol. 55, No. 392, pp. 416–428, Sep. 2023, https://doi.org/10.1080/00396265.2022.2119747
-
B. Chen et al., “Three-dimensional time-varying large surface displacements in coal exploiting areas revealed through integration of SAR pixel offset measurements and mining subsidence model,” Remote Sensing of Environment, Vol. 240, No. 1, p. 111663, Apr. 2020, https://doi.org/10.1016/j.rse.2020.111663
-
W. Cai, L. Dou, G. Si, and Y. Hu, “Fault-induced coal burst mechanism under mining-induced static and dynamic stresses,” Engineering, Vol. 7, No. 5, pp. 687–700, May 2021, https://doi.org/10.1016/j.eng.2020.03.017
-
P. Chang, G. Xu, and J. Huang, “Numerical study on DPM dispersion and distribution in an underground development face based on dynamic mesh,” International Journal of Mining Science and Technology, Vol. 30, No. 4, pp. 471–475, Jul. 2020, https://doi.org/10.1016/j.ijmst.2020.05.005
-
G. Tang, Y. Wu, C. Li, P. K. Wong, Z. Xiao, and X. An, “A novel wind speed interval prediction based on error prediction method,” IEEE Transactions on Industrial Informatics, Vol. 16, No. 11, pp. 6806–6815, Nov. 2020, https://doi.org/10.1109/tii.2020.2973413
-
M. Pärssinen, I. Sillanpää, and M. Kotila, “Probabilistic programming method for time-series forecasting of COVID-19 cases based on empirical data,” American Journal of Epidemiology and Infectious Disease, Vol. 9, No. 1, pp. 18–23, Aug. 2021, https://doi.org/10.12691/ajeid-9-1-4
-
X. Na, M. Han, W. Ren, and K. Zhong, “Modified BBO-based multivariate time-series prediction system with feature subset selection and model parameter optimization,” IEEE Transactions on Cybernetics, Vol. 52, No. 4, pp. 2163–2173, Apr. 2022, https://doi.org/10.1109/tcyb.2020.2977375
-
P. Małkowski and Z. Niedbalski, “A comprehensive geomechanical method for the assessment of rockburst hazards in underground mining,” International Journal of Mining Science and Technology, Vol. 30, No. 3, pp. 345–355, May 2020, https://doi.org/10.1016/j.ijmst.2020.04.009
-
B. P. Simser, “Rockburst management in Canadian hard rock mines,” Journal of Rock Mechanics and Geotechnical Engineering, Vol. 11, No. 5, pp. 1036–1043, Oct. 2019, https://doi.org/10.1016/j.jrmge.2019.07.005
-
W. Yao, G. Liu, J. Pang, and X. Huang, “Instability mechanism and surrounding rock control technology of roadway subjected to mining dynamic loading with short distance: a case study of the Gubei Coal Mine in China,” Geotechnical and Geological Engineering, Vol. 41, No. 2, pp. 1407–1427, Nov. 2022, https://doi.org/10.1007/s10706-022-02343-y
-
C. Wang, A. Cao, C. Zhang, and I. Canbulat, “A new method to assess coal burst risks using dynamic and static loading analysis,” Rock Mechanics and Rock Engineering, Vol. 53, No. 3, pp. 1113–1128, Sep. 2019, https://doi.org/10.1007/s00603-019-01968-5
-
N. Chinthamu and M. Karukuri, “Data science and applications,” Journal of Data Science and Intelligent Systems, Vol. 1, No. 2, pp. 83–91, Jul. 2023, https://doi.org/10.47852/bonviewjdsis3202837
-
S. M. Nengem, “Symmetric kernel-based approach for elliptic partial differential equation,” Journal of Data Science and Intelligent Systems, Vol. 1, No. 2, pp. 99–104, May 2023, https://doi.org/10.47852/bonviewjdsis3202884
-
F. Ma, L. Sui, and W. Lian, “Prediction of mine subsidence based on InSAR technology and the LSTM algorithm: a case study of the Shigouyi Coalfield, Ningxia (China),” Remote Sensing, Vol. 15, No. 11, p. 2755, May 2023, https://doi.org/10.3390/rs15112755
About this article

The authors have not disclosed any funding.
The datasets generated during and/or analyzed during the current study are available from the corresponding author on reasonable request.
Quanqiu Chen: conceptualization, methodology, software, investigation, formal analysis, writing-original draft. Nan Jia: visualization, data curation, writing-review and editing.
The authors declare that they have no conflict of interest.
