Abstract
An alternative method to determine the average particle size of suspensions, from the loss of moisture as function of the time is presented. Consequently, the novelty of the method consists of determining the particle size through weight loss. According to this definition, these bulk variations are collected, by controlling at the same time, parameters as the relative dampness of the chambers and the temperature of the samples under analysis. Additionally, the data are processed in the time domain and Fourier-analyzed to obtain the average particle size. Statistically, the method was calibrated through the comparison with samples previously characterized by transmission electron microscopy, by using polymer latex dispersed in water with an average particle size of 24, 44, 74 and 105 µm.
Highlights
- Simple automated systems for measuring particle size
- Use of calibrated weight loss
- Comparison with Transmission Electron Microscopy images
1. Introduction
Many modern industrial and R&D processes require, as an important step during the preparation of many products, to determine, as precisely as possible, the particle size of the precursor materials [1-3]. For instance, in the chemical, cosmetic and pharmaceutical industries, the quality of the products is directly associated to the average particle size, since they are related to other important variables, such as the content of moisture, the pH, and/or the pressure of compaction [4-7]. In the agricultural sector, the moisture content determines the proper conditions of storage, processing and handling of the product, in order to either maintain its organoleptic properties or to avoid the proliferation of bacteria, and the particle size is a key variable to control the dehydration, for example [8-12].
In this general context, different methodologies to measure particle size can be classified depending on the morphology, measuring range and the attainable precision; among the most common ones we can mention [1-3, 7], [13-15], [16-20]:
– For dispersed powder and colloids: sieving, sedimentation, laser light scattering, optical microscopy, photoacoustic and ultrasound, Small-Angle X-ray Scattering (SAXS), flight time.
– For particles on substrates: chemisorption, Small-angle X-ray scattering, Ligand-Binding Assay (LBA), Transmission Electron Microscopy (TEM).
Besides the intrinsic advantages and disadvantages of each technique, to ensure precision requires a set of assumptions on the shape of the particle, porosity (or permeability), chemical activity and chemical phases, but above all, it depends on the type of a-priori information, for example, whether it is crystalline or amorphous, isolated particles or clusters, stoichiometric defects, cell structure (in the case of biological samples), etc. Generally speaking, microscopy techniques, in their different variants, are more precise, but are also the most expensive, and require time for the sample preparation and measurement, as well as image analyzers, and often, the results have no strong statistical significance.
Accordingly, this present paper proposes an alternative methodology to determine the average particle size, based on the loss of moisture contained as measuring parameter; it is therefore sensitive to the net particle area, its geometry and the level of porosity (or permeation factor). This loss of water is registered by measuring the change in weight by means of high precision scales, enclosed within a chamber with adiabatic walls. The basic idea consists of immersing the sample in water and assumes that the fluid is on 3 possible states: free water, i.e. not bonded in any way to the particles; water distributed over the surface of the particles, bonded by adhesion (mechanical) or reaction (chemical); and finally, intra cavity water, in other words, that which permeates the particle.
In the case of foods such as fruits and seeds, it is not necessary to add more water, since the goal is, generally, not measuring particle size, but rather the water content, however, it is also possible to make a distinction between them: moderately free water, which requires relatively little energy to remove it (about 2400 kJ/kg); water weakly bonded, usually encapsulated by membranes and not producing vapor pressure; and strongly bonded water, that forms an integral part of the cellular structure and, therefore, is retained by forces of significant magnitude and is, thus, the last to be removed, usually involving physiological transformations and degradation of other molecules [9].
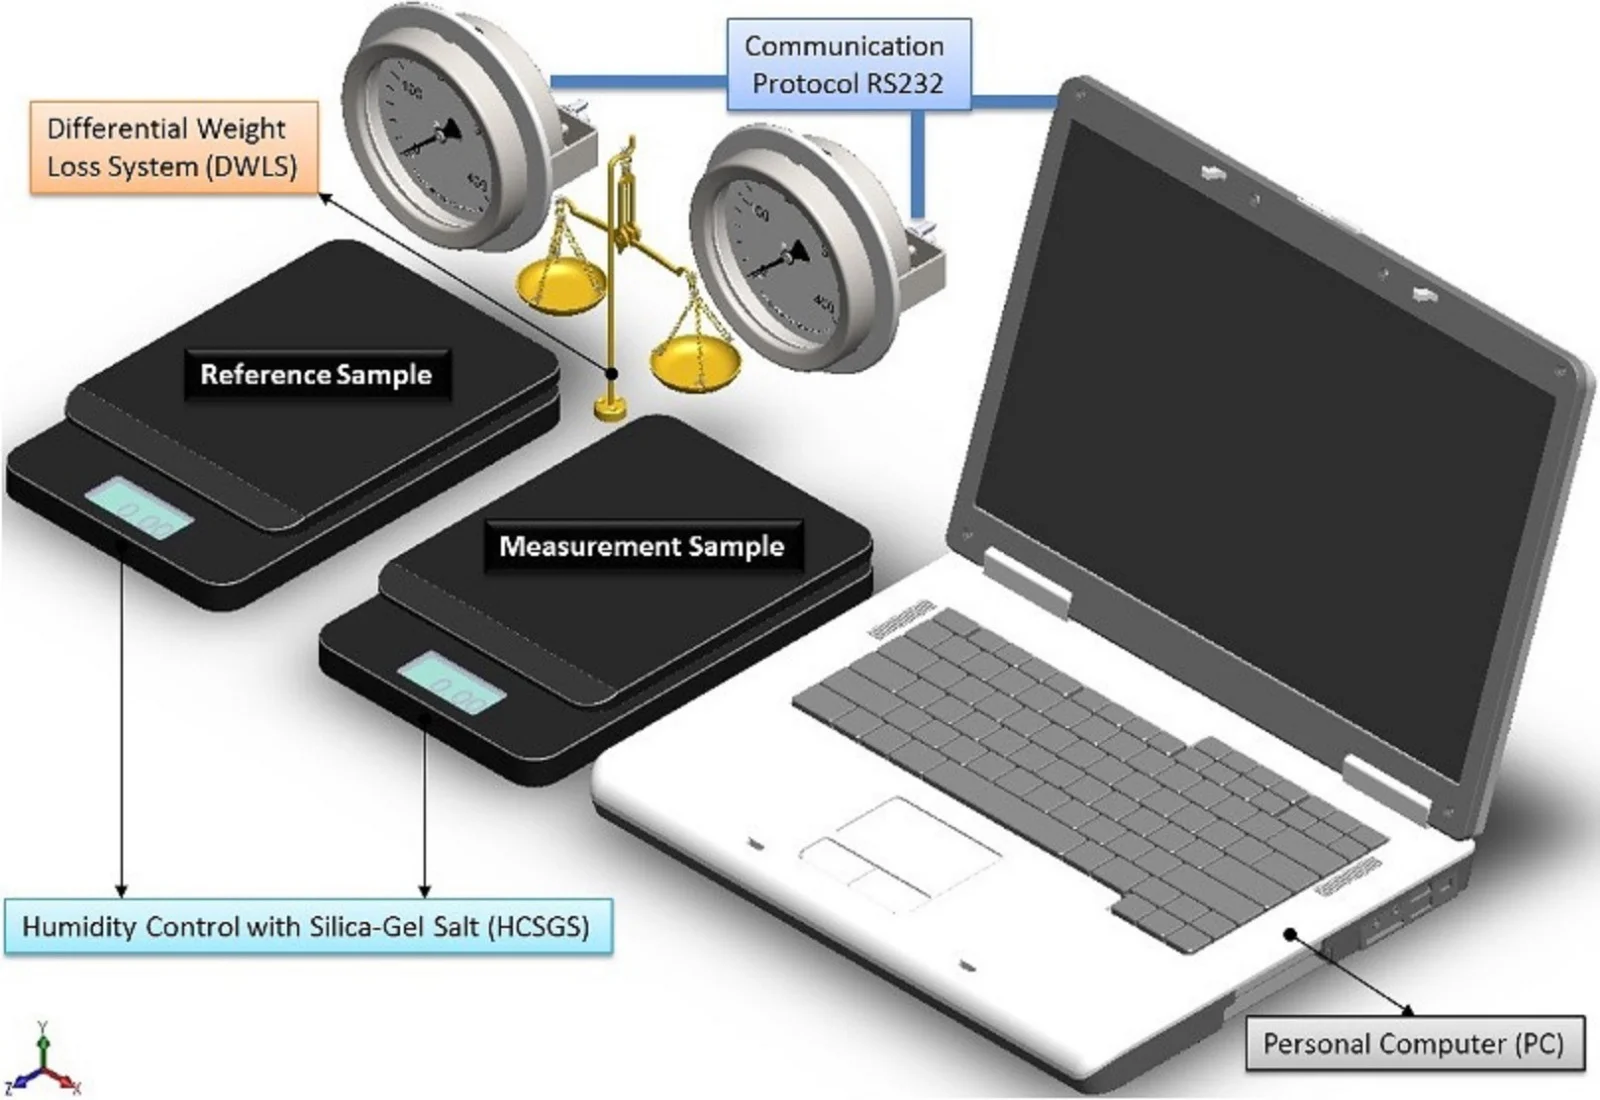
By considering all the system as ideally closed, there are three diffusion processes associated with each possible water status, then instant registration of weight, allows to distinguish every diffusion process and a further processing of data in the Fourier space, providing information for particle size. The sensitivity is increased by comparing it against a specimen prepared under the same conditions than the sample, and measuring the difference in weight between both test-tubes, as shown schematically in Fig. 1.
Fig. 1Scheme of the measurement system to evaluate particle size by humidity loss
2. Mathematical model
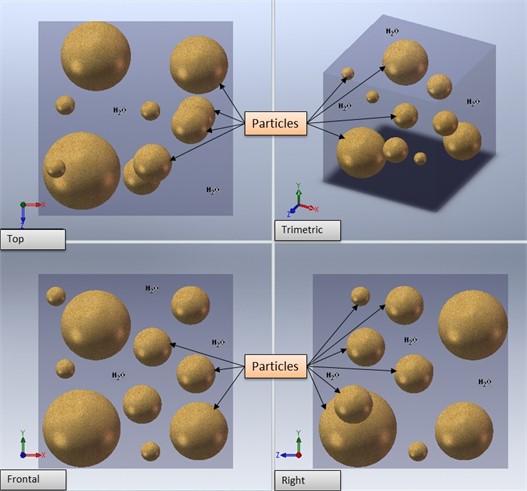
The theoretical analysis provides a diffusion model for each process. For the intra cavity water, as shown in Fig. 2, it was assumed, on this first approach, that the effective diffusion constant, Def, is isotropic and only depends on the distance to the surface, so the reduction in weight is proportional to the moisture loss.
The solution for different particle geometries has the form of cylinders [12], as described in Eq. (1):
From Eq. (1), the Concentration depends on the radius of the cylinder () and time (). Additionally, the concentration is throughout, initially (for a time ), and the surface is maintained at a constant concentration . Consequently, is kept at a constant concentration and at there is evaporation into an atmosphere for which the equilibrium concentration just within the surface is . Lastly, the effective diffusivity are correlated by the dimensionless Biot number () for mass transfer, and finally, for orders 0, 1, and is Bessel functions of first kind, respectively.
Fig. 2Physical model of the measuring particles in water
If particle geometries have the form of spheres [12] in the Eq. (2) holds:
From Eq. (2), considered the Concentration depends on the radius () and time (). Therefore, a sphere with the surface maintained at a constant concentration and at , is required. According to these definitions, the effective diffusion coefficient is a function of the temperature of the Arrhenius type, as in Eq. (3):
where is the diffusivity, is the activation energy, is the gas constant and is the drying temperature (expressed in Kelvin).
The rate of isothermal desorption has the form:
Hence, from Eq. (4), for surface water, the evaporation is proportional to the surface of the sample; a coverage factor (the number of particles absorbed among the total number of sites of absorption) is defined. = 1 for wet particles, and = 0 for particles that have no externally water (the case of fruits and seeds). Subsequently, where 1 for first order processes (not dissociative absorption and not re-combinative desorption), and is given by Eq. (5):
Moreover, on Eq. (5), is the frequency of desorption factor, is the fractional surface coverage and is molar enthalpy. If there are no changes in the chemical composition of the particle, then 1 and the solution take the form Eq. (6):
Furthermore, from Eq. (6), where and refer to instant and initial weight, respectively, and is the is a measure of the thermal energy released or absorbed. However, for free water, it is assumed that the amount of particles is much greater than the amount of water to be removed, so that the relative humidity pressure in the chamber is constant; in addition, there is no ventilation system, so the removal of water is only by natural convection, and depends on the concentration gradient according to Eq. (7):
Therefore, from Eq. (7), considering a Fick’s Second Law relationship, which spatially predicts how diffusion causes concentration to change with respect to time. Thus, the is the partial concentration with respect to time, is the diffusion coefficient, and is spatially, the concentration Laplacian. From Eq. (4), the subjected to the boundary condition, the is considered. For this reason, the reduction in weight is proportional to the loss of moisture by dehydration, as given by the Eq. (8):
Additionally, from Eq. (8), and refer to instant and initial weight, respectively, is the moisture content of the particle at each instant of time, is the initial moisture content and is the equilibrium moisture content. The solution for different particle geometries [12], [14], has the form of Eqs. (9-11).
Cubes:
Cylinders:
Spheres:
Moreover, from Eqs. (9-11), is the moisture content of the particle at each instant of time, H0 is the initial moisture content and is the equilibrium moisture content. Additionally, the Semi-infinite plates is described by the Eq. (12):
Mathematically, the final solution, takes the form given by the Eq. (13):
According to these definitions, in general, the diffusion is determined by analysis of the phenomenological processes of dehydration at room temperature. For this reason, is determined by a model in which the geometry is considered radial and moisture loss is exponential (), due to dehydration by evaporation on the surface of the sample, as given as Eq. (14):
From Eq. (14), where is the dry basis moisture content, is the mass of the water molecule, is the constant of gravity acceleration, is the surface area, is the evaporation surface unit and is the measurement time, then we assume the Eq. (15):
Lastly, from Eq. (15), the density and evaporation rate at near-equilibrium conditions (low evaporation) are equal to the diffusion of water flow on the surface of the sample, as described by Eq. (16):
From Eq. (16), where is the diffusive flow (mol·m-2·s-1), is the diffusion coefficient (m2s-1), is the concentration (mol·m3) and is the position (m).
3. Experimental setup
The first step was to calibrate the system with well-defined particles, in terms of size and shape. For this purpose, 0.1 grams of latex particles were dispersed in 10 ml of water to form a suspension. Particles of 4, 6, 24, 44, 74 and 105 m average size were previously measured by transmission electron microscopy.
4. Results and discussion
The experimental results for calibration of the system are shown in Fig. 3, where it is possible to distinguish two slopes, corresponding to the surface-bonded liquid and the intra cavity liquid; the free liquid slope is suppressed due to the differential operation mode.
Fig. 3Calibration plot with four samples of different particle size measured previously by electron microscopy
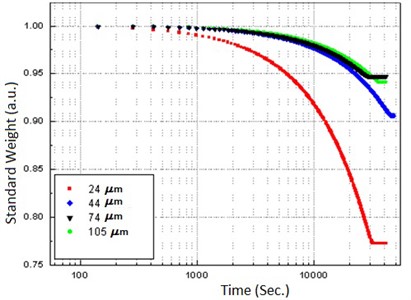
Other evident result is that a system of smaller particles retains more water. From the same figure, the characteristic times for the release of bonded water on each particle size, can be obtained by applying an exponential fitting (see Table 1).
Table 1Particle size and characteristic time for determining particle size
Particle size (μm) | Characteristic Time ( = sec) |
24 | 3.249197193×10 –5 |
44 | 4.595960905×10 –5 |
74 | 8.191054599×10 –5 |
105 | 17.06196205×10 –5 |
With these initial measurements a database was built expressly and the next experiments of loss of moisture were described in terms of weighted interpolations. A mixture of particles with different average sizes was prepared to evaluate the resolution of the technique. By controlling the proportion, it was possible to change the average particle size. In Fig. 4 and Table 2, the results of four different mixtures, are summarized, evidencing that it is possible to distinguish changes in slope and, therefore, variations in the characteristic dehydration time, of the order of 0.1 µs. In Fig. 4 an exponential fitting was applied for the region of bound water, with a first order linear adjustment between weight loss and particle size. The results are summarized in Table 2.
Table 2Summary of experimental results for determining particle size
Sample (Calculated size μm) | Characteristic time (= sec) |
A (20.2082) | 2.735852×10 –5 |
B (20.2779) | 2.745298×10 –5 |
C (26.1381) | 3.538662×10 –5 |
D (27.5784) | 3.733664×10 –5 |
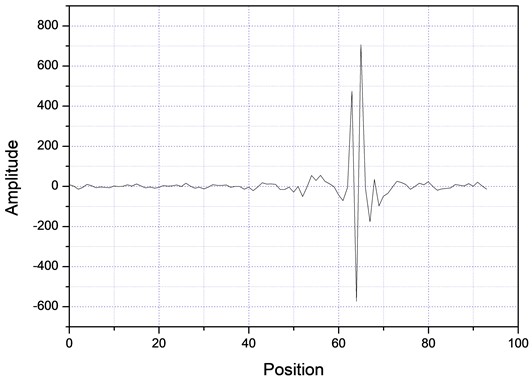
Then, the above measurement procedure was repeated for a wide gamma of unknown polymers, as shown in Fig. 5, showing, in each case, clear changes in the slopes, corresponding to each specific particle size. On the other hand, one can take the databases for the measurements A and B of Table 2, apply the Fourier transform, as shown in Fig. 6, plot the amplitude for the time that was acquired the data, obtaining the plots of Fig. 7, which shows absorption characteristic of the absorption process, indicating different particle sizes.
Fig. 4Plots for particle size determination
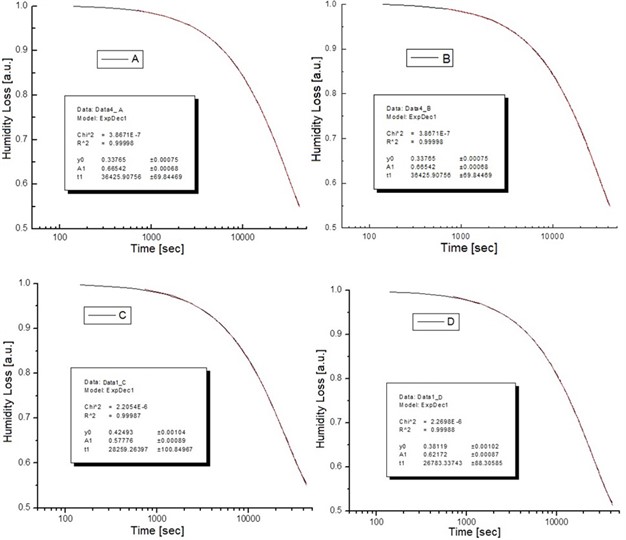
Fig. 5Time graph of weight loss results for different samples
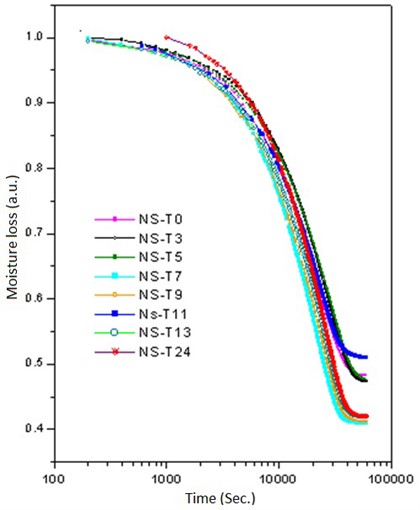
Fig. 6Bode plot to determine the response of the system on the frequency domain
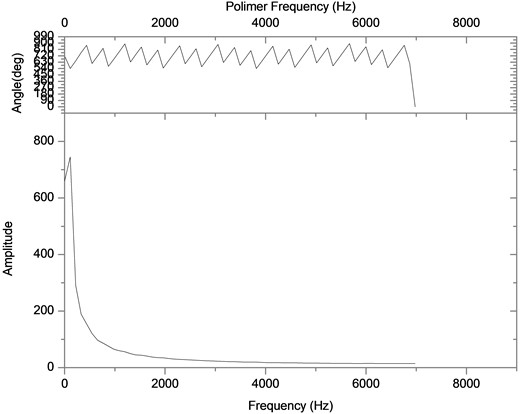
Fig. 7Fourier spectra for two different samples
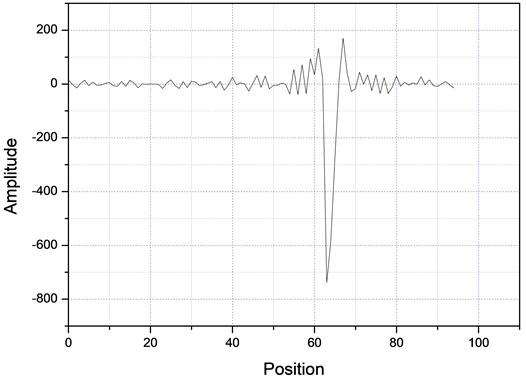
a)
5. Conclusions
The experimental setup shown allows knowing the particle size, depending on the water evaporating from the suspended particles. The system can be used as a complementary technique of the evaluation of particle size and in studies of the diffusion coefficient, since it presents a linear and reproducible response. By using Fourier transform it is possible to distinguish between different particles in a suspension. Also, this technique allows distinguishing free water bound (chemically and mechanically) in from water within an intra-articular cavity. The application to various industrial processes is under way and will be reported separately. Additionally, the limitations of the proposed alternative method for determining the average particle size of suspensions are: when using a load cell, the sensitivity and resolution of the signal of the Strain Gauges sensors such as, the noise generated by the amplification stage by the Wheatstone bridge, the digital resolution and the sampling rate of the digital system, and subsequently, adding the algorithm for digital signal processing using the Fourier transform. Finally, comparing the proposed method and known measurement methods, the main method of dynamic light scattering (DLS) is the most common measurement technique for particle size analysis. However, the final solution of the scattering problem to determine the particle size, it has the following disadvantages with respect to the proposed method: DLS has its limitations to solve populations of different size within the same sample. Additionally, the particles larger than eleventh of the laser wavelength show angular dependence in the intensity of the dispersed light. Moreover, as particle size increases, the thermal Brownian movement is no longer enough to maintain suspended particles. Consequently, the disadvantage of this method is that the accuracy of the purely diffusive movement, so the analysis of the particle size becomes less accurate. Furthermore, the complexity of DLS method, consists in determine the particle size, through of obtained by equating the coefficients of the expansions in vector spherical harmonics of the plane incident wave, the scattered wave, and the field inside the particle. Lastly, DLS thermal modeling does not analyze the impact of particle size on the importance of convection effects.
References
-
T. Allen, Particle Size Measurement, 3rd ed. London: Chapman & Hall, 1997.
-
W. G. Lee, “Mass calibration designs for a robotic comparator loading three weights at most,” Measurement, Vol. 45, No. 4, pp. 814–817, May 2012, https://doi.org/10.1016/j.measurement.2011.12.023
-
J. C. Vieira, O. M. F. Morais, C. M. A. Vasques, and R. de Oliveira, “A laboratorial prototype of a weight measuring system using optical fiber Bragg grating sensors embedded in silicone rubber,” Measurement, Vol. 61, pp. 58–66, Feb. 2015, https://doi.org/10.1016/j.measurement.2014.10.008
-
T. Leephakpreeda, “Novel method to weigh medical capsules in continuous process,” Measurement, Vol. 42, No. 7, pp. 1053–1058, Aug. 2009, https://doi.org/10.1016/j.measurement.2009.03.011
-
F. Wang et al., “Simultaneous measurement on gas concentration and particle mass concentration by tunable diode laser,” Flow Measurement and Instrumentation, Vol. 21, No. 3, pp. 382–387, Sep. 2010, https://doi.org/10.1016/j.flowmeasinst.2010.04.009
-
C. Washington, “Particle Size Analysis in Pharmaceutics and Other Industries; theory and practice,” General Pharmacology: The Vascular System, Vol. 25, No. 3, p. 607, May 1994, https://doi.org/10.1016/0306-3623(94)90227-5
-
W. M. Wood and R. W. Lines, “Particle size analysis using coulter counters,” Journal of the Society of Cosmetic Chemists, Vol. 17, pp. 197–211, 1966.
-
V. Çiftçi, S. Kaçmaz, Akçadag, and O. Sakarya, “Time evaluation for the steady state condition of the weight before the measurements,” Measurement, Vol. 25, No. 4, pp. 299–306, Jun. 1999, https://doi.org/10.1016/s0263-2241(99)00015-9
-
H. Imai, “Expanding needs for metrological traceability and measurement uncertainty,” Measurement, Vol. 46, No. 8, pp. 2942–2945, Oct. 2013, https://doi.org/10.1016/j.measurement.2013.04.046
-
S. Maikowske, A. Vittoriosi, and J. J. Brandner, “Optical measurement of evaporation processes using microstructured evaporators,” Flow Measurement and Instrumentation, Vol. 27, pp. 2–7, Oct. 2012, https://doi.org/10.1016/j.flowmeasinst.2012.02.003
-
C. I. Ochoa-Martínez and A. Ayala-Aponte, “Modelos matemáticos de transferencia de masa en deshidratación osmótica mathematical models of mass transfer in osmotic dehydration modelos matemáticos de transferencia de masa en deshidratación osmótica,” Ciencia y Tecnologia Alimentaria, Vol. 4, No. 5, pp. 330–342, Jul. 2005, https://doi.org/10.1080/11358120509487660
-
M. Sirousazar, A. Mohammadi-Doust, and B. F. Achachlouei, “Mathematical investigation of the effects of slicing on the osmotic dehydration of sphere and cylinder shaped fruits,” Czech Journal of Food Sciences, Vol. 27, No. 2, pp. 95–101, Apr. 2009, https://doi.org/10.17221/72/2008-cjfs
-
D. H. Melik and H. S. Fogler, “Turbidimetric determination of particle size distributions of colloidal systems,” Journal of Colloid and Interface Science, Vol. 92, No. 1, pp. 161–180, Mar. 1983, https://doi.org/10.1016/0021-9797(83)90125-x
-
S. Pabis, J. Digvir, and S. Cenkowski, Grain Theory and Practice. John Wiley and Sons Inc., 1998.
-
S. Lee, S. P. Rao, M. H. Moon, and J. C. Giddings, “Determination of mean diameter and particle size distribution of acrylate latex using flow field-flow fractionation, photon correlation spectroscopy, and electron microscopy,” Analytical Chemistry, Vol. 68, No. 9, pp. 1545–1549, May 1996, https://doi.org/10.1021/ac9511814
-
M. Marin, A. Hobiny, and I. Abbas, “The effects of fractional time derivatives in porothermoelastic materials using finite element method,” Mathematics, Vol. 9, No. 14, p. 1606, Jul. 2021, https://doi.org/10.3390/math9141606
-
I. Abbas, A. Hobiny, and M. Marin, “Photo-thermal interactions in a semi-conductor material with cylindrical cavities and variable thermal conductivity,” Journal of Taibah University for Science, Vol. 14, No. 1, pp. 1369–1376, Jan. 2020, https://doi.org/10.1080/16583655.2020.1824465
-
A. Hobiny and I. Abbas, “Analytical solutions of fractional bioheat model in a spherical tissue,” Mechanics Based Design of Structures and Machines, Vol. 49, No. 3, pp. 430–439, Apr. 2021, https://doi.org/10.1080/15397734.2019.1702055
-
F. S. Alzahrani and I. A. Abbas, “Analytical estimations of temperature in a living tissue generated by laser irradiation using experimental data,” Journal of Thermal Biology, Vol. 85, p. 102421, Oct. 2019, https://doi.org/10.1016/j.jtherbio.2019.102421
-
I. A. Abbas, “Generalized thermoelastic interaction in functional graded material with fractional order three-phase lag heat transfer,” Journal of Central South University, Vol. 22, No. 5, pp. 1606–1613, May 2015, https://doi.org/10.1007/s11771-015-2677-5
About this article

This work was supported by the Mixed Fund CONACYT - Zacatecas State Government under Grant project: ZAC-2009-C01-121774. The authors wish to thank Rene Preza-Cortés of CFATA-UNAM and I.S.C. Jakob Martinez-Medina of JIAPAZ for their technical support.
The datasets generated during and/or analyzed during the current study are available from the corresponding author on reasonable request.
Alejandro Castañeda Miranda constructed the prototype, made the measurements and revised the manuscript. M. Víctor Castaño devised the experiment, wrote the first draft of the article and secured resources.
The authors declare that they have no conflict of interest.
