Abstract
This study used vibration testing signals of soil samples under external loading to identify modal parameters (including natural frequencies and damping ratios) with different compaction degrees. Based on these parameters, a novel approach was proposed for reliable roadbed vibration compaction control and compaction process optimization. The experimental section utilized six soil samples with varying compaction degrees as experimental subjects, using the hammering method as the excitation mode. Subsequently, the frequency response function and modal parameters of the sample system were obtained through the acquisition, analysis, and parameter identification of samples’ acceleration signals. Firstly, samples with compaction degrees ranging from 88 % to 97 % primarily exhibited three modes, with the second modal frequency response displaying the weakest amplitude, and the fundamental mode being the dominant one. Additionally, parameter identification results revealed that the fundamental modal frequency exhibited a significant negative exponential growth with increasing compaction degree, while the second and third modal frequencies showed significant linear growth. Furthermore, the average damping ratio also demonstrated a tendency toward linear change with increasing compaction degree. Finally, the feasibility of modal parameters being actively used in practical engineering is discussed. Consequently, this study aimed to propose an indicator system for accurately assessing the bearing level of compacted soils from a modal dynamics perspective and to integrate modal dynamic indicators with density-class indicators into further optimization design work on road compaction processes.
1. Introduction
The quality detection and evaluation of roadbed quality often rely on the resilient modulus and compaction degree, which are commonly monitored through sampling. With the advancement of technology, intelligent compaction has emerged as a research hotspot in road construction, leading to a higher demand for quality management and a new trend in construction [1]. Current research on intelligent compaction has shifted towards continuous quality control, focusing on indicators such as the compaction meter value (CMV) and vibration compaction value (VCV) obtained from vibration mechanics and signal analysis [2-4]. Quality control was guided and controlled by establishing the statistical relationship between these indicators and compaction degree. However, the relevance of the statistical equation may be weak for some materials or different moisture states, impacting their utility [5]. Consequently, scholars have explored the physical relationship between the roller and the compacted material through physical modeling. The 2-degree-of-freedom system model, incorporating the roller-compacted material layer, served as the classical compaction model for theoretical study. This model involved the physical parameters of the roller and the dynamic parameters of the compacted layer, such as the stiffness coefficient and the damping. It can be used to theoretically establish a quantitative relationship equation between the dynamic parameters of the vibration-participating mass of the compacted layer and the compaction indicators. While this model is relatively simple, it fails to reflect the multi-modal characteristics of the compacted layer. Recognizing this limitation, many scholars have conducted numerical simulations or experimental studies on the multi-modal properties of the roadbed.
Ye et al. established a railroad bed with a 4-layer structure using finite element (FE) modeling, performed a modal analysis, and calculated the fundamental frequency and multi-modal vibration shape [6]. Zhang et al. established an FE model of a box-type roadbed and calculated its modal response under both dead and live loads. They then evaluated the safety of the roadbed based on the 1st to 5th vibration shapes and the modal frequencies [7]. Guo developed a FE model of the road structure and conducted a modal analysis. The results revealed that the energy consumption of the model's damping effect aligned with the actual stress state of the road, thereby validating the assessment of the roadbed’s capacity based on dynamic theory [8]. Liu et al. utilized FE software to construct a slab ballastless track-subgrade model and performed modal analysis. The results indicated that the first 6 modal frequencies are distributed between 4 and 7 Hz. Additionally, they concluded that altering the deformation modulus of the roadbed’s bottom layer has a more pronounced influence on the vibration frequency of the entire track [9]. Zhu et al. utilized a numerical simulation method to examine the modal response of a diseased road structure. They observed that the modal frequencies of the diseased roadbed are lower in comparison to the roadbed in good condition. After reinforcement, they noted a significant improvement in the main frequency of the roadbed [10]. In addition to the above, some field tests were conducted to validate the precision of the FE calculation outcomes. Chen et al. obtained attenuated free vibration waveforms using sensors buried in the field and performed an analysis of the natural vibration frequencies. Their findings indicated that the maximum entropy spectrum method is a more straightforward approach for analyzing natural frequencies in attenuated waveforms [11]. Moreover, Yao et al. investigated the propagation characteristics of vibration waves in the vertical direction of the roadbed based on a field test. They discovered the multi-modal wave characteristics of the roadbed and established a negative exponential relationship between the fundamental modal amplitude and other modal amplitudes [12].
In summary, recognizing and utilizing the multi-modal characteristics of roadbeds should emerge as a new research trend with the continuous development of compaction technology. The roadbed exhibits multi-modal characteristics under external load, and each modal frequency can potentially reflect the compaction quality, marking an innovative approach to road quality assessments. However, conducting multi-modal characteristics testing and analysis of the roadbed with different numbers of rolling passes at the construction site may inevitably disrupt construction. Additionally, the special requirements of the equipment for the experimental environment and power render the relevant tests challenging to conduct in the field. Therefore, conducting related research indoors beforehand is essential, especially since similar research results have not yet been forthcoming.
This paper utilized the experimental carrier as soil samples, conducting the modal test to explore the relationship between modal parameters and compaction degree. The modal test primarily aimed to obtain modal frequencies and damping ratios at different compaction degrees. These multi-modal parameters serve as a new indicator to reflect compaction quality and also provide a theoretical foundation for optimizing the compaction process of vibratory rollers. Setting the vibratory frequency without a solid theoretical basis carries the risk of inducing roadbed resonance, disrupting previously compacted structures, and suboptimal compaction results. Thus, it is crucial to first conduct the multi-modal characteristics research of soil samples with different compaction degrees indoors to determine a viable and effective compaction process for the roller.
2. Sample preparation and modal test methods
2.1. Sample preparation
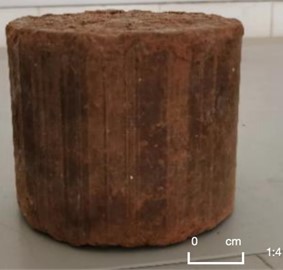
The raw material used for the sample preparation in this study is powdery clay. Six soil samples with varying compaction degrees were created by following the guidelines outlined in the “Highway Geotechnical Test Specification” (JTG3430-2020). The prepared loose soil was divided into three parts equally and loaded into the compaction cylinder in three layers, each with a fixed number of compaction. After preparation, the size of the sample was measured and recorded, and the surface was sampled to measure the actual moisture content, which corresponds to the measured water content. The samples were numbered after measurement, and the basic information about the raw materials and samples is detailed in Table 1 and Fig. 1 [13, 14].
Table 1Basic parameters of soil specimens
Number | Compaction degree / % | Diameter ×high / cm | Liquid limit / % | Plastic limit / % | Plastic index / % | Optimum water content / % | Maximum dry density / (g/cm3) | Measured water content / % |
S0 | 88 | 15.2×12 | 23.9 | 7.7 | 16.2 | 13.5 | 1.83 | 12.9 |
S1 | 91 | 14.2 | ||||||
S2 | 93 | 13.3 | ||||||
S3 | 94 | 13.6 | ||||||
S4 | 96 | 13.2 | ||||||
S5 | 97 | 14.0 |
Fig. 1Soil sample
2.2. Excitation mode and test methods
For the modal test in this experiment, the force hammer was selected as the excitation method due to convenience and practicality compared to others [15-17]. It not only allows for the application of impact force to any measurement point on the sample but also offers the flexibility to adjust the magnitude of the impact force. Additionally, the wider frequency test range of the force hammer makes it a more desirable test method for compacted soil structures with limited information. Furthermore, the soft rubber hammerhead in the experiment was chosen to minimize damage to the tested structure while meeting the required frequency range. After completing the installation of the hammerhead, the hammering test of the soil specimen commenced.
The detailed test procedure for the hammering test is as follows:
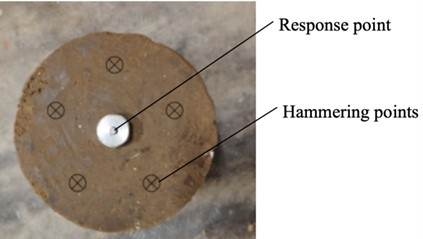
1) Measurement point labeling: the soil samples were de-molded and positioned on a fixed and clean platform, with a sponge placed between the sample and the platform to mitigate the rigid contact state. A circle was then marked on the center of the top surface of the sample, and the diameter was equivalent to half of the top diameter of the specimen. Five hammering points were evenly distributed around this circle, with the center of the circle designated as the response point for installing the acceleration sensor. The detailed locations of the response and hammering points are labeled in the sample shown in Fig. 2.
Fig. 2Hammering points and response point
2) Sensor Installation: a metal disc with a comparable contact area to the acceleration sensor was affixed with a nail at the response point for the placement of the acceleration sensor to ensure a stable signal and steady position during testing. Subsequently, connect the acceleration sensor and the force sensor of the force hammer to the signal collector to prepare for the test.
3) Pre-experiment: connect the PC with the signal collector, open the signal acquisition software, and start the pre-experiment. Hammer the desktop to ensure that the signal response of the force and acceleration sensors is normal.
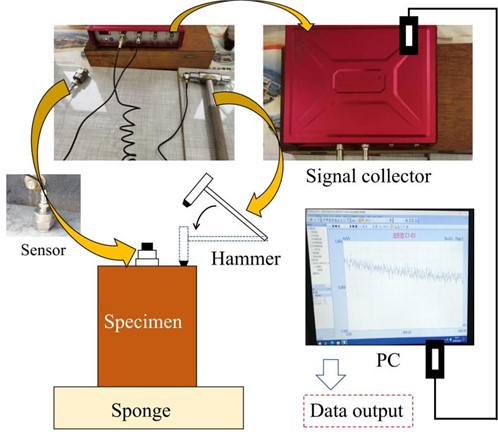
4) Hammering test: The force hammer was manually operated to perform a single hammering, with the acceleration time domain signal from each hammering collected by the sensors and collector, and sent to the software system in real time, as shown in Fig. 3. During the hammering process, it is important to ensure that the direction of the hammering is perpendicular to the top surface of the sample and that the force applied is appropriate to avoid causing damage. Additionally, the hammer should be lifted quickly after each hammering to prevent secondary impacts, which could result in unwanted signals and lead to overly complex analysis. Subsequently, the same hammering is performed on each hammering point and the signal is recorded. The test is repeated three times for each sample to ensure that there are three parallel experiments at each hammering point.
Fig. 3Test equipment connection
After the experiment, each sample should correspond to a total of 15 groups of test data, with 3 groups at each hammering point. Select suitable data from these three groups to carry out further research.
2.3. Test equipment
The test equipment consists of the uT85 dynamic and static strain collector, acceleration sensor, force hammer, and PC. Tables 2 and 3 present the pertinent parameters of the acquisition equipment and sensors based on the content of equipment instruction.
Table 2Main parameters of dynamic and static strain acquisition analyzer
Performance parameters | Value |
Sampling frequency / (Hz) | 1024 |
Measurement resolution / (m/s2) | 0.001 |
FFT block length (number of spectral lines) | 4K (1600) |
Voltage input range/(V) | ±5V |
Dynamic range | 120dB |
AD | ∑Δ24 bits |
Table 3Main parameters of vibration acceleration sensors
Performance Parameters | Value |
Operating voltage (V) | 24V±2 |
Sensitivity (mV/m/ s2) | 13.10 |
Acceleration range (m/s2) | ±190 |
Operating current (mA) | 2-10 |
Operating temperature (℃) | –40-125 |
Frequency range (Hz) | 0.16-5000 |
3. Theoretical basis for modal parameter identification
3.1. Displacement FRF for multi-degree-of-freedom systems
The differential equation of vibration can be expressed as Eq. (1) for an N-degree-of-freedom system [18]:
where [M], [C], and [K] are mass, damping, and stiffness matrix, respectively; {x}, {˙x}, and {¨x} are displacement, velocity, and acceleration arrays, respectively; {f} is the excitation force vector array. The displacement FRF of the system is:
where r is the modal number, kr, mr, and cr are the rth modal stiffness, modal mass, and modal damping, respectively; φlr and φpr are the values of the modal shapes at the l and p point of the rth mode, respectively; j is imaginary units; and ω is the value of the circular frequency, rad/s.
Eq. (2) reveals the relationship between the displacement FRF and the modal parameters, which is the theoretical basis for the test modal analysis. The mode of the FRF expressed by Eq. (2) is:
Eq. (3) can be further transformed as:
where, ξr=cr/2√mrkr is the rth modal damping ratio, ωr is the rth modal circular frequency, rad/s.
Considering the modal truncation problem, it was assumed that the modes were retained up to the G modes, and the higher modes above the Gwere neglected. From Eq. (4), it can be seen that the error generated by the high frequency can be approximated as a constant D. Therefore, Eq. (4) can be further changed to Eq. (5):
where, Kr=kr/φlrφpr.
After the FRF was measured and the test modal number G was identified, curve fitting can be performed based on Eq. (5). The results were identified as modal parameters such as the modal frequencies, damping ratios, and the residual conductance D of the samples.
3.2. Measurement of FRFs
Assuming that there was no noise in the measured response signal, the measured FRF can be obtained after one measurement according to the definition based on Eq. (6):
where, H(ω) is FRF; X(ω), and F(ω) are the Fourier transforms of the displacement and force time-domain signals, respectively.
However, since the actual test will always interfere with noise, it was necessary to eliminate the effect of noise to calculate the FRF. The FRF can be estimated by Eq. (7) or (8) [19]:
where ˆH1(ω) and ˆH2(ω) are the FRFs calculated when the output and the input are noisy, respectively, and ˆGxf(ω) and ˆGfx(ω) are the mutual power spectral density functions of the excitation force signal and the displacement response time-domain signal; ˆGff(ω) and ˆGxx(ω) are the self-power spectral density functions of the excitation force and displacement, respectively.
The coherence function reflects the data quality of the test results and is a basic parameter required for modal testing, and the constant coherence function of the system, γfx(ω), was calculated by Eq. (9). It is generally believed that the estimation of FRF is more accurate and reliable when γfx(ω)≥0.8 [20]:
4. Test results and identification of modal parameters
4.1. Modal response results and preliminary analysis
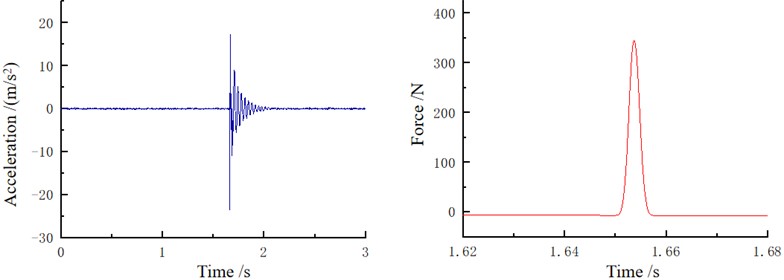
Each specimen was hammered sequentially according to the determined excitation points, and time-domain signals were obtained. The most typical test results among all were selected as a reference, as shown in Fig. 4.
Fig. 4Time domain response signal
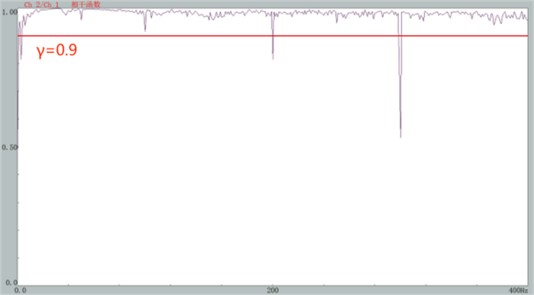
The displacement time-domain signal was first obtained by quadratic integration and then subjected to the Fast Fourier Transform (FFT). Subsequently, the estimation methods of FRF were conducted as H1(ω) and H2(ω) respectively, and the arithmetic mean of the two was computed to derive the final measured displacement FRF, demonstrated in Fig. 5. Each curve represents the result after averaging 5 tests. It is important to note the necessity of checking the coherence function to assess the signal quality obtained from the hammering test. The coherence functions of the data utilized must exceed 0.9 across a broad frequency band, indicating that the modal response was primarily induced by the hammering force, as shown in Fig. 6. Any data that failed to meet this criterion were excluded from subsequent analysis.
Fig. 5FRF curves
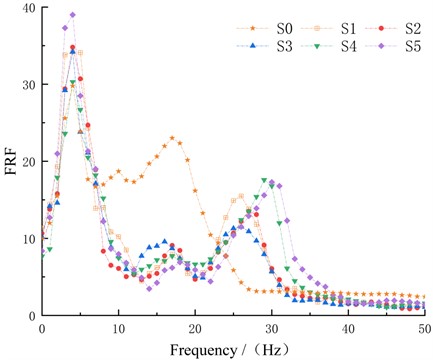
Every specimen exhibited significant 3 modes through hammering, based on Fig. 5. However, slight differences in modal amplitudes can be observed due to variations in material composition and hammering force at the excitation point. For samples S1~S5, the peaks of each mode were separated by approximately 10 Hz. The 1st modal frequency, around 4.5 Hz, displayed the highest peak value, indicating a dominant and significant amplitude-frequency characteristic. The 2nd modal frequency ranged from 15 to 20 Hz with the lowest amplitude. The 3rd modal frequency, falling between 25 and 30 Hz, was close to the recommended roller vibration frequency for compaction and exhibited the second-highest peak after the 1st modal. Notably, S0 differed from the others in terms of modal frequency location, with modes distributed within 20 Hz. This suggested significant changes in mechanical properties at the compaction level near S0 compared to higher compaction degrees, warranting further investigation of modal parameters to gain deeper insights into these variations.
Fig. 6Coherence function (the horizontal coordinate is the frequency, Hz; the vertical coordinate is the coherence function value)
4.2. Modal parameters identification
The modal parameters, including modal frequencies and damping ratios of each mode, were identified through Nonlinear Least Squares. This method adjusts the parameters of the fitting function iteratively to minimize the sum of squares of the residuals between the actual data and the fitting function. In addition, denoising the original output signal was essential before fitting to minimize the influence of noise spikes to enhance result reliability. Subsequently, utilizing Eq. (5) as a mathematical model, modal parameters were obtained via curve fitting, selecting a modal number G=3 for fitting based on the peak characteristics of the measured FRF. Notably, ω took values in the range [0, 50] in Eq. (5), considering the distribution interval of the modes. Meanwhile, using 1/Kr in Eq. (5) as the regression coefficient. This coefficient reflected the degree of contribution of each mode to the FRF, which can be visualized in Fig. 7. Furthermore, Fig. 7 illustrates the effect of fitting based on the FRF model. Table 4 presents the parameter identification result based on this fitting, including fr and ξr.
The standard errors (SE) and relative standard errors (RSE) of each identifiable parameter, reflecting the confidence level of the modal fitting results, are shown in Table 4. As for modal frequencies, the RSE range for the 1st to 3rd modal frequencies were 1.44 %-7.80 %, 7.58 %-13.89 %, and 3.71 %-6.71 %, respectively. The RSE of damping ratios ranged from 8.00 %-10.83 %, 10.00 %-35.00 %, and 5.00 %-12.86 %, respectively. It can be seen that the error level of the 2nd mode was relatively high due to the low intensity of the intermediate modal signal, resulting in small amplitude variations in the spectrum. More precisely, identifying it required a higher signal-to-noise ratio and finer data analysis. In contrast, the fundamental mode and the 3rd mode had more significant peak features in the spectrum, making them easier to detect and distinguish. Comparing the error levels of damping ratios and modal frequencies, the error range of modal frequencies was narrower due to the significant peak features. This indicated that modal frequencies were easier to identify and had higher accuracy compared to damping ratios, which are more susceptible to the quality of the signal.
Fig. 7The effect of fitting the FRF
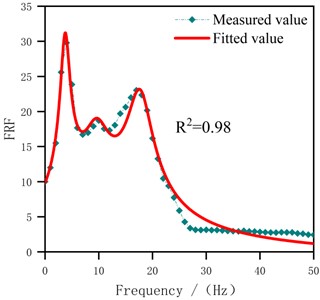
a) S0
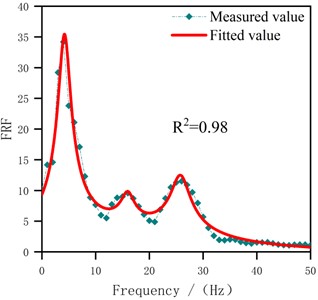
b) S1
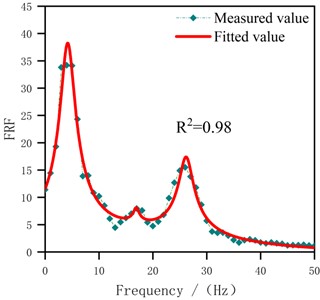
c) S2
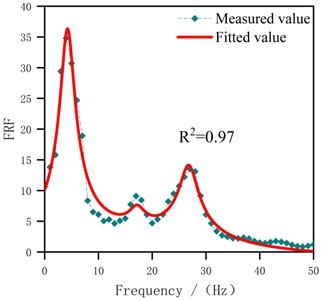
d) S3
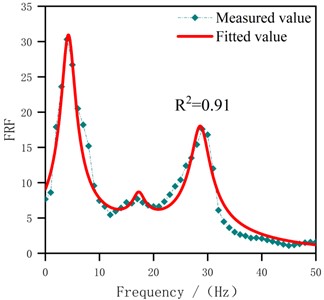
e) S4
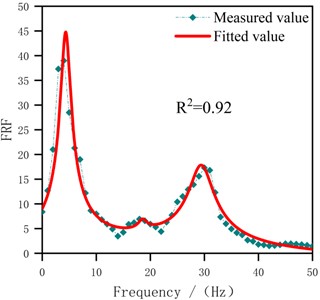
f) S5
4.3. Validity analysis of modal test methods
The dimensionless relevance between modal frequency and compaction degree was established using Table 4 data to analyze the practical value of modal parameters in road compaction operations. Referring to the variation law of modal frequency with compaction degree, the exponential and linear function models were used to fit the fundamental mode and other modes based on the least square method. The results are presented in Eqs. (10-12):
where, f1, f2, and f3 are the 1st to 3rd modal frequencies, Hz; fs is the upper limit of frequency bandwidth, fs=50 Hz of interest in here; and γ is the compaction degree, %.
Table 4Modal parameters identification results
Sample number | Mode | ξr±SE | RSE /% | fr±SE /Hz | RSE /% | D |
S0 | 1 | 0.14±0.012 | 8.57 | 3.96±0.089 | 2.25 | 0.01 |
2 | 0.13±0.029 | 22.31 | 10.22±1.420 | 13.89 | ||
3 | 0.07±0.009 | 12.86 | 18.97±1.022 | 5.39 | ||
S1 | 1 | 0.13±0.012 | 9.23 | 4.51±0.065 | 1.44 | 0 |
2 | 0.04±0.009 | 22.50 | 16.05±1.298 | 8.09 | ||
3 | 0.07±0.009 | 12.86 | 25.91±1.123 | 4.33 | ||
S2 | 1 | 0.12±0.013 | 10.83 | 4.63±0.156 | 3.37 | 0.01 |
2 | 0.02±0.007 | 35.00 | 16.93±1.313 | 7.76 | ||
3 | 0.06±0.003 | 5.00 | 26.24±1.760 | 6.71 | ||
S3 | 1 | 0.12±0.011 | 9.17 | 4.66±0.324 | 6.95 | 0.31 |
2 | 0.04±0.007 | 17.50 | 17.31±1.312 | 7.58 | ||
3 | 0.04±0.003 | 7.50 | 26.91±1.124 | 4.18 | ||
S4 | 1 | 0.1±0.008 | 8.00 | 4.65±0.297 | 6.39 | 0 |
2 | 0.02±0.004 | 20.00 | 17.54±1.650 | 9.41 | ||
3 | 0.02±0.002 | 10.00 | 28.75±1.066 | 3.71 | ||
S5 | 1 | 0.12±0.01 | 8.33 | 4.55±0.355 | 7.80 | 0.05 |
2 | 0.02±0.002 | 10.00 | 18.59±1.489 | 8.01 | ||
3 | 0.02±0.002 | 10.00 | 30.29±1.435 | 4.74 |
There was a significant relevance between modal frequencies and compaction degree in Table 4 at the significance level α=0.05. Therefore, the 1st modal frequency of the sample demonstrated a growth pattern following a negative exponential function as compaction increases [21, 22]. Additionally, the 2nd and 3rd modal frequencies exhibited approximately linear increases with compaction. Notably, the 3rd modal frequency’s growth rate was significantly higher than the 2nd. This mode implied that higher modes were more sensitive to changes in the physical properties of the sample.
In addition, it can be seen that the damping ratio exhibited a significant level of variability from Table 4. Moreover, there was no strong relevance between the damping ratios of different modes and the compaction degree. This was because the damping ratio was influenced by multiple factors, not just the compactness of the soil. The damping ratio was closely related to the viscoelastic property of the compacted soil. The property may affected by particle arrangement, pore structure, and so on. These structure factors may result in different energy dissipation mechanisms at different frequencies, thereby affecting the identification of damping ratios for different modes. However, further analysis revealed that there was still a certain linear relevance mechanism between the average damping ratio of the specimens (the arithmetic mean of the damping ratios of three modes) and the compaction degree. The relevance relationship is shown in Eq. (13). There was a significant relevance at the significance level α=0.05. This was because when calculating the average damping ratio, the damping ratios of modes 1 to 3 are comprehensively considered, thereby reducing the influence of individual damping ratios by other factors and overall presenting a linear relevance with compaction degree:
where the ξ is the average damping ratio.
The above statistical analyses show that the sample modal testing method was established and the results of modal parameter identification are reliable.
4.4. Discussion
The mechanical indicators of compacted soil samples, specifically the natural frequencies and average damping ratios involved in this study, exhibit a strong liner and nonlinear relevance with the compaction degree of the samples. This suggests that the modal parameters expressed in the soil structure's vibration can effectively reflect the compaction quality. Regarding the application of the modal parameters and analysis results, in conjunction with the existing frequency range of compaction equipment (29-75 Hz), modal frequencies and average damping ratios can serve as significant references for developing compaction and quality control technologies. For instance, loose soils often require stronger agitation to achieve rapid compaction within a short time in the initial stages of compaction operations. Therefore, pre-experimental compaction operations can be prioritized on test road sections to actively apply vibration loads, collect vibration responses under different compaction states, and analyze them to identify the modal frequency ranges of the soil layer at various compaction levels. Additionally, attention should be given to the variation pattern of the first modal frequency to determine the attenuation level of growth rate and the numerical range of average damping ratio when compaction operations are completed (the use of “attenuation level” and “numerical range” is intended to take into account the fact that constant data will be difficult to obtain due to the many complex factors of field testing). During compaction operations, selecting suitable compactors (within the modal frequency range close to the compacted soil) for compaction work is recommended. Subsequently, when compaction operations reach or approach the ideal state, vibrating compactors or static compaction methods, which operate away from the modal frequency range, can be employed to complete finishing operations and avoid over-compaction. In summary, valuable insights can be provided for the improvement of compaction techniques by exploring the regularities of the mechanical indicators of compacted soil structure. It is important to note that in addition to the regularity of internal responses of soil structures, the form of external excitation also influences experimental results.
This study primarily collects and analyzes the dynamic responses of compacted soil structures by actively applying excitation, with the form of impact loads. Due to the convenience of impact load, numerous devices based on impact are based on impact for quality inspection of road structures, such as FWD, DCP, etc., most of which detect the bearing capacity of roads by detecting their physical deformations. The method proposed in this study is also based on the vibration response caused by impact load. However, this study focuses more on vibration rather than deformation. Vibration, as the most common motion pattern in nature, can reflect the level of a structure's resistance to external influences. However, this resistance cannot be directly discerned solely by the characteristics of the vibration waveform surface, hence the need to describe it by extracting parameters from the vibration response mode. Generally, it isn't easy to exhibit a single mode even under compaction, resulting in numerous modes due to the soil's inherent granular characteristics. Therefore, this study seeks feasible mechanical indicators through relevance analysis between relevant parameters and the most traditional compaction quality indicator, compaction degree. Although traditional quality inspection methods based on impact loads provide a more intuitive reflection of structural strength, significant deformation does not necessarily indicate the low load-bearing capacity of the structure. Therefore, further development is required for current compaction and quality inspection techniques to meet the demands for accuracy and efficiency in the era of intelligent compaction. Furthermore, guided by traditional physical indicators, obtaining the modal dynamic indicators of road structures and systematically monitoring the quality changes during road compaction processes should be one of the key research directions in road engineering. Additionally, experimental exploration should be prioritized indoors before the dynamic modal experiment of large-scale structures, which is also emphasized in this study.
The test method for modal parameters of cylindrical samples represents an exploratory endeavor in modal testing of indoor sample systems, with the potential for further enhancement. This is owing to the impact of factors such as shape, size, supporting and contact conditions, which influence the modal characteristics and parameters of a sample [23, 24]. Moreover, modal parameters for the same structure under different boundary conditions may vary. Consequently, the modal parameters obtained using this method may not align closely with results from field-measured roadbeds with similar soil quality and compaction. Meanwhile, the choice of incentive methods still requires further comparative research. Although the convenience of hammering as an incentive cannot be denied, the stability in stimulating the modalities of large-volume structures is uncertain. Notably, comparative analysis with field results has not been conducted due to limitations. Hence, the need for potential improvements in the indoor testing method is a pressing issue to address.
5. Conclusions
This study explored the indoor modal dynamic characteristics of soil samples with different degrees of compaction based on the experimental modal analysis theory. Firstly, the vibration signals were generated by stimulating the top of the sample and collected. Secondly, the frequency domain characteristics were analyzed by integrating the displacement signals and using FFT. Additionally, the correlation between modal parameters and compaction degree was fitted to seek their relationship based on Least Squares. Finally, the potential application of modal parameters in practical engineering was discussed, leading to the following main conclusions.
1) An indoor sample modal testing method was developed, involving the use of a compacted cylindrical soil sample and the uniform arrangement of five hammering points around the center of the specimen's top surface circle. The hammering test, utilizing a force hammer, was conducted to obtain the vibration acceleration signal, thereby facilitating the extraction of multi-modal characteristics and modal parameters through modal analysis.
2) The soil samples across six compaction levels displayed three modes within the frequency range relevant to engineering considerations. This phenomenon reflected the vibration modal characteristics of the soil samples when they approached the compaction requirement.
3) For this particular soil, samples with 88 % compaction exhibited the first three modal frequencies at 3.96 Hz, 10.22 Hz, and 18.97 Hz. In contrast, specimens with compaction levels ranging from 91 % to 97 % displayed the first three modal frequencies approximately around 4.5 Hz, 15-20 Hz, and 25-30 Hz.
4) A statistical relationship equation was established between the compaction degree and modal parameters. This equation revealed the variation pattern of the modal frequencies and average damping ratio. Specifically, as the compaction degree increases, the 1st modal frequency displayed a negative exponential function increase, while the 2-3 modal frequencies and average damping ratio exhibited an approximately linear increase.
5) The modal test method and its results established in this paper require comparison with field test results to make necessary corrections and improvements.
References
-
Y. Ye et al., “Review on vibration compaction theory and intelligent compaction technology of high-speed railway roadbed,” (in Chinese), China Railway Science, Vol. 42, No. 5, pp. 1–11, 2021, https://doi.org/10.3969/j.issn.1001-4632.2021.05.01
-
Z. Zhang, “Experimental study of a project based on the CMV value of roadbed intelligent compaction technology,” (in Chinese), Hebei University, Hebei, 2017.
-
Z. H. Nie, “Comparison experimental study on subgrade compaction quality test methods,” Applied Mechanics and Materials, Vol. 71-78, pp. 4679–4684, Jul. 2011, https://doi.org/10.4028/www.scientific.net/amm.71-78.4679
-
Y. Ma et al., “Dynamic simulation and evolution of key control parameters for intelligent compaction of roadbed,” (in Chinese), Journal of Central South University (Science and Technology), Vol. 52, No. 7, pp. 2246–2257, 2021, https://doi.org/10.11817/j.issn.1672-7207.2021.07.012
-
G. Xu and Z. Luo, “Research on limitation of harmonic ratio of compaction meter for continuous compaction control,” Road Machinery and Construction Mechanization, Vol. 32, No. 8, pp. 39–42, 2015, https://doi.org/10.3969/j.issn.1000-033x.2015.08.019
-
H. Ye et al., “Study on dynamic response of railway roadbed under blasting vibration,” (in Chinese), Modern Mining, Vol. 34, No. 4, pp. 185–189, 2018, https://doi.org/10.3969/j.issn.1674-6082.2018.04.052
-
Z. Zhang et al., “Static and dynamic characteristics analysis of flange frame box roadbed of high-speed railway,” (in Chinese), Roadbed Engineering, Vol. 2023, No. 4, pp. 6–12, 2023, https://doi.org/10.13379/j.issn.1003-8825.202212051
-
P. Guo, “Assessment method of bearing capacity of highway roadbed in service,” (in Chinese), Chongqing University, Chongqing, 2019.
-
Z. Liu, “Analysis of the multi-layer structures on the roadbed of the high-speed railway,” (in Chinese), Shijiazhuang Tiedao University, Hebei, 2014.
-
D. Zhu et al., “Pseudo modal analysis and state assessment of the railway roadbed structure in operation,” (in Chinese), Journal of Railway Science and Engineering, Vol. 15, No. 2, pp. 352–360, 2018, https://doi.org/10.3969/j.issn.1672-7029.2018.02.011
-
X. Chen, Y. Wang, and C. Wang, “Modal analysis and experiment research on natural frequencies of transition section roadbed of high-speed railway,” (in Chinese), Journal of Central South University (Science and Technology), Vol. 43, No. 1, pp. 322–327, 2012.
-
J. Yao, M. Yue, H. Ma, and C. Yang, “Wave propagation characteristics and compaction status of subgrade during vibratory compaction,” Sensors, Vol. 23, No. 4, p. 2183, Feb. 2023, https://doi.org/10.3390/s23042183
-
F. Tatsuoka, “Compaction characteristics and physical properties of compacted soil controlled by the degree of saturation,” in Geotechnical Synergy, 2015.
-
S. Liu et al., “Laboratory test of kinetic parameters of compacted soil specimen,” (in Chinese), Journal of Chang’an University (Natural Science Edition), Vol. 42, No. 4, pp. 1–9, 2022, https://doi.org/10.19721/j.cnki.1671-8879.2022.04.001
-
W. Liu and W. Zhang, “Impact testing-one of a fast and easy method of testing modal analysis,” (in Chinese), Journal of Chang’an University (Natural Science Edition), Vol. 1993, No. 4, pp. 80–85, 1993.
-
Cunha and E. Caetano, “Experimental modal analysis of civil engineering structures,” in 1st International Operational Modal Analysis Conference (IOMAC), 2006.
-
C. Pappalardo and D. Guida, “System identification and experimental modal analysis of a frame structure,” Engineering Letters, Vol. 26, No. 1, 2018.
-
D. Li and H. Lu, Experimental modal analysis and its applications. Beijing: China Science Publishing & Media Ltd., 2001.
-
Y. Chen, Modal Testing Techniques and Practices. Beijing: China Machine Press, 2021.
-
L. Ma, Z. Zhu, and Z. An, “Modal analysis of a car BIW,” (in Chinese), Journal of Vibration and Shock, Vol. 32, No. 21, pp. 214–218, 2013, https://doi.org/https://doi.org/0.3969/j.issn.1000-3835.2013.21.037
-
Q. Wu et al., “Evaluation on compaction quality of base course based on system natural frequency,” (in Chinese), Science Technology and Engineering, Vol. 21, No. 30, pp. 13095–13101, 2021, https://doi.org/10.3969/j.issn.1671-1815.2021.30.041
-
J. Li, Z. Zhou, and Y. Li, “Test analysis of relationship between natural frequency and compaction degree for roadbed soil,” (in Chinese), Transactions of the Chinese Society of Agricultural Engineering, Vol. 39, No. 2, pp. 265–271, 2019, https://doi.org/10.3969/j.issn.1002-6819.2012.14.012
-
P. Gupta, M. Law, and S. Mukhopadhyay, “Evaluating tool point dynamics using output-only modal analysis with mass-change methods,” CIRP Journal of Manufacturing Science and Technology, Vol. 31, pp. 251–264, Nov. 2020, https://doi.org/10.1016/j.cirpj.2020.06.001
-
E. Madenci, Y. Onuralp Özkılıç, and L. Gemi, “Buckling and free vibration analyses of pultruded GFRP laminated composites: experimental, numerical and analytical investigations,” Composite Structures, Vol. 254, p. 112806, Dec. 2020, https://doi.org/10.1016/j.compstruct.2020.112806
About this article

The research was supported by the Open Project of Shandong Hi-speed Group, China, and the authors would like to acknowledge the financial support.
The datasets generated during and/or analyzed during the current study are available from the corresponding author on reasonable request.
Chuan Wang: resources, investigation, methodology. Zhenghao Ma: software, writing, data curation. Shutang Liu: supervision, writing-review and editing, conceptualization. Peizhi Zhuang: validation, data curation, resources. Weidong Cao: visualization, formal analysis.
The authors declare that they have no conflict of interest.
