Abstract
The soft soil foundations of gravity wharves are subject to the wharf weight and wave forces, and the deterioration of the wharf soil foundation strength under such cyclic loading affects the structural safety of gravity wharves. This study investigated the weakening characteristics of soft soil strength. Undrained triaxial tests were conducted on undisturbed saturated soft soil specimens under isotropic consolidation conditions, and a dynamic finite element model of the wave–gravity-structure–soft-soil-foundation interaction was established. The results indicated that the shear modulus of the soil was related to the effective confining pressure and shear strain; this relationship was fitted using the Van Genuchten equation. As the internal friction angle of the soft-soil foundation decreased, its stability decreased nonlinearly, the strength decreased, and the sliding failure surface expanded. Simply increasing the riprap layer thickness had a limited effect on the overall wharf stability. These findings will guide the design of gravity wharves with foundations on soft soils in port areas that are subjected to intense wave actions.
Highlights
- Triaxial tests were conducted on saturated soft clay under isotropic consolidation.
- A finite element model of wave-gravity structure-soft soil interaction was developed.
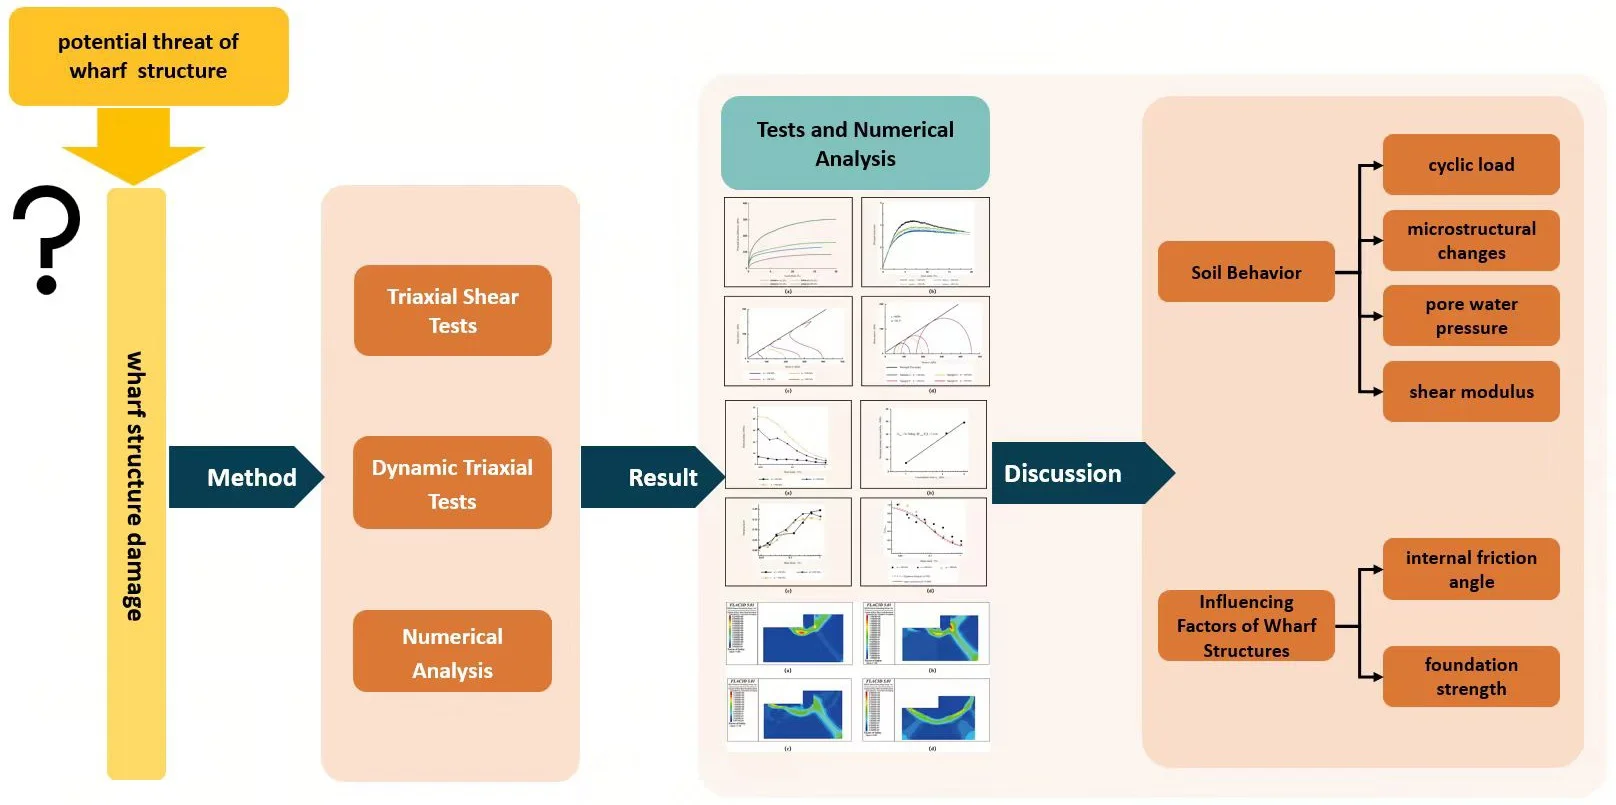
- By comprehensively analyzing the damage mechanism and structural safety of the wharf under wave-gravity structure-soft ground coupling, it provided a methodology for the performance design of deep water gravity wharf.
1. Introduction
The topsoil in the coastal areas of China is generally soft with a large pore ratio, high water content, low shear strength, and high compressibility. The construction of gravity wharves on such soft soil represents a practical port and coastal engineering problem [1], [2]. Under wave loading, the wharf structure transmits the reciprocating action of waves to the soft-soil foundation and overlays a reciprocating dynamic stress field on the static stress field of the foundation. This causes deformation accumulation and excess pore pressure growth in the soil, reduces the soil shear strength, and poses a significant threat to the stability of the wharf structure that can lead to damage [3]-[5].
Accordingly, research has been conducted to investigate the dynamic characteristics of wharf soft foundations. Tsai et al. [6], Lei et al. [7], and Cheng et al. [8] conducted clay experiments and proposed the effective stress path concept to explain the difference between the static and dynamic strength of soft clay and the static strength of soft clay after cyclic loading. After cyclic loading, the static strength of the soil can be determined by the effective stress method or total stress method. Lazcano et al. [9] and Chen et al. [10] studied the bearing capacity of shallow foundation under cyclic loading in cohesive soil, established the relationship between softening and factors such as the environment and load, and predicted the maximum cyclic load that soft clay can bear before exhibiting softening damage, using the results of cyclic triaxial tests. Pengyue [11] and Gu et al. [12] studied the cumulative deformation characteristics of marine soft soil in Zhoushan, Zhejiang and Yangjiang, Guangdong, and suggested values for the HSS model parameters of marine soft soil in these areas. Most of the existing research results are based on experiments conducted on specific soil types in specific regions, and their universality requires further verification.
The significant changes in the soil characteristics of soft soil foundation caused by cyclic loads inevitably affect the interaction with the foundation’s upper structure, promoting experimental research on wave–structure interaction. Huang and Chen [13], Song et al. [14], and Chávez et al. [15] studied the wave, scour, and load characteristics of a mixed structure connected to a pile-supported pier and pile breakwater by conducting 1/30 scale experiments in a water tank. Cui et al. [16] and Yao et al. [17] established numerical finite element model considering wave loads, breakwater structures, and seabed foundations. The dynamic response of the foundation and structure under wave action was analyzed, and model experiments were conducted. The results of the two models were in good agreement. Madabhushi et al. [18], Zhang et al. [19], and Dakoulas et al. [20] studied the dynamic behavior of gravity dock structures under strong earthquakes and wave forces and found that the structural stiffness decreased owing to excessive pore pressure and structural settlement. Shen et al. [21], Zheng and Zhang [22], and Xiao [23]-[24] established a finite element model of the foundation pile upper structure of a high pile wharf using the ANSYS software to investigate the particular damage situation of the overall wharf structure under ocean wave cyclic loads. They simulated and analyzed the damage and failure patterns of the wharf after different operating years.
In summary, thus far, the research conducted by domestic and foreign scholars on the interaction between structures and soft soil foundations under cyclic loads can be essentially divided into two categories: static and dynamic methods. The dynamic methods only apply waves as sinusoidal loads and ultimately determine the dynamic response and dynamic amplification factor of the structure by analyzing its cumulative displacement value. In static methods, wave forces are only considered ordinary loads, and the weakening effect of soil is only considered based on the static strength values corresponding to the attenuation of soft soil to a stable state [25]. The two do not reflect the dynamic process of strength weakening of soft clay under cyclic loading during the analysis process, which often leads to the design of the dock structure being biased towards danger. This study investigates the weakening characteristics of soft soil strength under undrained test conditions using indoor dynamic triaxial tests. The test results are integrated into a numerical finite element model, and wave cyclic dynamic loads are simulated by changing the internal friction angle to truly reflect the actual situation of wave-structure-soft-soil interaction. The established soft-soil dynamic constitutive relationship and numerical analysis method for soft-soil foundation enabled successful prediction of the settlement and displacement of the dock under marine environmental loads. This provides accurate calculation methods for the performance design and parameter optimization of deep-water gravity docks, improves the stability and service life of the docks, and reduces construction costs, in addition to providing novel ideas and methods for the research on marine soil mechanics, promoting the development of the discipline.
2. Materials and methods
2.1. Numerical analysis
The safety of the gravity structure was analyzed using the PLAC3D finite element software by applying the elastic-plastic finite element method to obtain the slip surfaces corresponding to structural failure.
2.1.1. Engineering case study
The case-study wharf is located on the eastern coast of China. It is a gravity structure with a height of 15 m and a width of 12 m. The water depth is 12 m, the backfill prism behind the structure is 8 m wide, the riprap bed beneath the structure is 3 m deep, and the friction coefficient between the riprap and wharf is 0.5. The environment of the project is complex, with deep water and large waves. A geological exploration report indicated that a thick, soft soil layer was distributed around the foundation. Simulation conditions reflecting a harsh wave environment with a 25-year return period, design wave height H1% of 6 m, and average wave period of 6 s were applied. The initial simulation parameters are listed in Table 1.
Table 1Initial simulation parameters.
Material | Saturation density (kg/m3) | (MPa) | (MPa) | (°) | |
Gravity wharf structure | 2000 | 166.7 | 76.92 | 45 | 100 |
Backfill prism | 1800 | 16.67 | 7.692 | 45 | 20 |
Riprap foundation bed | 1800 | 16.67 | 7.692 | 45 | 20 |
Soft-soil foundation | 1600 | 2.8 | 0.933 | 25 | 4.8 |
2.1.2. Selection of the computational domain and boundary conditions
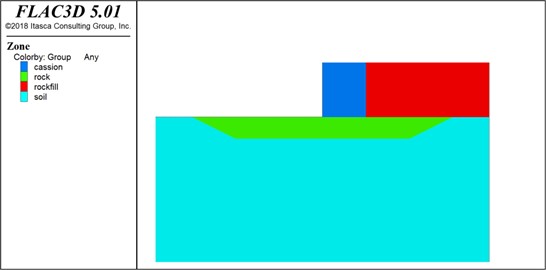
A cross-sectional diagram of the structure model is shown in Fig. 1. Contact points were set in the contact area between the structure and soil. Considering that the elastic modulus of the structure was significantly larger than that of the soil, the contact surface on the structure was designated as the primary contact surface, and that on the soil was the secondary contact surface. The constitutive relationship between the structure and soil was described by a Mohr-Coulomb ideal elastic-plastic model using eight-node three-dimensional reduced integral solid elements. To eliminate the influence of boundary conditions on the results, the surface of the foundation was assigned a free boundary, the bottom of the model was assigned a fixed boundary, the front and rear sides of the model were assigned limited boundaries, and the left and right sides of the model were assigned symmetrical boundaries.
Fig. 1Model wharf structural section
2.1.3. Soil constitutive model and material parameters
The riprap foundation bed material can be considered a homogeneous continuous medium that can only withstand compressive stress; therefore, the constitutive relationship of the soil was simplified to a linear elastic model. The model parameters included an axial stiffness of 1.5×10⁷ kN/m, stiffness of 3.125×10⁵ kN/m, and Poisson’s ratio of 0.15. When the shear stress in any plane of the soil reached the soil shear strength, the foundation was considered to be destroyed.
To ensure fast calculation convergence, the elastic modulus of the gravity structure was set to 10 times that of the riprap backfill. Owing to the bite force between the riprap backfill, the adhesive force was set to 20 kPa. The friction between the gravity structure and riprap backfill was simulated using the built-in interface function, and the maximum shear stress was calculated as:
where is the cohesion along the interface, is the interface contact area, is the interface friction angle, is the pore water pressure, and is the positive interface stress.
Owing to the absence of cohesion between the riprap foundation bed and the gravity structure, was set to 0. For the interface angle between the gravity structure and riprap backfill, the friction coefficient was set to 0.5, with 27°. For the interface function, and were considered 10 times the maximum modulus of the adjacent grid stiffness. The wavelength was determined to be 56.2 m using the following equation:
where is the gravitational acceleration, is the average period, and is the water depth.
The geology of the soil layers was simulated as presented in Table 2 from top to bottom in the model, while the mechanical parameters of the soil body are based on the soft soil tests described in Section 2.2.
Table 2Properties of the soil layers.
Material | Rear load (kN/m) | Dry density (kN/m3) | Saturation (kN/m3) | Compression modulus (kN/m2) | Poisson’s ratio | (kN/m2) | Initial (°) |
Riprap | 160 | 18 | 18.0 | 20,000 | 0.3 | 0 | 45 |
Clay 1 | 160 | 11 | 17.4 | 2520 | 0.35 | 12 | 15.5 |
Clay 2 | 160 | 11 | 16.4 | 3120 | 0.35 | 11 | 13.0 |
Sandy soil 1 | 160 | 11 | 19.6 | 8470 | 0.3 | 13 | 28.9 |
Sandy soil 2 | 160 | 17 | 20.0 | 12,000 | 0.3 | 22 | 28.0 |
2.1.4. Stress application
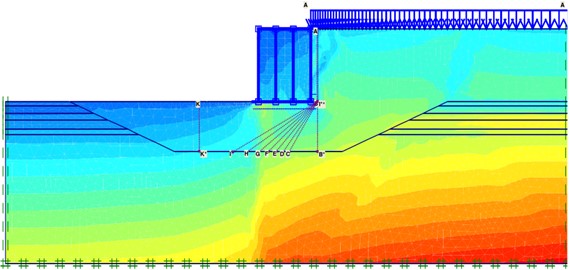
The equivalent load method was used to convert the dynamic pressure generated by waves into an equivalent static load, that is, the maximum pressure on the soil surface under wave action was calculated as the static load applied to the nodes on the soil surface of the model structure. Considering the effect of peak waves, wave forces are applied to the vertical walls and bottom of gravity structures using the method specified in the JTS 145-2015 Port and Waterway Hydrological Code [26]. The periodicity of waves was simulated by changing the load over time, and the cyclic weakening law of soft-soil strength with wave cyclic loads was simulated by changing the internal friction angle. The unit grid diagram of the model is shown in Fig. 2, and the pressure distribution diagram is shown in Fig. 3.
Fig. 2Unit grid diagram
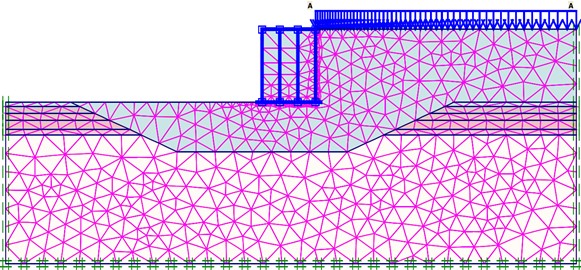
Fig. 3Stress distribution map
2.2. Soft-soil tests
Tianjin coastal clay was selected for the experiment, and the soil samples collected on site were air dried, crushed, and sieved. The physical and mechanical parameters of the test soil were test-determined, as listed in Table 3, revealing high moisture content, large porosity, high viscosity, and low shear strength index.
Table 3Physical and mechanical characteristics of the soft soil samples
Physical properties | Water content limits | Compressibility | Shear test results | |||||||||||
LL | PL | PI | LI | Em. | ||||||||||
% | – | g/cm3 | % | – | % | % | – | – | MPa–1 | MPa | – | kPa | ° | |
19.3 | 2.74 | 2.00 | 1.68 | 83.4 | 0.63 | 35.2 | 18.8 | 16.4 | 0.03 | 0.39 | 4.21 | q | 40.5 | 9.9 |
25.5 | 2.71 | 1.87 | 1.49 | 84.4 | 0.82 | 27.4 | 16.5 | 10.9 | 0.83 | 0.28 | 6.43 | q | 24.9 | 29.2 |
Note: denotes the water content, denotes the specific gravity, is the wet soil density, is the dry soil density, is the degree of saturation, is the void ratio, LL is the liquid limit, PL is the plastic limit, PI is the plasticity index, LI is the liquidity index, is the compression index, is the compression modulus, Em. indicates the empirical method, is the cohesion, is the friction angle. | ||||||||||||||
Fig. 4GDS dynamic triaxial shear tester: 1 – pressure chamber; 2.1 – load sensor; 2.2 – pore pressure sensor; 2.3 – displacement sensor; 3.1 – axial pressure controller; 3.2 – confining pressure controller; 3.3 – back pressure controller; 4 – top cap of the sample; 5 – base of the sample
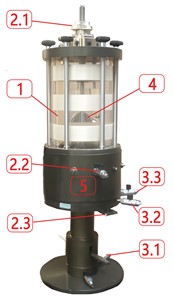
The GDS dynamic triaxial shear apparatus shown in Fig. 4 was used for consolidated undrained triaxial testing according to the IOS (17892-9) specification [27]. The equipment essentially comprised a pressure chamber, pressurization system, and measurement and acquisition system. Three sets of pressurization systems were used to provide the confining pressure, axial force, and back pressure. The measurement and acquisition system included various sensors such as load, pore water pressure, and displacement sensors. The sensors for the triaxial shear test were installed on the confining pressure system, axial loading system, and shear box. In the dynamic triaxial test, vibration sensors and accelerometers were installed on the soil sample. The data acquisition board and converter were used in the GDSLAB module software for data acquisition and experimental control, and all measurement data were collected by a computer. Through the collaborative operation of these measuring devices and systems, the GDS dynamic triaxial shear apparatus could provide important mechanical parameters such as stress-strain relationship, shear strength, damping ratio, and shear modulus of soil under dynamic loads.
2.2.1. Triaxial shear tests
The experimental process comprised five steps: sample loading, back pressure saturation, B-value detection, consolidation, and shearing. Step 1: The undisturbed soil was pushed out of the thin-walled sampling cylinder and cut into four cylindrical specimens (numbered S1-S4) with a diameter of 75 mm and height of 150 mm. Step 2: Each sample was vacuum saturated and then loaded into the GDS dynamic triaxial shear apparatus for back pressure saturation. Step 3: After 24 h of saturation, B detection was used to check the saturation degree of the soil sample. If the pore pressure coefficient B value of the test was larger than 0.98, the soil sample was considered to have reached the saturation requirement. Step 4: Initial consolidation pressures of 100, 200, 300, and 400 kPa were applied to the soil sample for isobaric consolidation. When the pore water pressure dissipated to equal the back pressure, the soil sample was considered to have completed consolidation. Step 5: Undrained shear tests were conducted using strain control. The experimental plan and sample information are shown in Table 4.
Table 4Experimental plan and sample information
No. | (mm) | (mm) | (kPa) | (g) | (g) | (kg/cm3) | (%) | OCR | (kPa) |
S1 | 79.00 | 39.80 | 100 | 193.17 | 144.80 | 1.47 | 24.80 | 1 | 100 |
S2 | 79.00 | 39.78 | 200 | 190.06 | 147.21 | 1.50 | 22.7 | 1 | 200 |
S3 | 81.50 | 39.89 | 300 | 196.97 | 156.75 | 1.54 | 19.70 | 1 | 300 |
S4 | 81.60 | 40.18 | 400 | 196.07 | 159.93 | 1.55 | 18.41 | 1 | 400 |
Note: “No.” denotes the sample number, denotes the initial height, denotes the initial diameter, denotes the initial consolidation pressure, denotes the initial specimen weight, denotes the dry weight, denotes the dry density, denotes the moisture content, OCR is the over consolidation ratio, and is the confining pressure | |||||||||
2.2.2. Dynamic triaxial tests
To study the influence of post-consolidation structure on the dynamic characteristics of soft clay, saturated triaxial specimens were used and subjected to graded isotropic consolidation loading with consolidation stresses of 100, 200, and 300 kPa. Unidirectional excitation was performed 3 times at each consolidation stress level with vibration amplitudes of 0.005, 0.01, 0.02, 0.04, 0.08, 0.16, 0.32, and 0.64 mm, with a total of 24 excitation times. To reduce disturbance errors and ensure the relative continuity of test data, the number of test vibrations was set to five weeks for each vibration amplitude of consolidation stress at each level. The experiment adopted a stress-controlled loading method for cyclic loading, and the loading waveform was generated by the servo system. The waveform was a sine wave with a frequency of 1 Hz. During the loading process, data such as loading frequency, consolidation pressure, pore pressure, and axial deformation were collected and processed by the computer, thus resulting in a total of 3000 sets of unidirectional excitation cyclic load test results.
The results were fitted using the Janbus equation, which is typically applied to determine the relationship between and as follows:
where is the maximum shear modulus, is the material constant, is the atmospheric pressure, is the consolidation stress, and is the modulus.
The shear modulus under each consolidation stress was divided by the corresponding maximum shear modulus and normalized using the Hardin-Drnevich equation as follows:
where is the shear strain and is the reference shear strain.
The Van Genuchten soil-water characteristic curve equation for moisture and matric suction in unsaturated soil mechanics is highly flexible in fitting data and is expressed by:
where is the relative moisture content; is the matric suction; and , , and are fitting parameters.
When the Van Genuchten equation is used to describe the relationship between shear modulus and shear strain, it can be simplified by setting 1. Thus, the simplified relationship between and is given by:
3. Results
3.1. Experimental results
3.1.1. Triaxial shear test
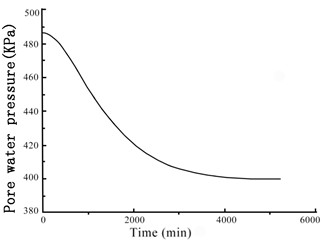
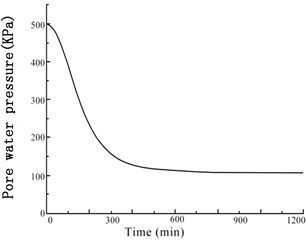
The GDS moving triaxial cyclic shear system measured and recorded the changes in each data point over time. Figs. 5 and 6 present the variations in soil sample pore pressure and soil sample volume over time under cyclic loading, respectively. The pore pressure and deformation of the soft soil clearly decreased rapidly in the early period before stabilizing.
Fig. 5Variation of the soil sample pore pressure over time under confining pressures
a) 100 kPa
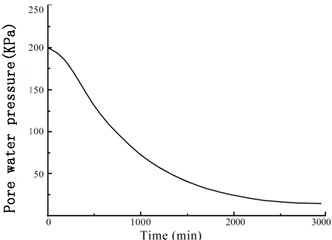
b) 200 kPa

c) 300 kPa
d) 400 kPa
Fig. 6Variation of the soil sample volume over time under confining pressures
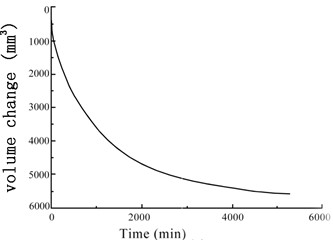
a) 100 kPa
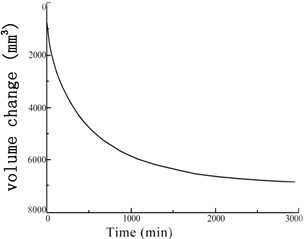
b) 200 kPa
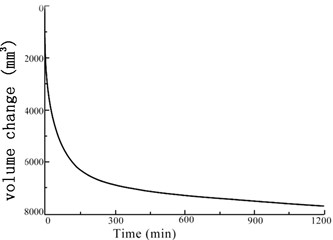
c) 300 kPa
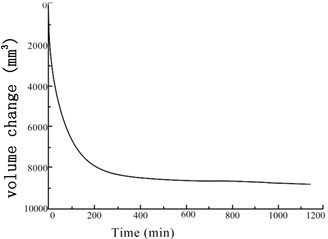
d) 400 kPa
The principal stress difference and principal stress ratio in each sample are depicted according to the axial strain in Figs. 7 and 8, respectively. The stress-strain relationships exhibit similar characteristics and patterns of change regardless of the applied confining pressure. Thus, the confining pressure has little influence on the stress-strain relationship. The soil compression curve shows strain reinforcement, exhibiting no softening phenomenon; therefore, the peak occurring when the axial strain reaches 15 % was considered the damage point. Under small axial strains, the principal stress difference and principal stress ratio of the soil samples increased rapidly with increasing strain, particularly when at a confining pressure of 400 kPa. This tendency may be due to the relatively large pores of soft soil, which facilitates extensive compression of the pore volume but does not fundamentally change the microstructure of the soil; thus, the shear strength remains low. High axial strain not only compresses the pore volume but also changes the microstructure of the soil by arranging more closely the soil particles, hardening the soil skeleton. Thus, the ability of the soil to resist external deformation is significantly improved, and the shear strength is enhanced.
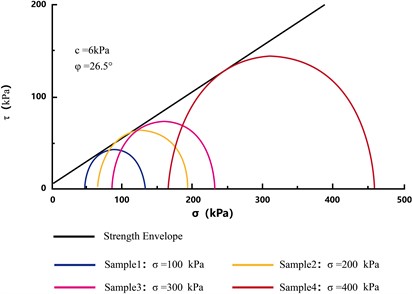
Fig. 9 shows the effective stress paths of the soft soil specimens. The higher the confining pressure, the higher the slope of the stress path and the more evident its change. The four test soil specimens reached a critical state during the shear process, thus exhibiting unique critical state lines. Fig. 10 depicts the consolidated undrained strength envelopes of the soil specimens. As the accumulation of pore water pressure with increasing confining pressure reduced the effective stress, the Moore circle moved to the right along the transverse axis. Soil shear damage was considered to occur when the strength envelope was tangential to the Moore circle. Thus, the effective cohesion was 6 kPa, and the effective internal friction angle was 26.5°.
Fig. 7Principal stress difference vs. axial strain curves
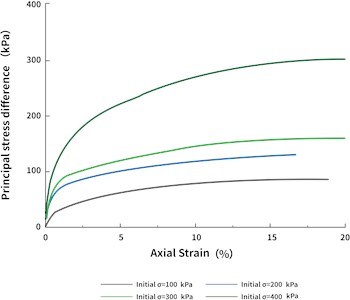
Fig. 8Principal stress ratio vs. axial strain curves
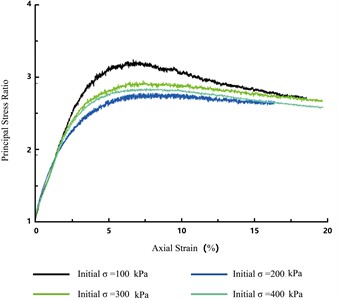
Fig. 9Effective stress paths
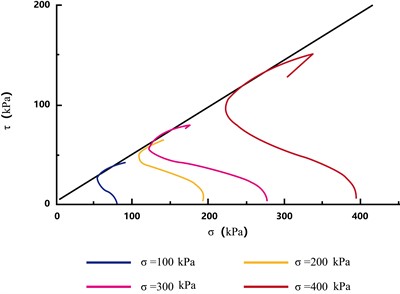
Fig. 10Consolidated undrained strength envelopes of the soft soil specimens
3.1.2. Vibration test
During each stage of vibration, the changes in the axial displacement, axial force, and pore pressure were measured to analyze the damping ratio and modulus of the soil. The trends in the vibration curves for each evaluated excitation were similar. Therefore, the results obtained under an isotropic consolidation stress of 300 kPa and vibration amplitude of 0.005 mm (as shown in Fig. 11) were considered examples for this discussion. The changes in the axial displacement, axial force, and pore pressure vibration curves were similar, following a trend of increasing to a peak before decreasing to a trough with the progression in the applied vibration cycle. All variables exhibited ideal sine wave changes that met the conditions of elastic vibration. However, a slight pore pressure oscillation and growth phenomenon occurred during the excitation process.
The variation in the shear modulus with shear strain under different consolidation stresses is presented in Fig. 12. For each level of consolidation pressure, the shear modulus decreased with increasing shear; the shear modulus under a high consolidation stress was consistently higher than that under a low consolidation stress. By using the Janbus equation to fit the relationship between the maximum shear modulus and consolidation stress , the values 7.414 and 74.764 were obtained, as shown in Fig. 13. Fig. 14 depicts the vibration damping ratios according to shear strain under different consolidation stresses. Regardless of the consolidation stress, the damping coefficients were relatively close and increased with increasing shear strain.
Fig. 11Variations in a) axial displacement, b) axial force, and c) pore pressure during the 0.005 mm amplitude vibration test at an isotropic consolidation stress of 300 kPa
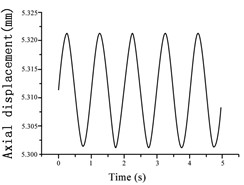
a)
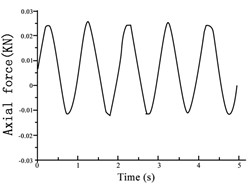
b)
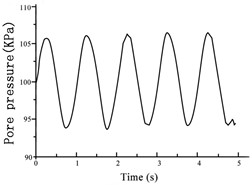
c)
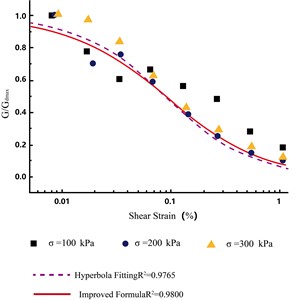
Using the Hardin-Drnevich equation for normalization, the fitting coefficient was determined as 0.9765 for 0.091, indicating an acceptable degree of fit, as shown in Fig. 6(d). Finally, using the improved Van Genuchten equation for nonlinear fitting, was determined as 0.9800 for 0.087 and 1.12, indicating a better fit, as illustrated in Fig. 15.
Fig. 12Variations in the shear modulus with shear strain at different consolidation stresses
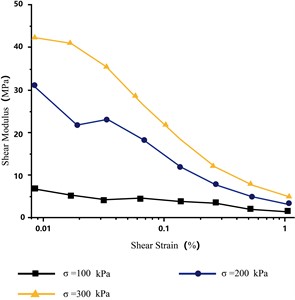
Fig. 13Relationship between maximum shear modulus and consolidation stress
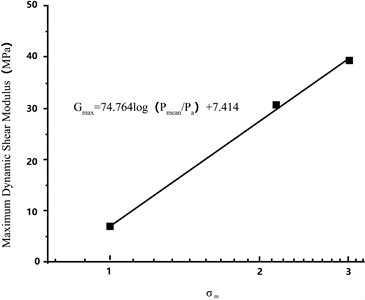
Fig. 14Vibration damping ratios according to shear strain at different consolidation stresses
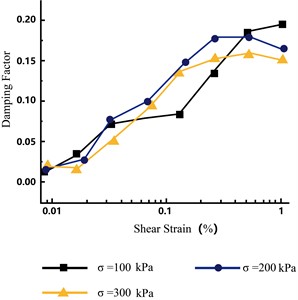
Fig. 15Shear modulus varies with damping ratio at different consolidation stresses
3.2. Numerical analysis results
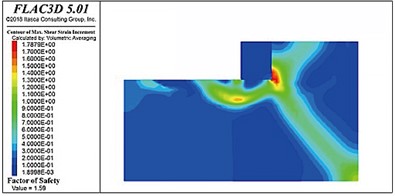
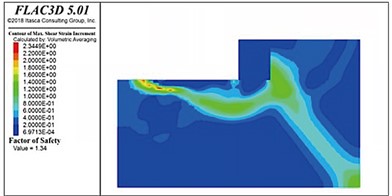
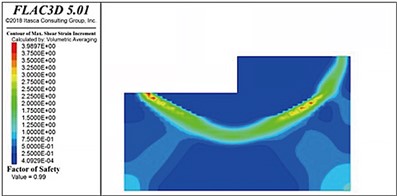
Fig. 16 shows the distribution of the slip surfaces in soft-soil foundations with internal friction angles of 25°, 20°, 15°, and 10°. A potential circular sliding failure surface can be observed inside the riprap foundation bed in each case. When the internal friction angle was higher than 15°, this sliding surface gradually extended horizontally forward after passing through the rear toe of the pier, returned upward a certain distance, thereafter, passed through the front toe of the pier, and finally intersected with the top surface of the foundation bed. When the internal friction angle was 15° or less, the sliding surface tended to move backward behind the backfill. When the internal friction angle was 10°, the sliding surface did not pass through the posterior toe but ran below it to the front of the gravity structure. Notably, as the strength of the foundation soil decreased, the sliding surface below the gravity structure tended to grow.
Fig. 16Sliding surface distributions in the soft soil foundations with internal friction angles
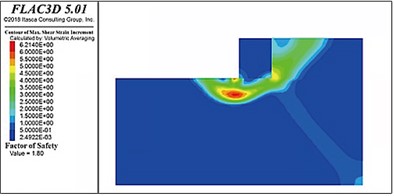
a) 25°
b) 20°
c) 15°
d) 10°
The stability coefficients of the gravity wharf in soft soil with an internal friction angle of 25°, 20°, 15°, and 10° were determined to be 1.80, 1.59, 1.34, and 0.96, respectively. Thus, as the soft soil foundation strength decreased with the internal friction angle, the stability of the pier decreased nonlinearly.
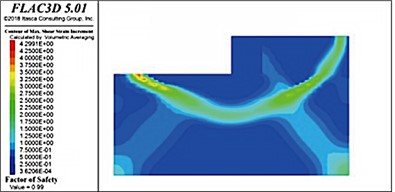
When the internal friction angle of the soft soil foundation was 10° and the thickness of the riprap bed was 3 m, the stability coefficient was only 0.96, which did not satisfy the requirements of the design specifications (a value of unity). The thickness of the riprap bed was successively increased to 4, 5, 6, and 7 m (as shown in Fig. 17); however, the stability coefficient reached only 0.99, which was still less than unity. Therefore, the bearing capacity of the foundation was considered insufficient, indicating that the structure was unstable and damaged. Notably, the sliding surfaces in soft-soil foundations with riprap beds of different thicknesses were located directly below the front of the wharf. Measured from the bottom of the wharf, the average depth of the sliding surface was consistently 16-18 m.
3.3. Validation of the numerical model
To ensure that the established FLAC3D finite element mathematical model accurately reflects the actual engineering conditions, a gravity wharf project located in the southern coastal area of Fujian Province has been selected as a validation case[31]. By simulating the deformation of the riprap base and the soil foundation, simulated data were obtained and compared with the observational data of the engineering structure for verification. The compression test of the block stone was simulated, and the model consisted of five parts: the material cylinder, the pressure block, the block stone layer, the equivalent embedded layer, and the foundation layer, with each part corresponding to the dimensions of the physical test. Graded loads were applied to the upper surface of the pressure block, and the vertical displacement of the upper surface was monitored, with the results shown in Table 5. As indicated by Table 5, the difference between the model simulation results and the physical test results is within 1.8 % to 2.3 %, demonstrating good consistency between the two.
Fig. 17Sliding surface distributions in soft soil foundations with riprap bed thicknesses
a) 4 m
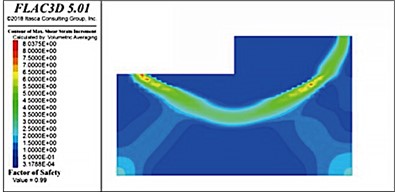
b) 5 m
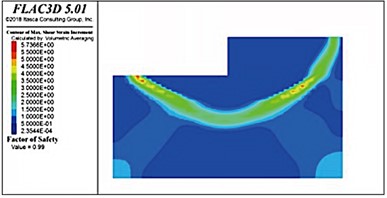
c) 6 m
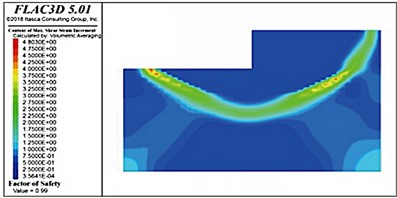
d) 7 m
Table 5Load-displacement table for block stone-riprap bed composite compression test and numerical simulation
Load level | Origin | Level 1 | Level 2 | Level 3 | Level 4 | Level 5 | Level 6 |
Load (kPa) | 0 | 218.58 | 299.53 | 328.68 | 456.59 | 555.35 | 665.45 |
Test displacement (mm) | 0 | 87 | 90 | 91 | 101 | 107 | 111 |
Simulated displacement (mm) | 0 | 85 | 88 | 90 | 103 | 109 | 113 |
Observation points for settlement at the pier are set up to record the settlement amounts. A polynomial fitting method is used to process large amounts of observation data, and accuracy analysis is performed on the settlement data. The measured data for settlement displacement is shown in Table 6. The polynomial model used during the fitting process is:
Table 6Settlement displacement measurement data table
Time (d) | 0 | 18 | 72 | 92 | 148 | 176 | 181 | 191 | 196 |
Settlement amount (mm) | 0 | 32 | 42 | 74 | 104 | 142 | 144 | 159 | 163 |
Time (d) | 209 | 224 | 237 | 255 | 270 | 297 | 326 | 381 | 402 |
Settlement amount (mm) | 180 | 186 | 193 | 199 | 205 | 210 | 222 | 245 | 245 |
Using MATLAB, perform a cubic polynomial fitting on the settlement data in the table to obtain the following equation:
Among them, the degree of freedom is 17, and the standard deviation is 29.0136. Therefore, the actual maximum settlement of the structure is 245 mm, while the structural settlement obtained through simulation is 238 mm, with only a difference of 3 %. This indicates that the simulation results are well matched with the experimental results, further verifying the effectiveness and accuracy of the FLAC3D finite element simulation method in predicting and analyzing complex engineering problems.
4. Discussion
4.1. Soil behavior in indoor tests under cyclic loading
The cyclic triaxial test method used in this study was the same as that employed in previous studies [28]. The results of these tests revealed that the two primary factors affecting the soil stress–strain behavior were the applied cyclic load and microstructural changes; this finding is consistent with the results reported by Baki et al. [29] and Sağlam and Bakir [30]. The change in the pore water pressure in saturated soft soil was found to play a critical role in characterizing the cyclic stress–strain behavior; this result is consistent with those of previous studies on the long-term cyclic stability of soft soil using elastic–plastic modeling [31]-[33]. Furthermore, the effective stress path of the consolidated undrained triaxial shear test was consistent with the simulation results of Zhu et al. [1] and ended at the critical state line. The maximum shear modulus of the soil was related to its effective consolidation pressure, and the relationship between the two was effectively expressed using the Janbus equation. Additionally, the shear modulus of the soil decreased with increasing shear strain and was accurately fitted by the Van Genuchten hyperbola. Previous tests indicated that for a given initial consolidation pressure, the stress and strength corresponding to soil failure decreased with increasing cycle number or strain [34], which should be considered during the safety assessments of wharf structures.
4.2. Factors influencing the stability of wharf structures under wave loading
Under wave loading, a relatively large friction angle in the soft-soil foundation caused the sliding surface to extend gradually forward and backward horizontally through the back toe of the wharf, run through the entire foundation, return upward beyond the front toe for a certain distance, and finally intersect with the top surface of the riprap bed. When the internal friction angle was relatively small, the sliding surface tended to move back behind the backfill edge. As the internal friction angle continued to decrease, the sliding surface inside the rear edge moved far from the rear toe, stretching from below the rear toe to the front of the gravity structure. In engineering practice, when the internal friction angle is less than 10°, the safety factor of the foundation bearing capacity is less than unity, and the structure is damaged. Thus, the experimental results clearly confirmed that the internal friction angle exerts a significant influence on the stability of a gravity wharf, as has been previously reported [35].
As the strength of the foundation soil decreased, the sliding surface under the wharf structure tended to elongate because when the local foundation strength was excessively low, the riprap bed could not provide stability and gradually exhibited a sliding surface within. Researchers have shown that the depth of the sliding surface is influenced by the height of the structure as well as the equivalent width, rear load, and type of foundation and backfill [15]. Typically, the thickness of the riprap bed is increased to satisfy the bearing capacity of the foundation soil. However, when the bearing capacity of the soft-soil foundation is sufficiently small, the sliding surface will be located below the riprap layer and will not pass through the back toe of the gravity structure. Thus, simply increasing the thickness of the riprap layer can only improve the overall stability to a limited extent and should be carefully considered during the design and construction of gravity wharf foundation beds.
5. Conclusions
The creep deformation and softening of soft-soil foundations under long-term wave loads can readily lead to problems in gravity wharves such as excessive settlement, displacement, and sliding, compromising the safety of the wharf structure. In this study, we conducted mechanical index tests on consolidated and undrained soft-soil specimens as well as vibration tests to analyze the change in the soil dynamic characteristics with strain under different confining pressures. A finite element model of the wave-gravity-structure-soft-soil-foundation system was subsequently established by applying the dynamic deformation and strength characteristics of the soft soil obtained from triaxial tests. The model was analyzed by varying the friction angle to simulate the change in soft soil strength as the number of wave cycles increased. The results were evaluated to investigate the failure mechanism of the foundation and the bearing characteristics of the riprap bed atop the soft soil. The conclusions are as follows.
1) The accumulation of pore water pressure reduced the effective stress. The changes in axial displacement, axial force, and pore pressure followed ideal sine waveforms when the soil specimens were subjected to cyclic vibration. The variation in the pore pressure and volume of the soil decreased with time, the shear modulus decreased with increasing cycles, and the damping coefficient increased with increasing shear strain.
2) The stability of the soft soil foundation decreased nonlinearly as the internal friction angle decreased. Typically, the thickness of the riprap bed can be increased to improve the overall stability; however, in engineering practice, when the internal friction angle of the soft soil is less than 10°, the safety factor of the foundation bearing capacity is less than unity, and structural instability and the structure is damaged. Furthermore, the sliding surface is not affected by the thickness of the riprap layer, and other measures should be taken to improve the bearing capacity of the soft soil accordingly.
3) As the strength of the soil foundation decreased, the potential sliding surface became more evident, and the most unfavorable damage surface moved closer to the riprap bed. In engineering practice, when the internal friction angle of the soil foundation is less than 10°, the sliding surface will be located below the riprap bed and will not pass through the posterior toe of the gravity structure.
4) The experiment used the undisturbed soil sample after saturation treatment as the sample, to calculate and analyze the soil according to the theory of saturated soil. However, with the sample treated in this manner, it was difficult to accurately reflect the actual state of the project. However, for actual unsaturated soil samples, both experimental techniques and theoretical analysis are still in the exploratory stage. Therefore, conducting research on actual clay replication technology in the laboratory, improving soil testing methods, exploring indoor soil testing results, and successfully applying them to practical engineering are important directions for future research.
5) The wave loads were simplified as sine wave cyclic loads with the same period and equal amplitude, whereas in reality, the period and amplitude of wave loads vary randomly with time and distance from the coast, which makes the cyclic loads irregular. The analysis of foundation stability under irregular random wave loads is an important topic for future research.
6) Thus far, owing to limitations in conditions, experimental results have been obtained only through 3D numerical simulation technology, which has accumulated necessary data for further physical prototype experiments. However, physical prototype experiments that are closer to engineering reality have not been performed, and further research in this area is needed in the future.
References
-
C. Zhu, L. Zhang, C. Liao, X. Wei, and G. Ye, “Estimation of horizontal bearing capacity of mat foundation on structured and over-consolidated clays under cyclic wave loads,” Soil Dynamics and Earthquake Engineering, Vol. 161, p. 107426, Oct. 2022, https://doi.org/10.1016/j.soildyn.2022.107426
-
W. Chen, Z. Wang, S. Chen, J. Ma, and Y. Liang, “Frequency response analysis of concrete seawall including soil-structure-seawater interaction,” Soil Dynamics and Earthquake Engineering, Vol. 139, p. 106392, Dec. 2020, https://doi.org/10.1016/j.soildyn.2020.106392
-
T. Zhang, T. Li, and S. Feng, “Elastoplastic modelling for long-term cyclic stability of soft clays with consideration of structure damage,” Soil Dynamics and Earthquake Engineering, Vol. 166, p. 107727, Mar. 2023, https://doi.org/10.1016/j.soildyn.2022.107727
-
K. He, T. Huang, and J. Ye, “Stability analysis of a composite breakwater at Yantai port, China: An application of FSSI-CAS-2D,” Ocean Engineering, Vol. 168, pp. 95–107, Nov. 2018, https://doi.org/10.1016/j.oceaneng.2018.09.004
-
Y.-Y. Ko, H.-H. Yang, C.-W. Hu, Y.-J. Huang, and Y.-Y. Lin, “Numerical seismic performance assessment and fragility analysis for gravity-type wharves considering the influence of soil liquefaction,” Soil Dynamics and Earthquake Engineering, Vol. 180, p. 108581, May 2024, https://doi.org/10.1016/j.soildyn.2024.108581
-
C.-C. Tsai, Y.-P. Li, and S.-H. Lin, “p-y based approach to predicting the response of monopile embedded in soft clay under long-term cyclic loading,” Ocean Engineering, Vol. 275, p. 114144, May 2023, https://doi.org/10.1016/j.oceaneng.2023.114144
-
H. Lei, Y. Xu, M. Jiang, and Y. Jiang, “Deformation and fabric of soft marine clay at various cyclic load stages,” Ocean Engineering, Vol. 195, p. 106757, Jan. 2020, https://doi.org/10.1016/j.oceaneng.2019.106757
-
X. Cheng, Y. Li, P. Wang, Z. Liu, and Y. Zhou, “Model tests and finite element analysis for vertically loaded anchors subjected to cyclic loads in soft clays,” Computers and Geotechnics, Vol. 119, p. 103317, Mar. 2020, https://doi.org/10.1016/j.compgeo.2019.103317
-
D. R. Panique Lazcano, R. Galindo Aires, and H. Patiño Nieto, “Bearing capacity of shallow foundation under cyclic load on cohesive soil,” Computers and Geotechnics, Vol. 123, p. 103556, Jul. 2020, https://doi.org/10.1016/j.compgeo.2020.103556
-
X. Chen et al., “Evolution process and hardening mechanism of consolidated silt in silty seabed subject to waves,” Applied Ocean Research, Vol. 125, p. 103214, Aug. 2022, https://doi.org/10.1016/j.apor.2022.103214
-
P. Ji, “Study of marine soft soil reinforcement and its dynamic shear modulus in Zhoushan area,” (in Chinese), Zhejiang Ocean University, 2023.
-
X.-Q. Gu, W.-Q. Liu, X.-Y. Chen, Y.-F. Lin, J.-D. Xiao, and C.-H. Wu, “Experimental study on HSS model parameters for marine soft soils in Yangjiang, Guangdong Province,” (in Chinese), Chinese Journal of Geotechnical Engineering, Vol. 43, No. 2, Nov. 2021, https://doi.org/10.11779/cjge2021s2010
-
J. Huang and G. Chen, “Experimental modeling of wave load on a pile-supported wharf with pile breakwater,” Ocean Engineering, Vol. 201, p. 107149, Apr. 2020, https://doi.org/10.1016/j.oceaneng.2020.107149
-
B. Song et al., “Post-liquefaction re-compaction effect on the cyclic behavior of natural marine silty soil in the Yellow River delta,” Ocean Engineering, Vol. 195, p. 106753, Jan. 2020, https://doi.org/10.1016/j.oceaneng.2019.106753
-
V. Chávez, E. Mendoza, R. Silva, A. Silva, and M. A. Losada, “An experimental method to verify the failure of coastal structures by wave induced liquefaction of clayey soils,” Coastal Engineering, Vol. 123, pp. 1–10, May 2017, https://doi.org/10.1016/j.coastaleng.2017.02.002
-
L. Cui, D.-S. Jeng, and J. Liu, “Seabed foundation stability around offshore detached breakwaters,” Applied Ocean Research, Vol. 111, p. 102672, Jun. 2021, https://doi.org/10.1016/j.apor.2021.102672
-
W. Yao and Y. Shi, “Dynamic stability analysis of pile groups under wave load,” Applied Mathematical Modelling, Vol. 110, pp. 367–386, Oct. 2022, https://doi.org/10.1016/j.apm.2022.06.003
-
G. S. P. Madabhushi, J. I. Boksmati, and S. G. Torres, “Modelling the behaviour of large gravity wharf structure under the effects of earthquake-induced liquefaction,” Coastal Engineering, Vol. 147, pp. 107–114, May 2019, https://doi.org/10.1016/j.coastaleng.2019.02.010
-
X. Zhang, S. Zhang, Z. Wang, and L. Zhang, “An investigation of seismic liquefaction damage and an anti-liquefaction technique for a gravity caisson wharf,” in IOP Conference Series: Earth and Environmental Science, Vol. 455, No. 1, p. 012051, Feb. 2020, https://doi.org/10.1088/1755-1315/455/1/012051
-
P. Dakoulas, P. Vazouras, P. Kallioglou, and G. Gazetas, “Effective-stress seismic analysis of a gravity multi-block quay wall,” Soil Dynamics and Earthquake Engineering, Vol. 115, pp. 378–393, Dec. 2018, https://doi.org/10.1016/j.soildyn.2018.08.032
-
C.-H. Shen, Z. Jiang, Y.-C. Shen, L.-S. Zhang, X.-F. Chen, and X.-Y. He, “Damage process on wharf structure under wave cyclic loading” (in Chinese), Port and Waterway Engineering, Vol. 551, Jan. 2019.
-
Y. Zheng and R. Zhang, “Experimental study on the damage characteristic and assessment of transverse bent frame of high-piled wharf under impact load,” Developments in the Built Environment, Vol. 14, p. 100124, Apr. 2023, https://doi.org/10.1016/j.dibe.2023.100124
-
B. Xiao, “CICTP 2020,” (in Chinese), 20th COTA International Conference of Transportation Professionals, Vol. 30, Dec. 2020, https://doi.org/10.1061/9780784483053
-
K.-W. Zhu and B. Xiao, “Research on influence of beam and pile damage to the natural frequency characteristics of high-piled wharf,” (in Chinese), Journal of Shaoguan University (Natural Science edition), Vol. 43, p. 2022, Sep. 2022.
-
Y. Ren, G. Xu, X. Xu, T. Zhao, and X. Wang, “The initial wave induced failure of silty seabed: Liquefaction or shear failure,” Ocean Engineering, Vol. 200, p. 106990, Mar. 2020, https://doi.org/10.1016/j.oceaneng.2020.106990
-
“Hydrological specifications for ports and waterways,” (in Chinese), JTS 145-2015, Ministry of Transport of the People’s Republic of China, 2015.
-
“Geotechnical investigation and testing laboratory testing of soil – Part 9: consolidated triaxial compression tests on water saturated soils,” ISO 17892-9, 2018.
-
Z. He, P. Wang, and Y. Liu, “Cumulative deformation prediction and microstructure change of coarse-grained soil under cyclic loading,” Soil Dynamics and Earthquake Engineering, Vol. 173, p. 108136, Oct. 2023, https://doi.org/10.1016/j.soildyn.2023.108136
-
M. A. L. Baki, M. M. Rahman, and S. R. Lo, “Predicting onset of cyclic instability of loose sand with fines using instability curves,” Soil Dynamics and Earthquake Engineering, Vol. 61-62, pp. 140–151, Jun. 2014, https://doi.org/10.1016/j.soildyn.2014.02.007
-
S. Sağlam and B. S. Bakır, “Cyclic response of saturated silts,” Soil Dynamics and Earthquake Engineering, Vol. 61-62, pp. 164–175, Jun. 2014, https://doi.org/10.1016/j.soildyn.2014.02.011
-
Z. Du, J. Qian, Z. Shi, Y. Guo, and M. Huang, “Constitutive modeling for cyclic responses of saturated soft clay under principal stress rotation induced by wave loads,” Ocean Engineering, Vol. 252, p. 111243, May 2022, https://doi.org/10.1016/j.oceaneng.2022.111243
-
Y. Cai, B. Hao, C. Gu, J. Wang, and L. Pan, “Effect of anisotropic consolidation stress paths on the undrained shear behavior of reconstituted Wenzhou clay,” Engineering Geology, Vol. 242, pp. 23–33, Aug. 2018, https://doi.org/10.1016/j.enggeo.2018.05.016
-
J.-F. Zhu, H. Zhao, Z.-Y. Luo, and H.-X. Liu, “Investigation of the mechanical behavior of soft clay under combined shield construction and ocean waves,” Ocean Engineering, Vol. 206, p. 107250, Jun. 2020, https://doi.org/10.1016/j.oceaneng.2020.107250
-
S. S. Kumar, A. M. Krishna, and A. Dey, “Dynamic properties and liquefaction behaviour of cohesive soil in northeast India under staged cyclic loading,” Journal of Rock Mechanics and Geotechnical Engineering, Vol. 10, No. 5, pp. 958–967, Oct. 2018, https://doi.org/10.1016/j.jrmge.2018.04.004
-
M. Souri, A. Khosravifar, S. Dickenson, N. Mccullough, and S. Schlechter, “Numerical modeling of a pile-supported wharf subjected to liquefaction-induced lateral ground deformations,” Computers and Geotechnics, Vol. 154, p. 105117, Feb. 2023, https://doi.org/10.1016/j.compgeo.2022.105117
About this article

This work was supported by the “Special Technical Services for Green Highway and Technology Innovation of Contract Section A4 of Fuzhou Airport Second Expressway” under Grant No. 4GS-FZJC-0618-2023-0006, the “Research and Application of Integrated Management Platform for Intelligent Construction of Prefabricated Girder Yards” under Grant No. 202224 and the Fujian Provincial Department of Finance (No. Z202211041). We would like to thank the Editage Group (https://app.editage.cn) for its linguistic assistance during the preparation of this manuscript.
The datasets generated during and/or analyzed during the current study are available from the corresponding author on reasonable request.
The authors declare that they have no conflict of interest.
