Abstract
Water energy is one of the potential renewable energy, the problem so far has a low efficiency of the blade Pelton shape. So it takes a series of tools to know characteristics and performance of the Pelton turbine as a hydroelectric power plant in this research. Pelton turbines work by utilizing the potential energy of water stored at a certain head, which flows through a penstock/pipe that is equipped with a nozzle at the end. The high head causes the water to be under high pressure when it reaches the nozzle. The water coming out of the nozzle becomes kinetic energy in the form of a pressurized water jet, which is used to rotate the runner of the Pelton turbine. In this study, the effect of the number of nozzles used to rotate the Pelton turbine was analyzed, with the result that the number of nozzles is directly proportional to the efficiency of the Pelton turbine. Where the highest efficiency value is obtained by using 3 nozzles with a maximum efficiency value of 13.7 %, at 2 nozzles of 12.209 % and at 1 nozzle of 8.82 %.
Highlights
- This research investigates the characteristics of Pelton turbines, particularly the effect of the number of nozzles on turbine performance.
- Comparing the characteristics of the number of nozzles on a Pelton turbine.
- Laboratory scale Pelton turbine simulator experiment showing experimental results and efficiency.
- Increase in the width of the separator by 1% of the inner bucket width results in a decrease in efficiency of approximately 1% at full load.
- In the design of the Pelton turbine blade, we adhere to strict sizing rules to ensure optimal performance.
- Preventive maintenance and timely replacement of worn components are key to maintaining the durability and efficiency of hydroelectric systems using Pelton turbine buckets.
1. Introduction
Many areas in Indonesia have the potential for renewable energy sources, one of which is water energy for hydroelectric power plants which are widely spread in areas where there is no PLN electricity but has river flow, the problem so far in the use of water energy is still low efficiency so that a series of tools are needed for blade trials to find out the characteristics [1, 2]. Because renewable energy is increasingly dominating the global stage in an effort to reduce dependence on fossil fuels. In this context, hydropower plays an important role as a clean and sustainable energy provider. In 2021, the contribution of hydropower generation reached 1330 gigawatts, and the expected growth of around 60 % by 2050 presents a challenge to continuously improve its technology and sustainability [3]. Although hydropower technology has reached a level of maturity, developments continue to improve flexibility, reliability, and reduce environmental impact. This includes the refinement of turbine technology, where research continues to optimize turbine performance and reduce environmental impact [4, 5].
In 1880, Lester A. Pelton introduced the Pelton turbine, an impulse turbine that uses the potential energy of water stored at a certain elevation. This energy is delivered through a water pipe or channel with a nozzle at the end. The significant head creates high water pressure as it reaches the nozzle, turning the water into a high-speed kinetic jet. This water jet is then used to rotate the runner of the Pelton turbine [6].
In Europe, about 16 % of the installed hydropower capacity uses Pelton turbines. In European hydropower plants with a capacity of more than 50 MW, about 31 % use Pelton turbines. These turbines are preferred in mountainous areas because they can operate efficiently at high heads and lower water flows compared to Kaplan and Francis turbines. Nozzle control regulates the water flow and keeps the efficiency above 90 % even with varying turbine loads [8, 9].
Pelton turbines have two configurations: horizontal axis and vertical axis. In the horizontal axis configuration, no more than two nozzles can be installed, while in the vertical axis configuration, up to six nozzles can be installed symmetrically around the wheel. The choice of configuration affects the load distribution of the turbine and requires careful consideration to avoid collisions between the two water jets, thereby minimizing power loss. In addition, the configuration of the turbine axis also affects the friction losses and the windage [10, 11].
This research investigates the characteristics of Pelton turbines, particularly the effect of the number of nozzles on turbine performance. The research also examines the effect of water pressure on turbine efficiency and output. The next section details the methods used, including turbine design parameters and equations to calculate the performance metrics of various turbines. The results and analysis of the turbine tests, considering variations in nozzle number and water pressure, are then presented and discussed. The conclusion summarizes the key findings, emphasizing the importance of nozzle number and water pressure in optimizing the efficiency and power of Pelton turbines. Finally, references are provided for additional context and credibility.
Fig. 1Turbines with more than 50 MW capacity worldwide [7]
![Turbines with more than 50 MW capacity worldwide [7]](https://static-01.extrica.com/articles/23966/23966-img1.jpg)
2. Method
In this study, a careful analytical approach is taken to reveal the characteristics of the Pelton turbine and the effect of the number of nozzles on its performance. By detailing the design parameters of the turbine, such as spray diameter, nozzle length, nozzle needle angle, and others, we conducted a series of tests with variations in the number of nozzles. In the design of the Pelton turbine blade, we adhere to strict sizing rules to ensure optimal performance. In addition, this study applies an empirical approach to the number of buckets and provides a careful calculation, which is 17. This approach allows in-depth analysis of the torque moment, fluid flow velocity, and turbine power. In evaluating the turbine efficiency, we calculated the turbine head () value as the ratio of the height between the fluid inlet and the turbine position. Throughout the experimental process, variations in the number of nozzles and water pressure were considered to study their effects on the performance of the Pelton turbine. With this approach, our research approaches a thorough analysis of Pelton turbines, bringing a deeper understanding of how to optimize turbine efficiency and performance in the context of renewable energy.
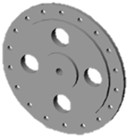
From the turbine picture above, we can see that is the diameter of the turbine runner as a place to install the bucket. While here describes the number of buckets and also the number of nozzles. For and are the diameter of the nozzle and the diameter of the water jet. While is the width of the bucket to receive water pressure from the nozzle to rotate the runner.
Fig. 2Pelton turbine [12, 13]
![Pelton turbine [12, 13]](https://static-01.extrica.com/articles/23966/23966-img2.jpg)
![Pelton turbine [12, 13]](https://static-01.extrica.com/articles/23966/23966-img3.jpg)
2.1. Pelton turbine design steps
The following is the design procedure of Pelton turbine for micro hydro power generation.
Preliminary preparation for turbine location.
1) Head calculation ():
where: – Gross Head which is the vertical distance between the water surface at the intake and at the turbine. While – total head loss due to open channels, trash racks, intakes, penstocks, and gates or valves. This loss is approximately equal to 6 % of the Gross Head.
2) Water flow rate calculation ().
The water flow rate can be calculated by measuring the velocity of the river or stream () in (m·s-1) and its cross-sectional area in (m2):
3) Turbine input power calculation ():
where is the density of the flowing fluid, is gravity speed, is the coefficient of performance or efficiency of the turbine, is the value of the head turbin dan is fluid flow rate.
4) Turbine rotational speed calculation ():
where is the number of turbine nozzles, and can be calculated as follows:
where is water flow capacity of each nozzle (m3·s-1).
Then for the calculation of turbine rotational speed (rpm) can be calculated by:
From the continuity equation:
where is the diameter of the jet spray as the release of pressurized water flow to hit the turbine blades, is the number of nozzles and in this study used 3 (three) nozzles, is the water flow discharge per unit time, and is the coefficient factor of fluid flow:
Fig. 3Pelton turbine nozzle design
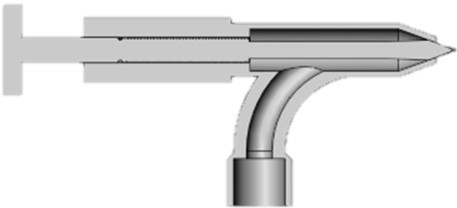
Table 1Pelton turbine nozzle parameters
No | Pelton turbine nozzle parameters | |
1 | Nozzle length | 235 mm |
2 | Nozzle needle angle | 70° |
3 | Number of nozzles | 3 buah |
4 | Wheel diameter | 14.07 mm |
5 | Jet spray Diameter | 8.72 mm |
The size of the Pelton turbine bucket uses the following rules:
With the provisions; 3.1 for 1 nozzle, 3.2 for 2 nozzles, 3.2 for 4-5 nozzles and 3.3 for 6 nozzles.
2.2. Calculation of nozzle dimensions
The flow rate at each nozzle can be calculated as follows:
where is the velocity of water through the nozzle. and is the nozzle area.
The area of the nozzle can be calculated:
From two equations above we can calculate the nozzle diameter:
where is nozzle diameter, is the nozzle water flow, is the number of the nozzle.
The nozzle length can be calculated using the following equation:
The nozzle outlet should be as close as possible to the Pelton runner to prevent the jet from deviating from the designed diameter. The distance between the nozzle and the runner should be 5 % of the runner orifice diameter, plus an additional allowance of (3) mm to allow for deflector emergencies:
To calculate the distance between the bucket and the nozzle, the minimum distance between the bucket and the nozzle can be calculated using the equation:
2.3. Calculation of bucket dimensions
Empirically, the number of buckets must fulfill the following equation , where is the number of buckets in the Pelton turbine.
Table 2Pelton turbine parameters
No | Pelton turbine parameters | |
1 | Runner radius | 96.28 mm |
2 | Bucket width | 28.28 mm |
3 | Bucket depth | 12.08 mm |
4 | Bucket height | 65.28 mm |
5 | Number of buckets | 18 buah |
6 | Bucket gap width | 13.11 mm |
7 | Bucket thickness | 15 mm |
The bucket axial width can be calculated as:
where is the nozzle diameter. Using a multiplying factor of 3.4, this equation states that the axial width of the bucket () can be calculated by multiplying the bucket diameter () by 3.4. In other words, this equation states that the axial width of the bucket is about 3.4 times the bucket diameter.
Bucket radial length can be calculated as:
Fig. 4a) Bucket design, b) runner design, c) Pelton turbine design
a)
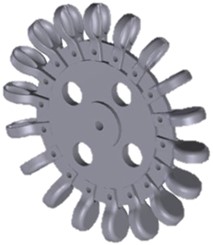
c)
b)
The radial length of the bucket can be calculated as:
The number of buckets in each runner should be determined so that no water particles are lost while minimizing the risk of adverse interactions between outflowing water particles and adjacent buckets. The number of buckets can be calculated by:
Bucket moment arm length:
The radius of the bucket center of mass to the runner center is given as:
Meanwhile, the bucket volume can be calculated as:
We can calculate the mass of the bucket as follows:
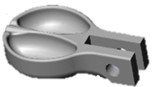
Fig. 5Pelton turbine bucket surface
Pelton turbine buckets are one of the most critical components in hydroelectric power plants using the Pelton turbine principle. The main wear of these buckets occurs on their internal surfaces, which are constantly exposed to high water flow and pressure. The materials used in the construction of the bucket must be resistant to corrosion, erosion, and wear caused by the friction of the water and the small grains carried by the flow. Over time, the repeated action of the flowing water will cause physical and chemical changes to the bucket surface that, if not properly addressed, can reduce the efficiency of the Pelton turbine and shorten the life of the overall system.
The separators inside the Pelton bucket are also susceptible to wear, as they serve as the elements that direct the water flow to the turbine wheel with a degree of precision. According to Brekke et al. (2002), an increase in the width of the separator by 1 % of the inner bucket width results in a decrease in efficiency of approximately 1 % at full load. The friction and stresses that occur during operation cause gradual wear of the splitter surfaces. It is important to regularly monitor and inspect the condition of the splitter and the inner surface of the bucket to ensure that there is no significant wear that could affect the performance of the Pelton turbine. Preventive maintenance and timely replacement of worn components are key to maintaining the durability and efficiency of hydroelectric systems using Pelton turbine buckets.
2.4. Torque exerted on the wheel
The force generated on the bucket by the difference between these momentum flow rates is:
or
It is helpful to express the ratio of bucket speed 𝑢 to jet speed 𝑣 as :
So that:
Therefore, the torque exerted on the wheel is:
We see that for a given wheel is fed with water at a fixed flow rate (so that and 𝑣 are also fixed), the torque varies as (). Hence, the torque drops linearly from a maximum when = 0 (i.e. when the wheel is stationary) to zero when 1 (i.e. when the bucket is moving at the same speed as the jet).
2.5. Head turbine
Turbine Head is the height difference between the fluid intake position and the position of the turbine. To determine the head value, use the following equation:
where is head turbin, is pressure at fluid surface1, is pressure at fluid surface 2, is flow velocity at point 1, is flow velocity at point 2, is gravity acceleration, is fluid density, is flow height at point 1, is flow height at point 2.
Fig. 6Variation of torque 𝑇 with speed ratio 𝜆
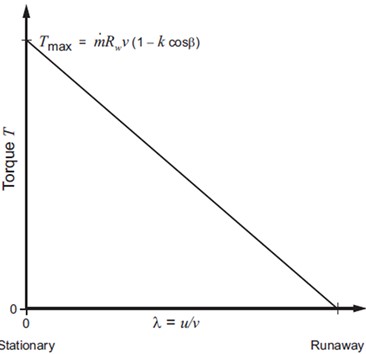
Fig. 7Prony brake
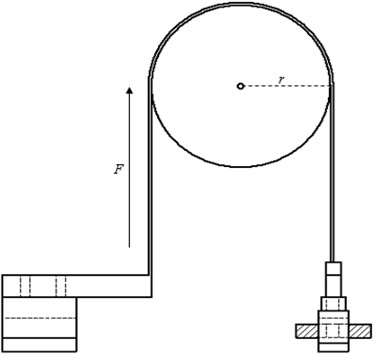
2.6. Torque moment
The moment of torque is the amount of force acting on the turbine that causes the turbine to rotate. The torque moment value of the turbine can be known from the following equation:
where is the turbine torque moment, is the force on the turbine (N), and is the radius.
2.7. Flow velocity
Fluid flow velocity can be calculated using the following equation:
where is the flow velocity, is the water discharge and is the cross-sectional area of the pipe.
2.8. Water power (WHP)
Water power (WHP) is defined as the effective power of water flow per unit time:
where is the water density (kg/m3), is the acceleration of gravity (m/s2), is the water discharge (m3/s) and is turbine head (m).
2.9. Turbine power (BHP)
Turbine power (BHP) is the power generated by the fluid to drive the turbine at a certain torque and speed. Turbine power can be calculated using the following equation:
where is the turbine rotation (Rpm) and is the torsional moment (Nm).
2.10. Turbine efficiency
Turbine efficiency is the percentage of power that can be generated or converted by a turbine from the potential energy or kinetic energy of water. The value of turbine efficiency is determined in percent:
where BHP is turbine power and WHP is water power.
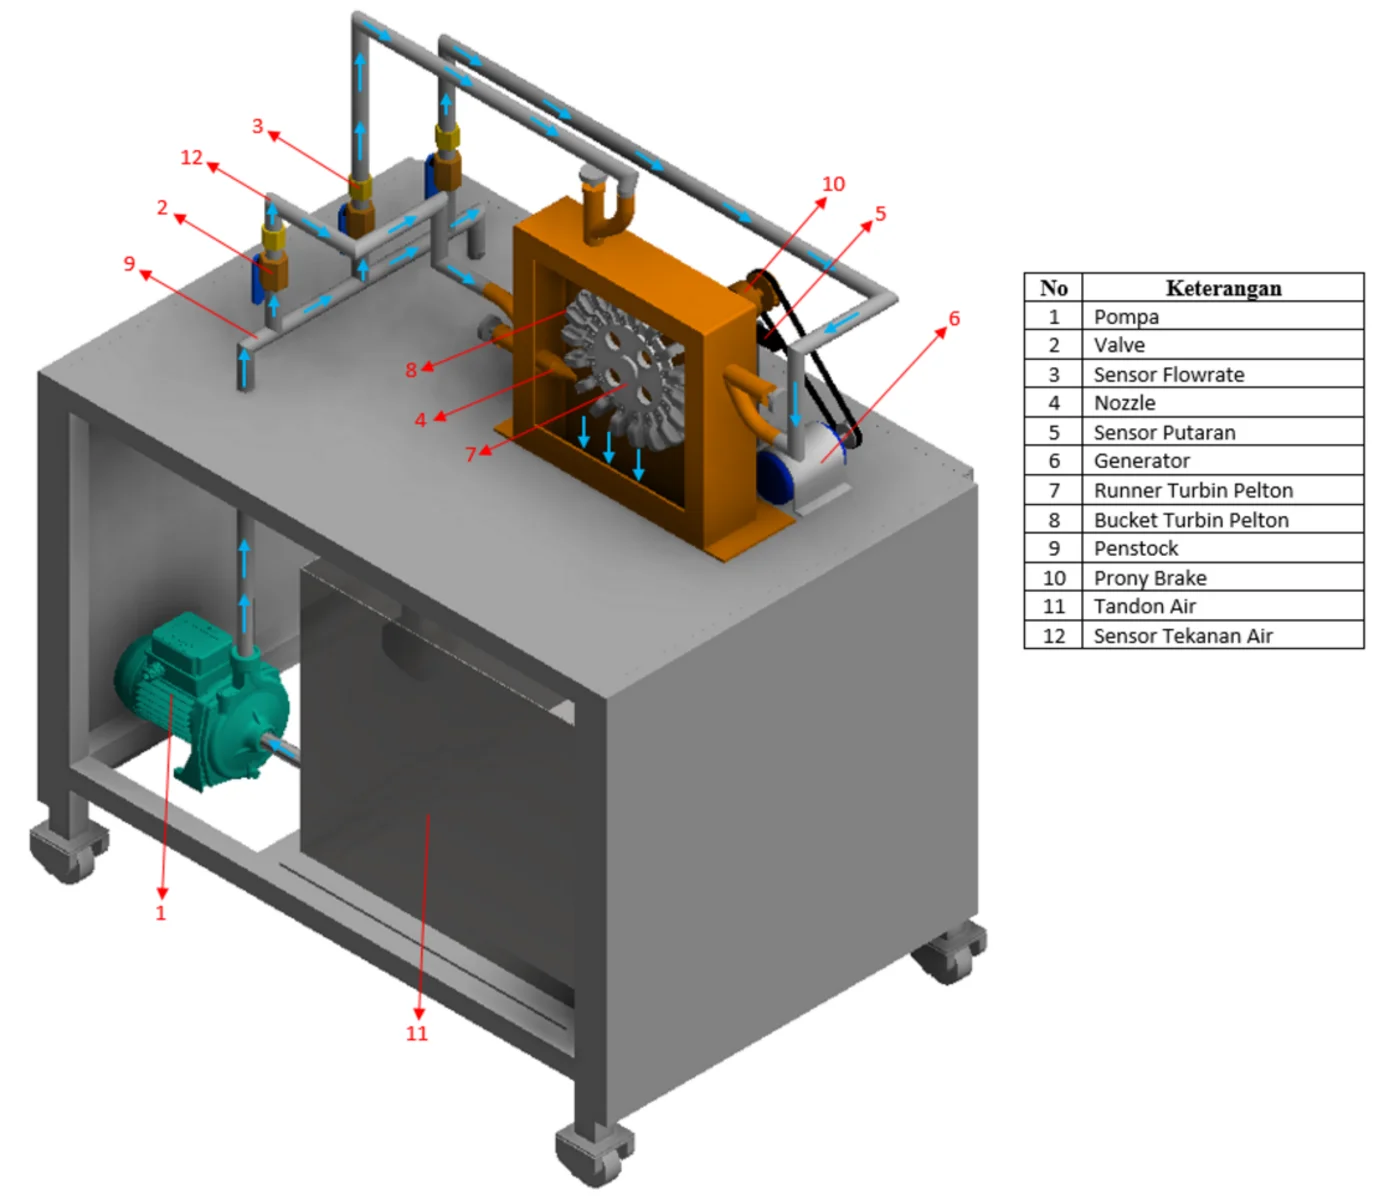
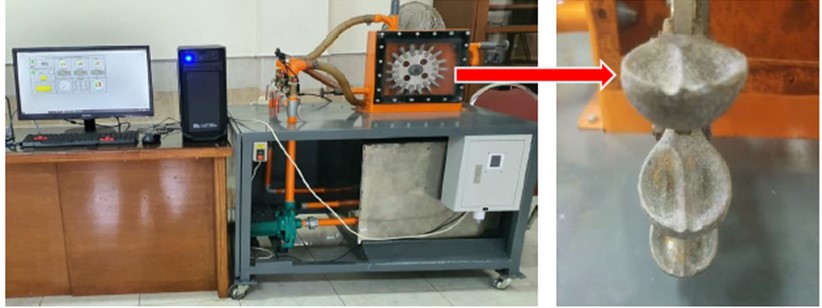
Fig. 8Pelton turbine system
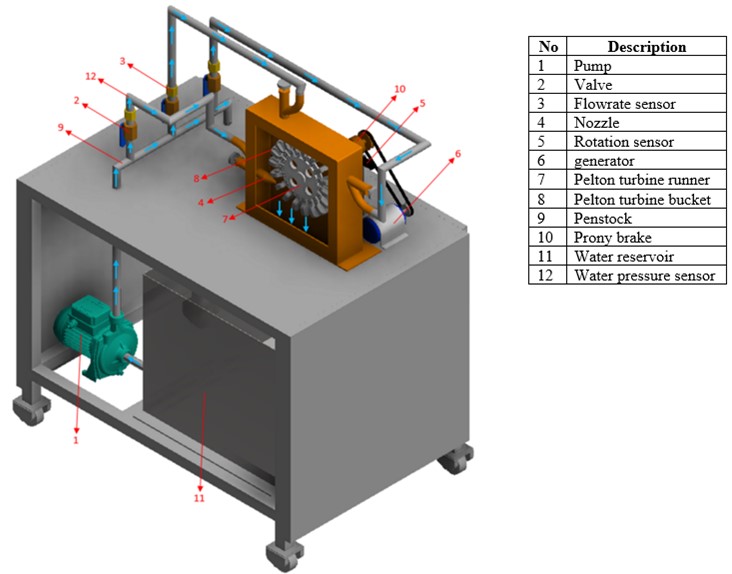
2.11. Schematic of Pelton turbine system
Pelton turbine consists of a set of road blades rotated by water whose dimensions are shown in Table 2, then the turbine blade is sprayed using one, two and three nozzles, the results of each nozzle will be used for analysis, from the nozzle size used is shown in Table 1. Pelton turbine is a water turbine that is suitable for high head. Therefore, in this laboratory scale research, a water pump is used as a booster until the water pressure through the nozzle pipe by moving the overflow pipe faucet to a pressure of 10 Psi. In this study a Prony brake, generator, several sensors used for data collection are shown in the Fig. 9.
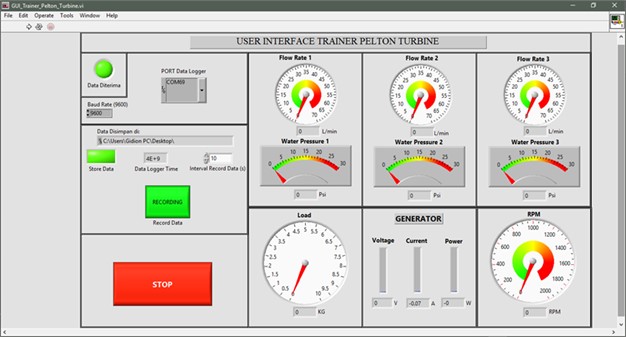
This research also includes a GUI and datalogger that is used to store data, for example to set the data recording time interval by changing the value in “Interval Record Data (s)” in the GUI. For this experiment, change the data recording interval to 10 seconds, then after finishing changing the interval value, press ENTER. (If you feel that 10 seconds is still too fast, you can change it to a larger value in seconds). When the GUI is recording data on the trainer the RECORD icon which was previously yellow will change to a green RECORDING icon, the indicator that the data has been recorded by the GUI is the “Store Data” indicator on the GUI lights up green as shown in Fig. 10. After the “Store Data” indicator is green, change the load (increase) by turning the Prony brake knob with a step interval of 0.1 Kg as shown in Fig. 11.
Fig. 9Schematic of Pelton turbine system: 1. Pump, 2. Faucet input line nozzles, 3. Drain line faucet, 4. Water pressure sensor, 5. Water flow speed sensor, 6. Pelton turbine, 7. Speed sensor, 8. Prony brake, 9. Generator, 10. Electric current sensor, 11. Voltage sensor
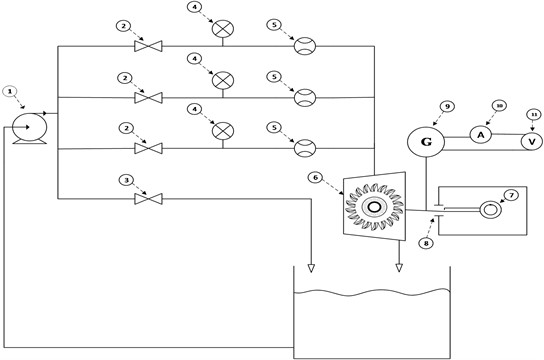
Fig. 10Graphical user interface
3. Pelton turbine test results
In this study, the effect of the number of nozzles on the Pelton turbine performance was tested. The number of nozzles used in this test is 3 (three) nozzles as test parameters. In the first test, one nozzle is used to rotate the Pelton turbine.
In Fig. 12 we can see the relationship between turbine rpm and turbine power which is the result of testing the pelton turbine using 1 (one) nozzle. The results show a graph with a parabolic curve shape. The maximum turbine power was obtained at 4.929 watts at a turbine rotation of 271.49 rpm. While in the graph of the relationship between torque and turbine power, the maximum turbine power is obtained at a torque of 0.173 Nm. This can be known from the intersection of the turbine rpm and turbine power relationship curves with the torque and turbine power relationship curves.
Fig. 11Prony brake, generator dan RPM
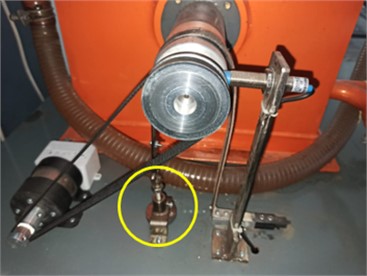
Fig. 12Pelton turbine graph with 1 nozzle
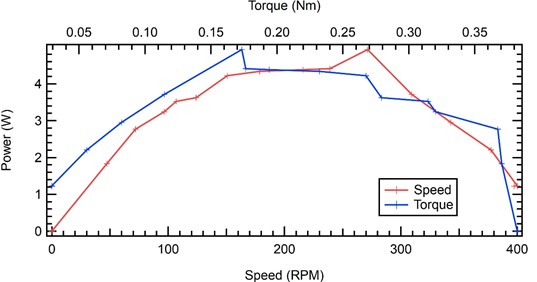
Fig. 13Graph of Pelton turbine with 2 nozzles
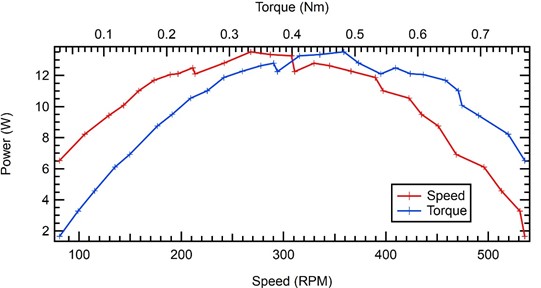
The next result using 2 (two) nozzles on the Pelton turbine can be seen in the graph of the relationship between turbine rpm and turbine power using 2 nozzles. A graph with a parabolic curve is obtained, where the maximum power obtained is 13,517 watts at a turbine rotation of 267.86 rpm. While on the graph of the power generated against the Pelton turbine torque, a parabolic graph is obtained with the maximum power obtained at a torque of 0.482 Nm.
The following are the results of research on Pelton turbines using 3 (three) nozzles. In the graph of the relationship between turbine rpm and turbine power using 3 nozzles, a graph with a parabolic curve is obtained, where we can see that the power and RPM are increasing compared to using 1 (one) or 2 (two) nozzles. The maximum power obtained is 12.439 watts at a turbine rotation of 212.77 rpm. The torque obtained at the time of maximum turbine power is 0.558 Nm.
Fig. 14Pelton turbine graph with 3 nozzles
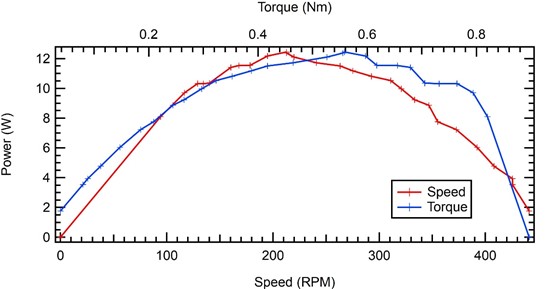
Fig. 15Pelton turbine efficiency graph against load
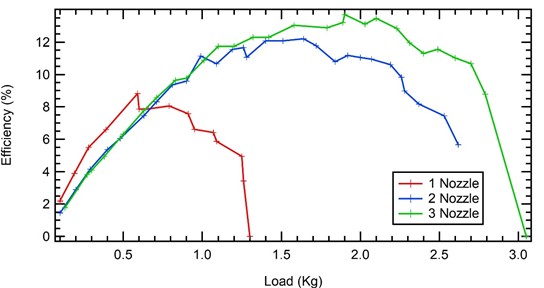
After testing the performance of the Pelton turbine by loading each turbine with a different number of nozzles, namely 1, 2 and 3 nozzles, the results are obtained as shown in the graph above. In the graph of nozzle 1 (one) we can see that initially the efficiency value increases quickly and the increase is quite drastic compared to using 2 (two) or 3 (three) nozzles. This is because using 1 (one) nozzle on the Pelton turbine makes the efficiency increase because there is no other resistance received by the turbine compared to using 2 (two) or 3 (three) nozzles. When using more than 1 (one) nozzle, the other turbine surface on the other side of the turbine will receive spray, so initially there is a greater load compared to using only 1 (one) nozzle. However, if the load continues to increase, it is necessary to add another nozzle to increase efficiency. From the graph, we can see that the Pelton turbine with 3 nozzles has a higher efficiency value compared to turbines with 1 or 2 nozzles.
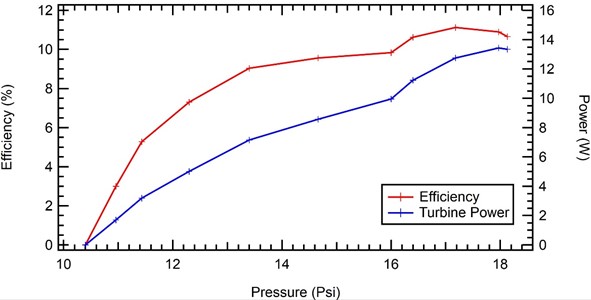
Based on the graph above, it is found that the higher the water pressure and turbine power, the efficiency will increase. The peak at a pressure of 18.13 Psi, the turbine efficiency is 10.656 %. And at a pressure of 10.4 Psi, the efficiency becomes 0 %. For more details can be seen in Table 3.
To test the effect of pressure variation on Pelton turbine performance, a constant load of 1 kg was applied to the Pelton brake and then the water pressure at the nozzle was varied. The test results produce a graph as shown in Fig. 16, where changes in water pressure affect the power and efficiency of the Pelton turbine. The higher the pressure at the nozzle, the higher the power and efficiency of the turbine as shown in Table 3 no 3 has an efficiency of 11.120351.
Table 3Pelton turbine test results with pressure variations
No | Pressure (Psi) | Flowrate (L/min) | Load (kg) | Speed (RPM) | Torque (Nm) | Water power / WHP (W) | Turbine power / BHP (W) | Efficiency (%) |
1 | 18.13 | 59.94 | 1.04 | 416.67 | 0.30576 | 125.1269464 | 13.33464001 | 10.6568892 |
2 | 17.97 | 59.57 | 1.04 | 419.58 | 0.30576 | 123.2571094 | 13.42776839 | 10.8941127 |
3 | 17.18 | 57.98 | 1.05 | 394.74 | 0.3087 | 114.6931988 | 12.75428624 | 11.120351 |
4 | 16.4 | 55.98 | 1.04 | 350.88 | 0.30576 | 105.7092573 | 11.22917053 | 10.6226936 |
5 | 16 | 54.95 | 1.03 | 314.14 | 0.30282 | 101.2334297 | 9.956717562 | 9.83540476 |
6 | 14.66 | 53.12 | 1.04 | 267.86 | 0.30576 | 89.66610827 | 8.572291437 | 9.56023586 |
7 | 13.4 | 51.26 | 1.03 | 225.56 | 0.30282 | 79.08965783 | 7.14916029 | 9.03931119 |
8 | 12.3 | 48.52 | 1.03 | 158.31 | 0.30282 | 68.71668242 | 5.01766078 | 7.30195435 |
9 | 11.43 | 45.84 | 1.09 | 94.94 | 0.32046 | 60.32913436 | 3.184428111 | 5.278425 |
10 | 10.96 | 44.95 | 1.04 | 53.1 | 0.30576 | 56.72526148 | 1.699352928 | 2.99576041 |
11 | 10.4 | 42.5 | 1.03 | 0 | 0.30282 | 50.8930512 | 0 | 0 |
Fig. 16Effect of water pressure variations on Pelton turbine power and efficiency
4. Conclusions
From the test results using a series of Pelton turbine blade performance test equipment, that the number of nozzles on the Pelton turbine affects the power efficiency of the Pelton turbine, where from the experiments conducted it is known that the Pelton turbine using 3 nozzles has the highest efficiency value of 13.7 % compared to the Pelton turbine using 1 or 2 nozzles with efficiency values of 12.209 % and 8.82 % respectively. Turbine power output is influenced by the value of water pressure, where the value of turbine power output converted from water potential energy is directly proportional to the value of water pressure, the higher the water pressure, the greater the turbine power output will increase its efficiency.
References
-
E. Y. Setyawan, S. Djiwo, D. H. Praswanto, P. Suwandono, and P. Siagian, “Design of low flow undershot type water turbine,” Journal of Science and Applied Engineering, Vol. 2, No. 2, p. 50, Nov. 2019, https://doi.org/10.31328/jsae.v2i2.1184
-
E. Y. Setyawan, S. Djiwo, D. H. Praswanto, P. Suwandono, P. Siagian, and W. Naibaho, “Simulation model of vertical water wheel performance flow,” in IOP Conference Series: Materials Science and Engineering, Vol. 725, No. 1, p. 012020, Jan. 2020, https://doi.org/10.1088/1757-899x/725/1/012020
-
“Hydropower Status Report,” IHA Central Office, United Kingdom, International Hydropower Association (IHA), 2021.
-
E. Quaranta et al., “Hydropower case study collection: innovative low head and ecologically improved turbines, hydropower in existing infrastructures, hydropeaking reduction, digitalization and governing systems,” Sustainability, Vol. 12, No. 21, p. 8873, Oct. 2020, https://doi.org/10.3390/su12218873
-
I. Kougias et al., “Analysis of emerging technologies in the hydropower sector,” Renewable and Sustainable Energy Reviews, Vol. 113, p. 109257, Oct. 2019, https://doi.org/10.1016/j.rser.2019.109257
-
V. E. Mikhailov, I. P. Ivanchenko, and A. N. Prokopenko, “Modern state of hydropower and construction of hydro turbines in Russia and abroad,” Thermal Engineering, Vol. 68, No. 2, pp. 83–93, Feb. 2021, https://doi.org/10.1134/s004060152102004x
-
E. Quaranta et al., “Assessing the energy potential of modernizing the European hydropower fleet,” Energy Conversion and Management, Vol. 246, p. 114655, Oct. 2021, https://doi.org/10.1016/j.enconman.2021.114655
-
M. Nechleba, Hydraulic Turbines: Their Design and Equipment. Prague: Artia, 1957.
-
F. A. Essa and F. Selim, “Improving the operation of small reverse osmosis plant using Pelton turbine and supplying emergency electric loads,” Energy Sources, Part A: Recovery, Utilization, and Environmental Effects, Vol. 45, No. 4, pp. 12040–12055, Oct. 2023, https://doi.org/10.1080/15567036.2023.2268594
-
H. Zhao, B. Zhu, B. Xu, P. Tang, N. Guo, and W. Zhang, “Investigation on the influence of bucket’s flow patterns on energy conversion characteristics of Pelton turbine,” Engineering Applications of Computational Fluid Mechanics, Vol. 17, No. 1, Dec. 2023, https://doi.org/10.1080/19942060.2023.2234435
-
J.-W. Kim, I. C. Jo, J. H. Park, Y. Shin, and J. T. Chung, “Theoretical method of selecting number of buckets for the design and verification of a Pelton turbine,” Journal of Hydraulic Research, Vol. 55, No. 5, pp. 695–705, Sep. 2017, https://doi.org/10.1080/00221686.2017.1354933
-
J.-C. Marongiu, F. Leboeuf, J. Caro, and E. Parkinson, “Free surface flows simulations in Pelton turbines using an hybrid SPH-ALE method,” Journal of Hydraulic Research, Vol. 48, No. sup1, pp. 40–49, Jan. 2010, https://doi.org/10.1080/00221686.2010.9641244
-
R. Khan and A. Kumar, “Performance enhancement of hydrokinetic turbine using augmentation techniques: a review,” International Journal of Green Energy, Vol. 21, No. 7, pp. 1667–1694, May 2024, https://doi.org/10.1080/15435075.2023.2258187
-
B. Liu, Z. Yang, Y. Chen, L. Li, and S. Chen, “A decision-making framework for scheme selection for sustainable hydropower development,” International Journal of Green Energy, Vol. 18, No. 9, pp. 951–965, Jul. 2021, https://doi.org/10.1080/15435075.2021.1890081
-
S. Schismenos, G. J. Stevens, D. Emmanouloudis, N. Georgeou, S. Shrestha, and M. Chalaris, “Humanitarian engineering and vulnerable communities: hydropower applications in localised flood response and sustainable development,” International Journal of Sustainable Energy, Vol. 39, No. 10, pp. 941–950, Nov. 2020, https://doi.org/10.1080/14786451.2020.1779274
-
S. A. Solarin, M. O. Bello, and O. E. Olabisi, “Toward sustainable electricity generation mix: an econometric analysis of the substitutability of nuclear energy and hydropower for fossil fuels in Canada,” International Journal of Green Energy, Vol. 18, No. 8, pp. 834–842, Jun. 2021, https://doi.org/10.1080/15435075.2021.1880917
-
F. Ope Olabiwonnu, T. Haakon Bakken, and B. Anthony Jnr, “The role of hydropower in renewable energy sector toward co2 emission reduction during the COVID-19 pandemic,” International Journal of Green Energy, Vol. 19, No. 1, pp. 52–61, Jan. 2022, https://doi.org/10.1080/15435075.2021.1930005
-
S. Schismenos, G. J. Stevens, D. Emmanouloudis, N. Georgeou, S. Shrestha, and N. D. Katopodes, “Using off-grid hydropower for community-led flood resilience: an integrated systems approach,” International Journal of Sustainable Energy, Vol. 41, No. 6, pp. 594–608, Jul. 2022, https://doi.org/10.1080/14786451.2021.1961773
-
K. Kashyap, R. Thakur, R. Kumar, and S. Kumar, “Feasibility analysis for conversion of existing traditional watermills in Western Himalayan region of India to micro-hydropower plants using a low head Archimedes screw turbine for rural electrification,” International Journal of Ambient Energy, Vol. 43, No. 1, pp. 7463–7473, Dec. 2022, https://doi.org/10.1080/01430750.2022.2068056
-
H. Brekke, Y. L. Wu, and B. Y. Cai, “Design of hydraulic machinery working in sand laden water,” Abrasive Erosion and Corrosion of Hydraulic Machinery, Vol. 2, pp. 155–233, Nov. 2011, https://doi.org/10.1142/9781848160026_0004
-
Z. Zhang, Pelton Turbines. Cham: Springer International Publishing, 2016, https://doi.org/10.1007/978-3-319-31909-4
-
“International Water Power and Dam Construction,” Wilmington Media Ltd, 2009.
About this article

Thanks to the National Institute of Technology Malang which has provided a lot of assistance and facilities for this research.
The datasets generated during and/or analyzed during the current study are available from the corresponding author on reasonable request.
Eko Yohanes Setyawan – conceptualization, ideas; formulation or evolution of overarching research goals and aims. Awan Uji Krismanto – management activities to annotate (produce metadata), scrub data and maintain research data (including software code, where it is necessary for interpreting the data itself) for initial use and later reuse. Mujiono – conducting a research and investigation process, specifically performing the experiments, or data/evidence collection. Soeparno Djiwo – development or design of methodology; creation of models. Choirul Saleh – management and coordination responsibility for the research activity planning and execution. Taufik Hidayat – creation and/or presentation of the published work, specifically writing the initial draft (including substantive translation).
The authors declare that they have no conflict of interest.
