Abstract
In order to study the effect of different bolts tightening sequences on the stress of bolts work-piece, the finite element simulation and stress test experiments are adopted. Three types of bolt work-piece: two, five, and frame type bolts work-pieces are studied under different tightening sequences. The stress values and distribution are obtained under different tightening sequences by simulation. It is observed that the stress distribution tendency of bolts work-piece has little change under different tightening sequences. It also notices that the tightening sequences have no effect on two bolts work-piece due to the symmetry of work-piece. In five bolts work-piece, the variation range of stress under tightening from ends to middle is smaller than that under sequence tightening, which indicates that better stress uniformity is obtained under tightening from ends to middle in five bolts work-piece. Similarly, in frame bolts work-piece, the variation range of stress under symmetrical tightening is smaller than that under sequence tightening, which indicates that better stress uniformity is obtained under symmetrical tightening in frame type bolts work-piece. Furthermore, the experimental results are in good agreement with the simulation results. Moreover, the stress variation mechanism is revealed by analyzing residual preload variation under sequence tightening.
Highlights
- Different stress value variation under different bolt assembly sequences.
- Different stress distribution under different bolt assembly sequences.
- Stress values of bolts tightened first are larger than that tightened later.
1. Introduction
The bolt connection, a common connection mode, is widely applied in machine tools, aerospace, automobile, and other fields [1-3]. Many experts had made in-depth research on bolt connection by means of experiments and finite element simulation due to the universality and importance of bolt connection [4, 5].
On aspect of experiments, Bibel et al. [6] found assembly quality, such as surface clearance and dislocation, would directly affect the elastic interaction between bolts by the experiments of the bolt connection of flange gaskets. Fukuoka et al. [7, 8] studied the assembly process of pipe flange bolt connection by finite element simulation calculation. To study the influence of high-strength bolt pretension on the joint plate, the different stress distribution on different pretension on the joint plate was studied [9]. For theoretical study, Chen et al. [10, 11] established the finite element model of long plate bolt group connection by using nonlinear contact, and studied the influence of bolt tightening sequence on the residual pre-tightening force of bolts. In study of assembly performance of a gasket bolted flanged pipe joint using different bolt tightening strategies, it is concluded that the bolt scatter cannot be eliminated using torque control method, but can be reduced within acceptable level by proper bolt up sequence and multiple pass tightening [12]. Ibai Coria et al. [13] found a numerical methodology that iteratively calculated the non-uniform bolt tightening load distribution to achieve a uniform gasket stress distribution, which improved the performance of bolted joints subjected to external loads. A general multi-bolts elastic interaction with bolt stress relaxation was modeled analytically to take elastic interaction and bolt stress relaxation into account before jointing [14]. In the study of dynamic characteristics of bolted joints, Zhao et al. [15] proposed a nonlinear virtual material method based on surface contact stress to describe the bolted joint for accurate dynamic performance analysis of the bolted assembly.
Although some researches have been achieved, few works about the bolt tightening sequences effects on stress have been done. The stress distribution under different bolt tightening sequences is unknown. In addition, previous researchers focused only on stress of bolt in one case of work-piece [16]. The stress of multiple cases of bolts work-piece has rarely been reported. Moreover, the consistency of stress distribution and variation in different forms of bolt work-pieces still needs to be confirmed. Furthermore, there is also a lack of explanation for the cause of stress variation under different bolt tightening sequences. Therefore, it is necessary to study the change of stress and cause in work-pieces under different bolt tightening sequences.
In order to study the effect of different bolts tightening sequences on the stress of bolts work-pieces, the finite element simulation combined with strain stress testing method is used to study the effect of different bolts tightening sequences on the stress of bolts work-pieces. Three types of bolt work-piece: two bolts, five bolts, and frame type bolts work-piece are studied under different tightening sequences. The stress values and stress distribution are obtained under different tightening sequences by finite element simulation. Moreover, strain stress testing experiment is also conducted to validate the outcomes.
Fig. 1Three different bolts work-pieces
2. Method and methodology
2.1. Description of experimental model and tightening sequence
This research of stress of bolts is mainly applied to the connection of machine tool component. The two bolts, five bolts, and frame type bolts are the main connection forms in machine tool. Fig. 1(a), (b), and (c) show the two bolts, five bolts and frame type bolts work-pieces, respectively. The M12*80 bolts with the strength grade 12.9 are assembled in work-pieces. The flat washers with 2.5mm thickness are used between the joints of nuts and bolt heads. The surface roughness of the joint is 1.6um. The strain gauges are pasted at the middle part of the upper rows in the two bolts, five bolts and frame type bolts work-pieces. Due to the uniformity of the size and material and symmetry of position in bolt work-pieces, it is only necessary to measure the maximum principal stress and strain on up rows in subsequent experiments and simulations.
In order to study the effect of different bolts tightening sequences on the stress of bolts work-pieces, the different bolt tightening sequences of two bolts, five bolts and frame type bolts work-pieces are shown in Fig. 2(a), (b), and (c), respectively. The circles represent the bolts while the rectangles represent the work-piece. The number on each bolt indicates the order in which it is installed.
Fig. 2Different tightening sequence in three different bolts work-piece: a) two bolts work-piece, b) five bolts work-piece, and c) frame type bolts work-piece
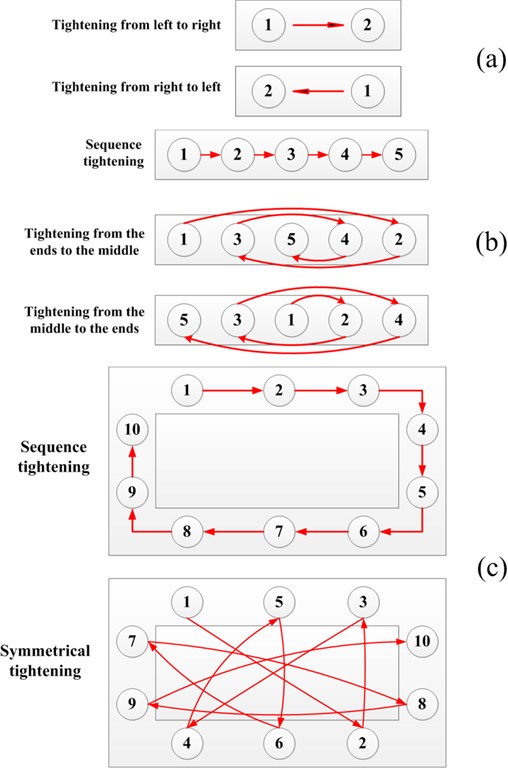
Fig. 2(a) shows the tightening sequences of the two bolts work-piece: tightening from left to right and right to left. Fig. 2(b) shows the tightening sequences of the five bolts work-piece: sequence tightening, tightening from middle to the ends and ends to the middle. Fig. 2(c) shows the tightening sequences of the frame type bolts work-piece: sequence and symmetrical tightening. By comparing the stress variation of the different bolts work-pieces, the influence of different bolt tightening sequences on stress distribution of bolts work-pieces are researched.
2.2. Simulation model
Because it is hard to measure the distribution of stress filed in the bolts work-pieces solely on experiment, the simulations are adopted by finite element software. The material of bolts work-pieces is Q235 steel while the material of bolt is alloy steel. The galvanized steel gasket is adopted. In the room temperature, the elastic modulus and Poisson’s ratio of these materials are almost the same. Therefore, in the process of building finite element model, the elastic modulus and Poisson's ratio of all materials are 210 GPa and 0.27, respectively [17].
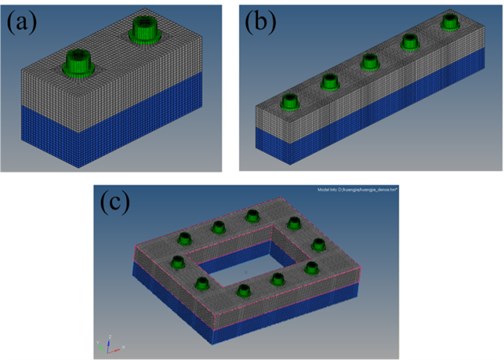
In bolt connection group, it mainly consists of upper and lower work-pieces, multiple bolts, nuts and gaskets. There are several assembly pairs in bolt connection work-pieces: bolt head and gasket, bolt and nut, nut and gasket, gasket and work-pieces. These types of contacts all belong to non-linear contact. To reduce the amount of calculation time and facilitate the convergence in the iteration of finite element calculation, only the contact pairs associated with the work-piece are retained. To facilitate meshing and ensure accuracy of simulation, hexagon nut is simplified to a circle. The Solid 185 element is adopted in simulation [17]. To improve the accuracy of calculation, the meshes on the contact surface are subdivided. Fig. 3 shows the meshing of the finite element model.
Fig. 3Mesh of three different the finite element models: a) two bolts work-piece, b) five bolts work-piece, and c) frame type work-piece
In dealing with the contact analysis, the contacts between gasket and work-piece, work-piece and work-piece are defined as Friction. The friction coefficient between the work-piece is 0.15 while the friction coefficient between the gasket and the work-piece is 0.18. To improve the convergence of calculation, the contact behavior mode is set to Symmetric contact in this simulation. In addition, to solve the problem of mutual penetration between contact surfaces, the Augment Lagrange algorithm [18] is adopted as contact formula in advanced settings. To avoid the large rigid body displacement in simulation results, the Weak Spring setting is enabled. The pre-tightening load of bolts is set by using the “bolt pretension” function of software. The sequence tightening is from left to right in five bolts work-pieces while that of frame type bolts work-piece is clockwise direction [19, 20]. Different tightening sequences would be carried out by setting different load steps.
2.3. Experimental stress testing principle and method
In order to test stress on bolts work-pieces under different tightening sequences, three phase strain gauge and static strain tester are used to collect experimental data. The strain is analyzed and processed, then the stress of the bolt work-piece is calculated.
2.3.1. Formula deduction of strain and stress
Cartesian coordinate system is established at any point on the work-piece surface. Linear strain εx, εyand shear strain γxy are supposed to be known. Under the condition of small deformation of work-pieces, linear strain εx, εyand shear strain γxy of the point and X-axis in arbitrary α angular direction could be obtained by superposition principle. The corresponding formulas are shown below:
The derivative of εαto α is taken:
When the derivative is zero, the positive strain εα on the section determined by the angle of α takes the extreme value. Comparing the Eqs. (2) and (3), it can be found that shear strain is zero at this time. So, it is direction of the main strain when the derivative is zero. α is brought into Eq. (2), the value of principle strain and α are calculated as shown in Eq. (4):
Because shear strain γxy cannot be measured directly by device, it can be derived by substituting the measured ε into Eq. (5):
In order to simplify the calculation, α1,α2, α3are taken as special values. The three directions of strain gauge are selected to be 0°, 45° and 90°, respectively. When α1,α2, α3are selected to be 0°, 45° and 90°, the Eq. (5) could be simplified as Eq. (6):
The linear strain and shear strain can be calculated by Eq. (6) as shown in Eq. (7):
Bring the Eq. (7) into the Eq. (4), the value and direction of principal strain can be calculated as shown in Eq. (8):
The principal stress can be calculated by Hooke’s law and the measured principal strain as shown in Eq. (9). The direction of principal stress is consistent with that of principal strain:
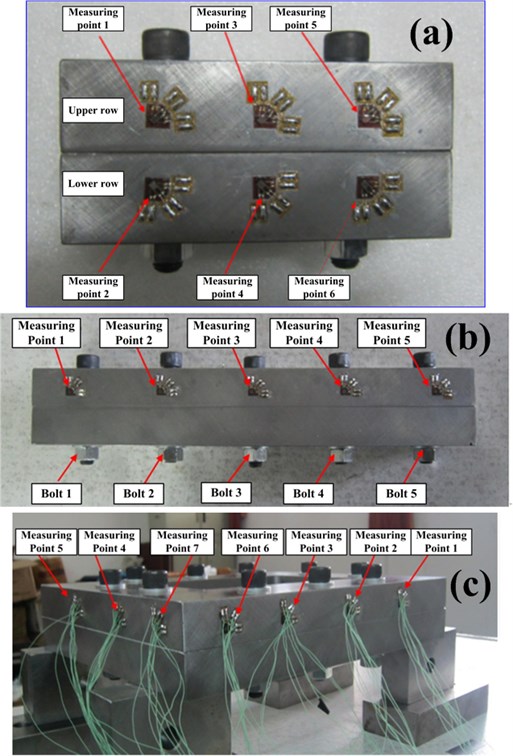
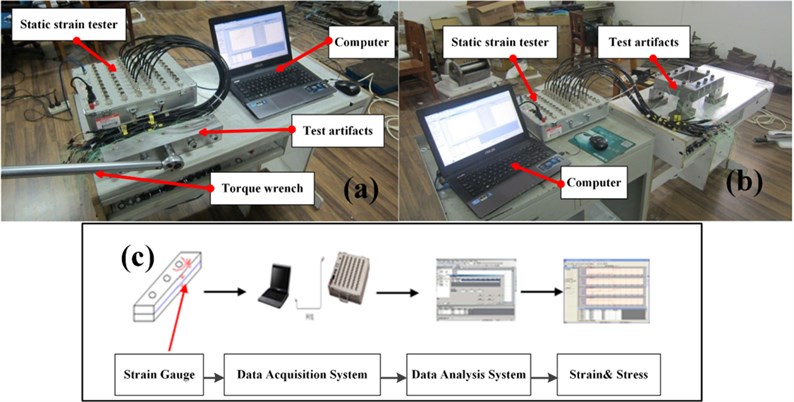
The bolt preloading is exerted by applying torque on the bolt with the torque wrench. Using the torque wrench, the precise preloading can be exerted on the bolt [22, 23]. Every stress test is repeated five times to ensure the reliability and accuracy. The strain value of each point is measured by the test system as shown in Fig. 4(a) and (b). According to the stress-strain formulas deduced, the specific stress value of each point is calculated.
The stress testing process is shown in Fig. 4(c). Three phase strain gauge is pasted on the surface of the experimental work-pieces, and strain of work-piece is measured by resistance strain gauge [24]. At present, beam type of resistance strain gauge is commonly used in strain and mechanical measurement. It is easy to use, good in generality, suitable for many occasions, and the test results are more accurate and reliable than many other methods (such as tube type and diaphragm type of resistance strain gauge) [25]. The strain is collected by the data acquisition system, and the stress state of the work-piece is calculated by analysis program in device. Temperature self-compensated BE120-2CB (11) resistance strain gauge is used in the experiment. Due to the strain value of work-piece is very small, its order of magnitude is generally 10-6, the resistance of strain gauge changes little, which needs to be amplified by instrument. The resistance value of the resistance strain gauge is 120 Ω. Data acquisition system DH3816N static strain tester is applied. All experimental instruments and equipment can meet the experimental requirements.
Fig. 4Specific experimental equipment and scenarios: a) five bolts work-piece, b) frame type bolts work-piece, and c) stress testing process
3. Results and discussion
3.1. Stress results of simulation
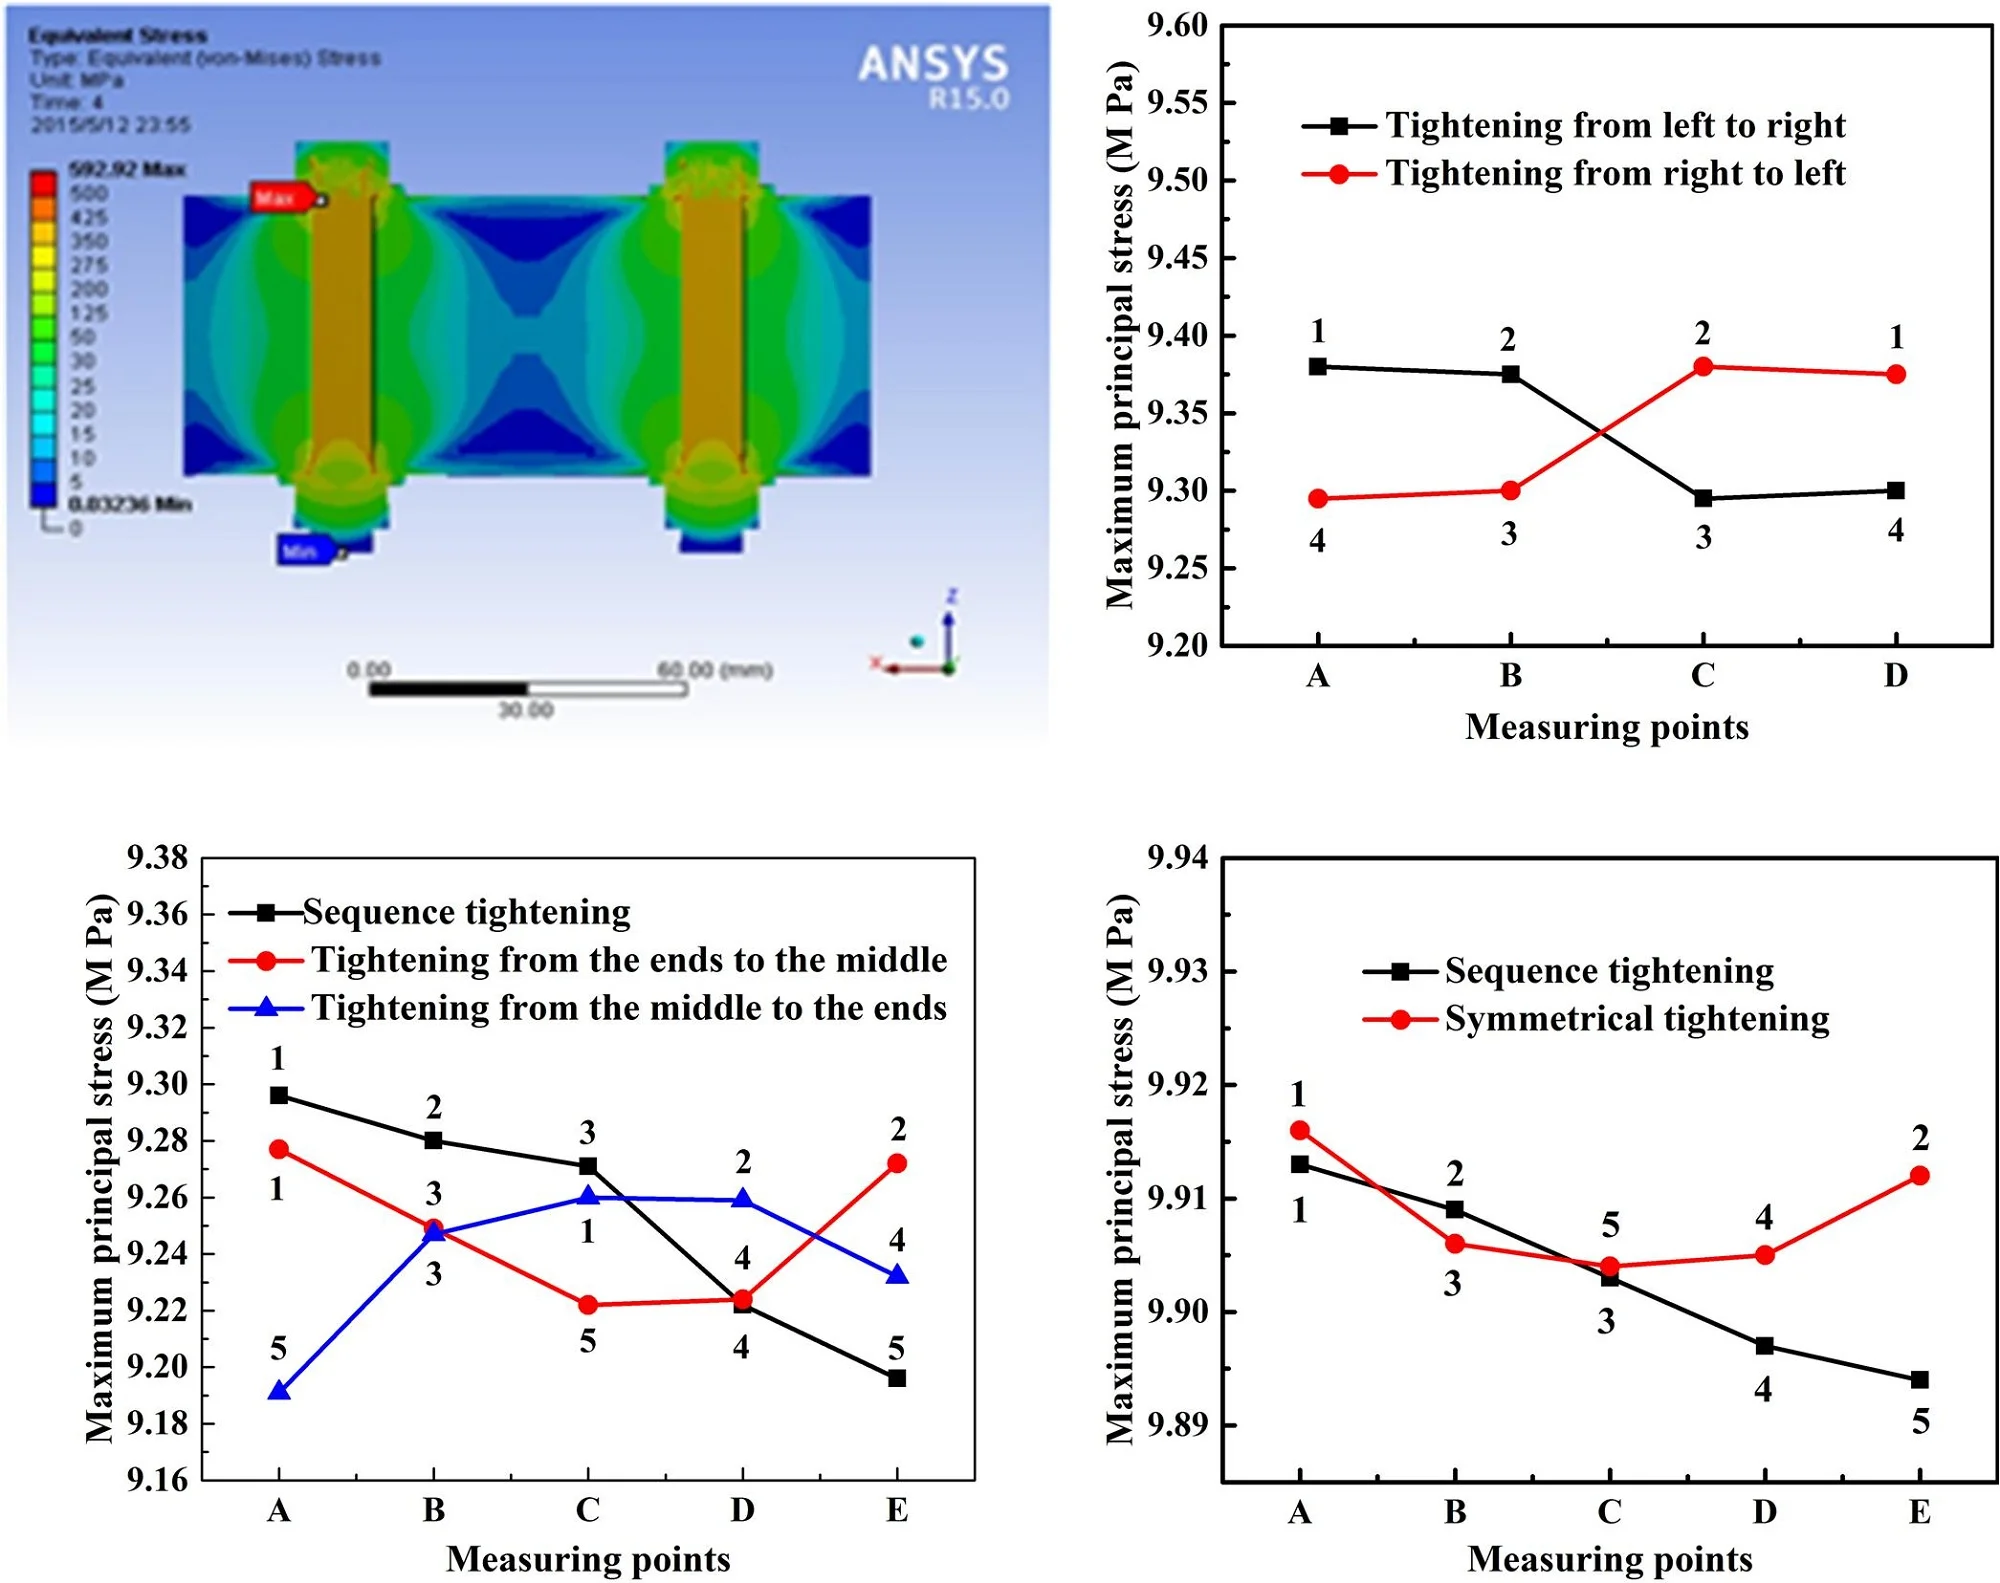
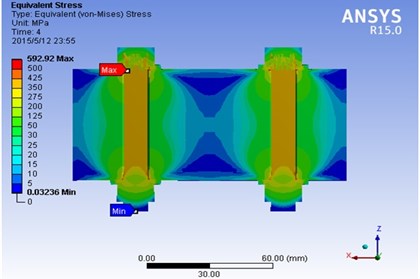
Fig. 5 shows the semi-sectional stress distribution of the tightening from left to right in two bolts work-piece. It can be seen that the stress distribution of the work-pieces is spindle shape when the bolt is pre-tightened. This simulation results are in agreement with theoretical model of stress distribution in Screw Joints by Xue Chuang [25].
In the cross-sectional view of two bolts work-piece, it can be found that the stress value of the point located between two bolts is less than that located on the bolts. The above phenomenon also appears in five and frame type bolts work-piece (not shown here). Since the stress distribution of two bolts, five bolts and frame type bolts work-piece are basically the same, for simplicity, the stress distribution of five and frame type bolts work-pieces are not be repeated in this work.
In order to compare the stress values at the bolts, the A,B,C,D represent the measuring point 1, measuring point 2, measuring point 5, measuring point 6, respectively, in two bolts work-piece. The A,B,C,D,E represent the measuring point 1, measuring point 2, measuring point 3, measuring point 4, measuring point 5, respectively, in five bolts work-piece and frame type bolts work-piece.
Fig. 5Cross-sectional view of stress distribution of the two bolts work piece under tightening from left to right
The different bolts tightening sequences are simulated by ANSYS Workbench in two bolts, five bolts and frame type bolts work-pieces. In order to be consistent with the results in subsequent experiments, the maximum principal stress is occurred in simulation. The maximum principal stress of the two element nodes located on strain gauge center in model of work-pieces is obtained. These measuring points in simulation are consistent with the measuring points tested by strain gauge in subsequent experiments. Then the average maximum principal stress is calculated by the former maximum principal stresses.
The stress distributions and maximum principal stresses of two bolts work-pieces, five bolts work-piece and frame type bolts work-pieces under different bolt tightening sequences are shown in Fig. 6, Fig. 7, and Fig. 8, respectively. The number in Fig. 6(d), Fig. 7(d), and Fig. 8(d) represent the tightening sequence of measuring point.
Fig. 6Surface stress distribution of two bolts work-piece under bolt assembly processes: a) tightening from left to right, and b) tightening from right to left, and c) stress curves of two tightening sequences
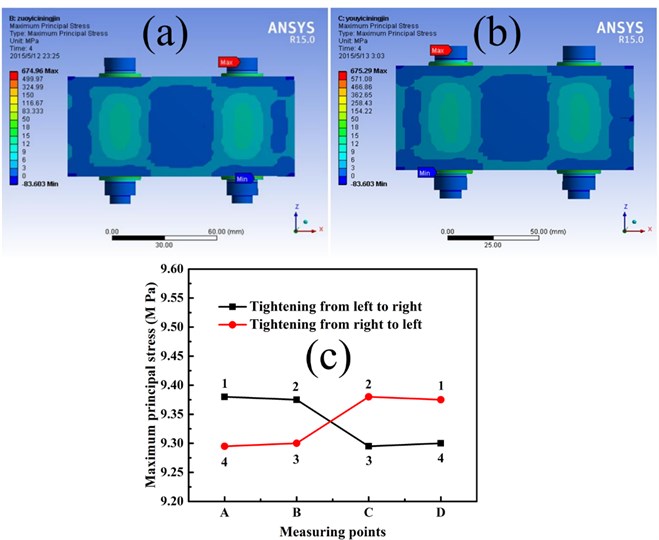
Fig. 6(a) shows the stress distribution of two bolts work-piece under tightening from left to right while that under tightening from right to left is shown in Fig. 6(b). It can be seen in Fig. 6(a) that the stress distribution of the whole two bolts work-piece is comparatively uniform. By comparing the stress distribution in Fig. 6(a) and (b), the result shows that tightening sequences have little influence on stress distribution of two bolts work-piece. The specific stress values of two bolts work-piece are shown in Fig. 6(c). Point A, B, C, and D represent the measuring point 1, 2, 5, and 6, respectively (Our goal is to test the stress on the bolt points rather than the stress between the bolts, so point 3 and 4 are discarded in subsequent tests and simulations). Under the tightening from left to right, the stress value at point A and B are slightly larger than that at point C and D. The opposite is true when tightening from right to left. This is due to the symmetry of two bolts work-piece. In general, there is little difference in the stress values at each measuring point under different tightening sequences.
Fig. 7 shows the stress distribution and stress values of five bolts work-piece under different tightening sqecences. It can be seen in Fig. 7(a), (b), and (c) that the stress distribution have little difference under different tightening sqecences. The specific stress values of five bolts work-piece are shown in Fig. 7(d). Point A, B, C, D, and E represent the measuring point 1, 2, 3, 4, and 5, respectively. In Fig. 7(d), the stress values are decreasing under sequence tightening in five bolts work-piece. Meanwhile, the stress values are decreasing first and then increasing under tightening from ends to middles while that are increasing first and decreasing then under tightening from middle to ends.
Fig. 7Surface stress distribution of two bolts work-piece under bolt assembly processes: a) sequence tightening, b) tightening from the ends to middle, c) tightening from the ends to middle, and d) stress curves of three tightening sequences
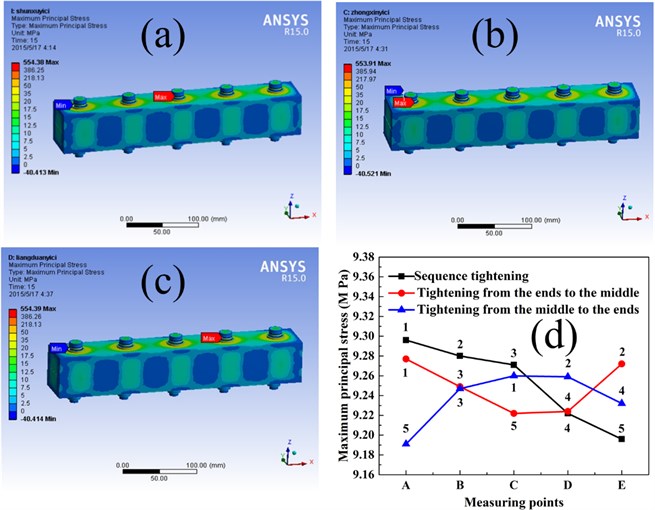
Fig. 8Surface stress distribution of two bolts work-piece under bolt assembly processes: a) sequence tightening, b) symmetric tightening, and c) stress curves of two tightening sequences
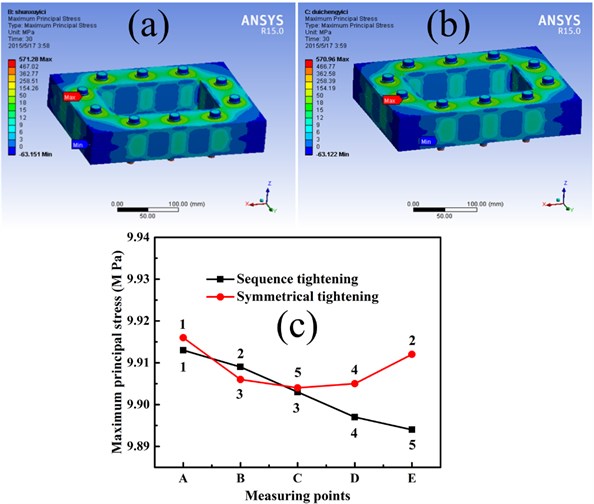
Similarly, Fig. 8(a) shows the stress distribution of frame type bolts work-piece under sequence tightening while that under symmetrical tightening is shown in Fig. 8(b). By comparing the stress distribution in Fig. 8(a) and (b), it found that tightening sequences have little influence on stress distribution of frame type bolts work-piece. The specific stress values of frame type bolts work-piece are shown in Fig. 8(c). Point A, B, C, D, and E represent the measuring point 1, 2, 3, 4, and 5, respectively. Simultaneously, the stress values are decreasing all the time under sequence tightening and that are decreasing first and then increasing under symmetrical tightening.
Comparing with the different tightening sequences and different curve trends, it can be seen that the stress value at measuring point of bolts tightened first is larger than that tightened later.
3.2. Stress results of experiment
The average stress values of the experimental results of two bolts, five bolts and frame type bolts work-piece are shown in Table 1. It can be seen from the Table 1 that the values of the point 3 and 4 in two bolts work-piece and the point 6 and 7 in frame type work-piece are less than other points. Far from the center area of bolt, the stress is less affected by tightening sequence. Therefore, these positions could be neglected in the next experiments.
Table 1Maximum principal stress of measured points in three different bolts work-pieces in experiment
Bolts work-piece | Maximum stress | |||||||
Tightening sequence | Measuring point 1 (M Pa) | Measuring point 2 (M Pa) | Measuring point 3 (M Pa) | Measuring point 4 (M Pa) | Measuring point 5 (M Pa) | Measuring point 6 (M Pa) | Measuring point 7 (M Pa) | |
Two bolts | Tightening from left to right | 7.84 | 7.91 | 1.86 | 1.92 | 7.66 | 7.69 | / |
Tightening from right to left | 7.65 | 7.71 | 1.73 | 1.66 | 7.88 | 7.95 | / | |
Five bolts | Sequence tightening | 8.28 | 8.17 | 8.08 | 8.07 | 7.96 | / | / |
Tightening from ends to middle | 8.23 | 8.11 | 8.05 | 8.03 | 8.09 | / | / | |
Tightening from middle to ends | 8.09 | 8.18 | 8.23 | 8.21 | 8.11 | / | / | |
Frame type bolts | Sequence tightening | 8.69 | 8.53 | 8.55 | 8.39 | 8.19 | 2.03 | 1.98 |
Symmetric tightening | 8.27 | 8.14 | 8.08 | 8.16 | 8.23 | 2.11 | 2.25 | |
According to Table 1, due to the symmetry of the two bolts work-piece, the maximum difference of stress value is small (0.25 MPa). Meanwhile, the maximum difference of stress value in five bolts work-piece in each measuring point is 0.32 MPa under sequence tightening, which is larger than that under tightening from the ends to middle and tightening from the middle to ends. This means that the stress values are more uniform under tightening from the ends to middle and tightening from the middle to ends. Moreover, the maximum difference of stress value in frame type bolts work-piece in each measuring point is 0.5 MPa under sequence tightening, which is larger than that under symmetrical tightening. This means that the stress values are more uniform under symmetrical tightening.
3.3. Comparison between simulation and experiment
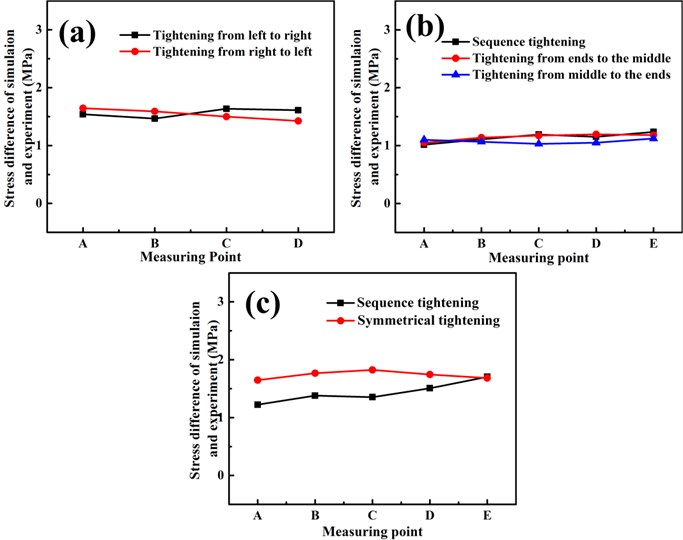
Comparing the results of simulation and experiment, the difference of stress values are showed by the Fig. 9. By comparing the difference of simulation and experiment in the Fig. 9, it can be found that the simulation results are larger than the experimental data. This is due to the assembly errors in experiment, which are not taken into account in the simulation. Those errors include the patch error of strain gauge, the non-uniformity of the work-piece itself and the error of the experimental instrument itself. However, the tendency of the stress values in experiment is consistent with that in simulation.
Fig. 9Stress difference between simulation and experiment in three different bolts work-pieces under different tightening sequences
3.4. Stress variation mechanism
Taking the above results into consideration, it can be easily found the stress value at measuring point of bolts tightened first is larger than that tightened later.
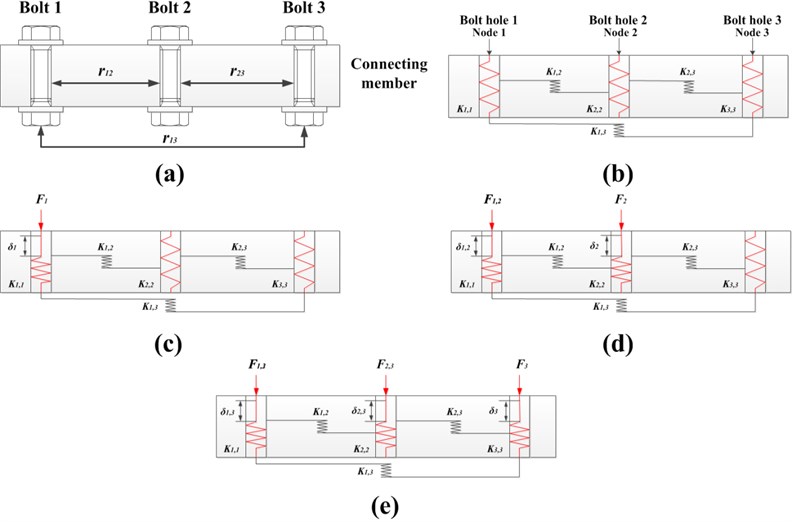
According to the research of bolt preloading by Wang [26], the reason of the slight change of stress value is considered in relation to the bolt preloading sequence. The different bolt preloading sequences leading to the different force in each bolt, this result in a change in the magnitude of the stress value. In this article, the three bolt work-piece is taking as an example to explain the influence of different bolt pre-tightening sequence on its pre-tightening force. The Fig. 10 shows the three bolts assembly process of sequential tightening. The simplified mechanical model of the three bolt work-piece is shown in Fig. 10(a) and corresponding spring-node model is shown in Fig. 10(b). The Ki,j represents the elastic interaction stiffness between different bolts. The Node 1, Node 2 and Node 3 located at the center of bolt 1, blot 2 and bolt 3 are loading point of force. K1,1, K2,2 and K3,3 are the compression stiffness of bolt 1, bolt 2 and bolt 3 while K1,2, K2,3 and K1,3 are the interaction stiffness between bolt 1 and bolt 2, bolt 2 and bolt 3, and bolt 1and bolt 3, respectively.
Fig. 10(c)-(e) shows the sequence preloading the three bolts from left to right. There are two assumptions: (i) only elastic deformation is concerned for the connecting member and the blots during multi-bolt preloading; (ii) the connected body is only subjected to the bolt axial tightening force.
As shown by Fig. 10(c), (d) and (e), the bolt 1, bolt 2 and bolt 3 are tightened by preload F1, F2 and F3, respectively. The bolt 1 is tightened by F1. The elastic displacement δ1 located at node1 due to F1 is given by Eq. (10):
Then bolt 2 is tightened by F2. δ1,2 is the elastic displacement variation caused byF2 and bolt 1 preload variation :
The elastic deformation of bolt 1 is :
, , and are the stiffness, Young’s modulus, effective bolt length and nominal area of bolt 1, respectively.
According to the theory of elastic mechanics, the elastic variation of node 1 is equal to the elastic deformation of bolt 1:
Through the Eqs. (10) to (12), the can be obtained:
The residual preload of bolt 1 after tightening bolt 2 is:
In the same reason, the elastic variation of node 1 (node 2) is equal to the elastic deformation of bolt 1 (bolt 2) when the bolt 3 is tightened:
and are the residual preload variation of bolt 1 and bolt 2 after tightening bolt 3. and are the displacement variation of node 1 and node 2 after tightening bolt 3. and are the elastic deformation of bolt 1 and bolt 2 after tightening bolt 3.
The variation of residual preload and of bolt 1 and bolt 2 are obtained:
Therefore, the residual preloads of bolt-1, bolt-2 and bolt-3 are given:
According to the residual preloads of each bolt in the three-bolt work-piece, the residual preloads of each bolt in the - bolt work-piece can be obtained.
The compression stiffness of the bolt- joint is assumed as (1, 2, 3…). The bolt- is tightened by :
where is node- displacement without the effect of elastic interaction.
According to the Eqs. (14-20), the residual preloads of bolts- (1, 2, 3,…, ) are obtained:
Fig. 10Schematic diagram of elastic interaction for 3-bolt joint: a) bolts layout, b) spring-node model, c) tightening bolt-1, d) tightening bolt-2, and e) tightening bolt-3
The residual preload of bolt- after tightening bolt- is . The bolt- preload variation after tightening bolt-() is . The bolt- preload variation after tightening bolt- is .
The stress variation of every bolt is effected on the preload variation of every bolt.
According to above preloading of the simulation and experiment, the is the same in every bolt tightening assembly process. Therefore, the residual preload of bolt- is effected by regardless other factors.
The stress generated by residual preload also is effected by . It is assumed that the bolt internal stiffness under the same distance is the same. Therefore, the stress value variation is produced by the residual preload variation. That is why the stress values of bolts tightened first are larger than that tightened later.
4. Conclusions
In order to study the effect of different bolts tightening sequences on the stress of bolts work-pieces, the finite element stress simulation and stress test experimental methods are adopted. Three types of bolt work-piece: two bolts, five bolts, and frame type bolts work-piece are studied under different tightening sequences. According the stress distribution and values of the different bolt work-pieces under different bolt assembly sequences by simulation and experiment, the following conclusions can be drawn:
1) The stress distribution tendency of different bolt work-pieces under different bolt assembly sequences has no great difference, which indicates that the different bolt assembly sequences have not significant effect on the stress distribution.
2) The tightening sequences has no effect on two bolts work-piece due to the symmetry of work-piece.
3) In five bolts work-piece, the variation range of stress under tightening from ends to middle is smaller than that under sequence tightening, which indicates that better stress uniformity is obtained under tightening from ends to middle in five bolts work-piece.
4) Similarly, in frame bolts work-piece, the variation range of stress under symmetrical tightening is smaller than that under sequence tightening, which indicates that better stress uniformity is obtained under symmetrical tightening in frame type bolts work-piece.
5) Through the analysis of residual preload variation in each bolt, that the stress values of bolts tightened first are larger than that tightened later can be explained.
This work discusses the influence of different bolt tightening sequences on the stress value and distribution of bolt work-piece. The above conclusions are significant to improve the assembly process of manufacturing industry. After adjusting the bolt tightening sequence, the stress value of whole work-piece reduces. It is conducive to production and manufacture of high precision equipment and instruments. Through the optimization of bolt tightening process, further reducing the stress value of work-piece will be the future research direction.
References
-
Wang Z. Y., Tizani W., Wang Q. Y. Strength and initial stiffness of a blind-bolt connection based on the T-stub model. Engineering Structures, Vol. 32, 2010, p. 2505-2517.
-
Krishnamurthy N. Modelling and prediction of steel bolted connection behavior. Computers and Structures, Vol. 11, 1980, p. 75-82.
-
Ju S.-H., Fan C.-Y., Wu G. H. Three-dimensional finite elements of steel bolted connections. Engineering Structures, Vol. 26, 2004, p. 403-413.
-
Wang Ying, Qin Xuxin, Gao Guangdong Intrinsic frequency analysis for screw bolt based on pre-tightening force. Coal Mine Machinery, Vol. 5, 2013, p. 135-136.
-
Xin Peng, Wan Yiqiang, Xu Zhou finite element modeling and simulation analysis of bolted joints. Vehicle and Power Technology, Vol. 2, 2015, p. 58-62.
-
Bibel G. D., Ezell R. M. An improved flange bolt-up procedure using experimentally determined elastic interaction coefficients. Journal of Pressures Vessel Technology, Vol. 114, 1992, p. 439-443.
-
Takaki T., Fukuoka T. Finite element simulation of bolt-up process of pipe flange connection. Journal of Pressure Vessel Technology, Vol. 123, Issue 3, 2001, p. 282-287.
-
Fukuoka T., Takaki T. Finite element simulation of bolt-up process of pipe flange connections with spiral wound gasket. Journal of Pressure Vessel Technology, Vol. 123, Issue 5, 2003, p. 371-378.
-
Xie Xiaobiao The Finite Element Analysis and Experimental Study of Friction High-Strength Bolt Connection under Different Preload. Nan Chang University, Nan Chang, 2014.
-
Cheng Chengjun, Yang Guodong, Chang Dongfang FEM based elastic interaction analysis of assembly and fastening. Journal of Wuhan University of Technology, Vol. 33, 2011, p. 131-135.
-
Cheng Chengjun, Yang Guodong, Chang Dongfang Assembly connection design orienting to sealing. Journal of Xi An JiaoTong University, Vol. 46, 2012, p. 75-83.
-
Abid M., Wajid H. A., Abbas A., Mehmood Y. Assembly performance of a gasketed bolted flanged pipe joint using different bolt tightening strategies. Iranian Journal of Science and Technology: Transactions of Mechanical Engineering, Vol. 39, 2015, p. 253-260.
-
Coria I., Iñigo Martín, Bouzid A. H., Heras I., Abasolo M. Efficient assembly of bolted joints under external loads using numerical FEM. International Journal of Mechanical Science, Vol. 142, Issue 143, 2018, p. 575-582.
-
Wang Y. Q., Wu J. K., Liu H. B., Kuang K., Cui X. W., Han L. S. Analysis of elastic interaction stiffness and its effect on bolt preloading. International Journal of Mechanical Science, Vol. 130, 2017, p. 307-314.
-
Zhao Y., Yang C., Cai L., Shi W., Liu Z. Surface contact stress-based nonlinear virtual material method for dynamic analysis of bolted joint of machine tool. Precision Engineering, Vol. 43, 2015, p. 230-240.
-
Gao Yongtao, Wu Shunchuan, Sun Jinhai Application of the pre-stress bolt stress distributing principle. Transactions of Beijing Institute of Technology, Vol. 24, Issue 4, 2002, p. 387-390.
-
Lei S., Mao K., Li L., Xiao W., Li B. Sensitivity analysis of modal assurance criteria of damped systems. Journal of Vibration and Control, Vol. 23, 2016, p. 632-644.
-
Esam Alawadhi Finite Element Simulations Using ANSYS, Second Edition, 2015.
-
Yue T., Wahab Abdel M. Finite element analysis of fretting wear under variable coefficient of friction and different contact regimes. Tribology International, Vol. 107, 2017, p. 274-282.
-
Zhang L. Z., Liu Y., Sun J. C., Ma K., Cai R. L., Guan K. S. Research on the assembly pattern of MMC bolted flange joint. Procedia Engineering, Vol. 130, 2015, p. 193-203.
-
Coria I., Abasolo M., Olaskoaga I., Etxezarreta A., Aguirrebeitia J. A new methodology for the optimization of bolt tightening sequences for ring type joints. Ocean Engineering, Vol. 129, 2016, p. 441-450.
-
Al-Otaibi Hanan, Akeel Riyadh The effects of two torque values on the screw preload of implant-supported prostheses with passive fit or misfit. International Journal of Oral and Maxillofacial Implants, Vol. 29, 2014, p. 1058-1063.
-
Yu Q. M., Zhou H. L. Finite element study on pre-tightening process of threaded connection and failure analysis for pressure vessel. Procedia Engineering, Vol. 130, 2015, p. 1385-1396.
-
Yan Haokai, Reng Jianguo Working principle of electric resistance strain gauge. Metrology and Measurement Technique, Vol. 4, 2013, p. 12-16.
-
Wang Weiguo, Zhu Shiguo, Rao Daqing Measuring the sensitivity of strain resistance pressure sensors. Physics Experiment, Vol. 11, 2018, p. 24-27.
-
Xue Chuang, Jia Jianjun, Shu Rong Bolted joint models of finite element assemblies. Science Technology and Engineering, Vol. 6, 2006, p. 825-828.
-
Wang Y. Q., Wu J. K., Liu H. B., Xu S.-T. Modeling and numerical analysis of multi-bolt elastic interaction with bolt stress relaxation. Proceedings of the Institution of Mechanical Engineers Part C Journal of Mechanical Engineering Science, Vol. 230, 2016, p. 2579-2587.
Cited by
About this article
The work of this paper was partially supported by the National High-tech Research and Development Plan (863 Plan) (No. 2015AA043302). The authors wished to acknowledge the help and advice by Shai Zhang and Dr. Sheng Lei in the strain and stress experiments.

