Abstract
The vibration signal of the planetary gearbox is complex and mixed with high noise owing to the variable operating conditions and complex operating environments. However, it is difficult to obtain accurate diagnostic results. To improve the efficiency of feature extraction and fault diagnosis, a fault diagnosis method based on improved multi-resolution singular value decomposition (IMRSVD), variational mode decomposition (VMD), dispersion entropy (DE), and LSSVM with multi-channel vibration data is proposed. Firstly, an index based on signal energy is proposed to improve the self-adaption of MRSVD in decomposition times, and IMRSVD is applied to eliminate noise in the vibration signal. Secondly, a novel composite feature extraction method is proposed based on the VMD-DE and multi-channel vibration data. Finally, the fault diagnosis of the planetary gearbox was achieved using the LSSVM with composite features. The proposed method is validated on actual planetary gearbox datasets, and the results indicate that the proposed method can achieve higher fault diagnosis accuracy.
1. Introduction
Planetary gearboxes have many advantages, such as a compact structure, small volume, and high transmission efficiency. They have been widely used in industries, such as aerospace, wind power generation, and metallurgy. Planetary gearboxes are typically used in mechanical transmission systems in complex operating environments, which can cause frequent malfunctions [1]. Common faults in planetary gearboxes include broken gear teeth, wear, cracks, and missing teeth [2]. Failures of the planetary gearbox will influence the transmission efficiency of the system, and may even lead to serious and larger-scale accidents if faults cannot be detected in early time. Therefore, there is an urgent need to study fault-diagnosis methods for planetary gearboxes.
Feature extraction is an important aspect of fault diagnosis. Owing to the variation in the time-domain and frequency-domain characteristics of vibration signals under different operating conditions, the vibration signal is usually collected to monitor the operational status of the rotating machine [3]-[4]. The structure of a planetary gearbox is complex and consists of sun gear, multiple planetary gears, ring gears, planetary carriers, and planetary bearings. The transmission path between the fault vibration component and the sensor varies with time, and the vibration signal is more complex than that of other rotating machines [5]. Traditional vibration signal analysis methods, such as time-domain and frequency-domain analyses, make it difficult to extract effective fault characteristic information. The operating conditions of the planetary gearbox are variable and the environment is harsh, which leads to high noise in the vibration signal.
Signal denoising is necessary for feature extraction owing to the influence of high noise. Singular value decomposition (SVD) has significant effects on denoising and periodic component extraction, and is suitable for the vibration signals of planetary gearboxes [6]-[7]. SVD cannot be used to extract weak signals in strong background noise and leads to the problem of dimension disaster when the dimension of the phase space is too large [8]. Multi-resolution singular value decomposition (MRSVD) is an improved signal processing method based on SVD that can overcome the problem of dimension disaster, and MRSVD has a strong ability for weak fault feature extraction [9]-[10]. However, there is a lack of adaptive adjustment for the decomposition times. Time-frequency processing methods have been widely applied for planetary gearbox vibration signals as its complex and multi-mode [11]-[17], such as wavelet transform (WT), empirical mode decomposition (EMD), and variational mode decomposition (VMD). The performance of WT depends on the setting of the basis function, which leads to a lack of self-adaptability. EMD is an adaptive signal-processing method that decomposes a signal into several intrinsic mode functions (IMFs). However, it encounters the problems of mode mixing and endpoint effects. VMD can overcome the problems of endpoint effects and mode mixing, and it has strong resistance to noise [18]. However, the analysis results of time-frequency processing methods cannot describe the operation status directly because of the complex operation conditions and strong environmental interference of the planetary gearbox. Therefore, it is necessary to develop a feature-description method. The entropy value of the vibration signal is sensitive to changes in operating conditions [19]-[23]. Entropy-based feature extraction methods based on entropy have been widely proposed for fault diagnosis in rotating systems, such as sample entropy (SE), permutation entropy (PE), and dispersion entropy (DE). DE is a useful tool for amplifying slight changes in signals because it has a faster calculation speed and is less affected by noise than other entropy methods [24]. In addition, the transmission paths of the vibration signals of planetary gearboxes are extremely complex, and it is difficult to fully describe the vibration characteristics using a single-channel signal. Thus, feature extraction using multichannel data remains an important issue.
After the feature extraction, classification methods were applied to achieve fault-type identification. Machine learning methods based on fault features have been mainstream diagnosis methods, such as artificial neural network (ANN), K-nearest neighbor (KNN), and support vector machines (SVM) [25]-[30]. ANN have strong nonlinear processing capabilities, but they require considerable experience and computation to achieve good classification results. KNN is a simple classification algorithm that is easy to implement; however, it is highly sensitive to the data distribution. SVM is a classification method suitable for small samples, and it can overcome the problems of overfitting and local optima in fault diagnosis. However, the computational efficiency decreases with an increase in the data scale. The least squares support vector machine (LSSVM) is an improved SVM method that transforms the inequality constraint problem in SVM into an equality constraint problem, and the computational efficiency is improved [31].
Based on the above analysis, a fault diagnosis method based on an improved MRSVD (IMRSVD), VMD-DE, and LSSVM with multi-channels vibration data is proposed for the planetary gearbox. The main contributions of this paper are as follows. An index based on the signal energy is proposed to improve the self-adaptation of MRSVD in times of decomposition. A novel composite feature extraction method based on VMD-DE with multi-channels vibration data was proposed. Fault diagnosis of the planetary gearbox was achieved using the LSSVM with the proposed composite features.
The rest of this paper is organized as follows. Related theory is introduced in Section 2. In Section 3, the proposed fault diagnosis method is described. In Section 4, the experiments conducted to verify the advantages of the proposed method are presented. Finally, conclusions are drawn in Section 5.
2. Related theory
2.1. MRSVD
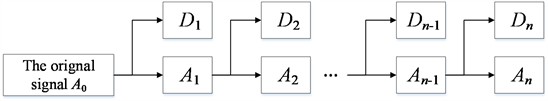
MRSVD is an improved signal processing method based on SVD [9]. SVD requires the construction of a phase space with high dimensions, which leading to dimensional disasters and high computational complexity. The phase space of MRSVD is built by recursion, and multi-resolution SVD is applied to obtain an approximate signal and detail signals, as shown in Fig. 1.
Fig. 1The process of the MRSVD
The detailed decomposition process of MRSVD for time series is as follows.
A two-dimensional Hankel matrix is built:
The singular value decomposition of can be described as:
where, and are the approximate signal and detail signal of the first decomposition, respectively, and are the two singular values of the first decomposition, .
According to the process shown in Fig. 1, the approximate signal can be iteratively decomposed as:
The original signal can be decomposed into an approximate signal and several detailed signals that describe the original signal at different scales. The MRSVD method does not lead to dimensional disasters, because only a two-dimensional Hankel matrix is required to decompose in each iteration. Therefore, MRSVD has an advantage in terms of calculation speed.
2.2. VMD
VMD is a signal-processing method suitable for nonlinear and nonstationary signals. A signal can be decomposed into several IMFs that contain its own central frequency and frequency bands [16].
The model of the VMD can be described as:
where, is the original signal in the time domain, represents the -th IMF of the original signal, is the center frequency of , is the number of IMFs, represents the calculation of the partial derivatives of time, is the unit pulse function.
The extended Lagrangian function is applied to solve Eq. (4) as:
where is the penalty factor, represents the Lagrange multiplier.
The saddle point of Eq. (5) can be searched by updating and as follows:
During the iterative solution of the VMD, the center frequency and bandwidth of each IMF are updated until the iteration termination condition is satisfied.
2.3. Dispersion entropy
Dispersion Entropy (DE) is an index that reflects the complexity or irregularity of a time series. The detailed calculation process of DE for the time series is as follows:
Step 1: Time series is mapped to the range of 0 to 1 using a normal distribution function as follows:
where, is the variance value of the time series, is the mean value of the time series.
Step 2: Series continues to be mapped to different categories as follows:
where, is the rounding function, is the number of categories.
Following the above two steps, each element of the time series is mapped to the categories .
Step 3: The embedding vector is built as follows:
where, and are the embedding dimension and time delay respectively.
Step 4: The dispersion pattern is described as follows:
As the dispersion pattern is composited of bits, and each bit can be formed from 1 to . The number of dispersion patterns is .
Step 5: The relative frequency of each dispersion pattern is calculated as follows:
where, the represents the number of embedding vectors mapped to the dispersion pattern.
Step 6: The dispersion entropy value is calculated according to Shannon Entropy as follows:
The DE value represents the degree of irregularity. DE can obtain the maximum value when each dispersion entropy has the same probability, such as a noise signal. DE can obtain the minimum value for the periodic signals.
3. The proposed fault diagnosis method
In this study, a novel composite feature extraction method based on an improved MRSVD (IMRSVD), VMD-DE with multi-channels signals is proposed. A fault diagnosis method based on the proposed composite feature and LSSVM was proposed for the fault diagnosis of planetary gearboxes. The fault diagnosis flowchart is shown in Fig. 2.
Fig. 2The flowchart of the proposed fault diagnosis method
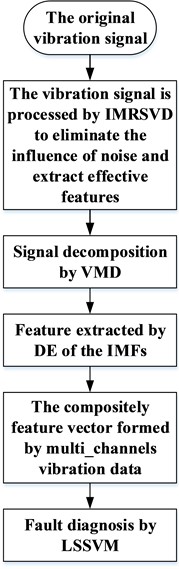
The detailed steps of the proposed method are as follows.
Step 1: An IMRSVD is proposed to process the original vibration data.
As MRSVD needs to decompose the original signal iteratively, the number of iterations determines the effect of processing directly. Too many iterations will lead to the loss of important information, and noise cannot be effectively removed if the number of iterations is too low. The iteration of the original MRSVD is preset based on personal experience, which is unstable and has no adaptability.
An IMRSVD was proposed with self-adaption based on the analysis of signal energy. The detailed signals of the initial iterations mainly contained noise components and had a larger signal energy. If MRSVD is over-decomposed, the signal energy of the detail signal suddenly decreases. Thus, the iteration of MRSVD is self-adaption as follows:
(a) In the -th iteration of MRSVD, the time series is processed by MRSVD, and the detailed signal and approximate signal are obtained.
(b) The signal energies of and are calculated as follows:
(c) The number of iterations corresponding to the curve inflection point of is suitable for MRSVD. Thus, the iterations can be determined as follows:
Step 2: VMD is applied to decompose the signal into several IMFs that include different characteristic frequencies.
Step 3: The DE values of the IMFs were calculated to reflect the changes in the operational status of planetary gearboxes.
Step 4: A composite feature vector is formed by the DE values of the different IMFs of the multi-channels vibration data. The feature vector can be described as follows:
where, represents the DE values of the IMFs of the -th signal channel.
Step 5: The LSSVM is applied for fault diagnosis using the proposed feature vector.
4. Experiment study of fault diagnosis in planetary gearbox
4.1. The fault diagnosis information of planetary gearbox
The failure dataset of the planetary gearbox used in this study was provided by Liu et al. in their research [5]. The failure dataset was collected from a wind turbine drive test rig consisting of a planetary gearbox, motor, fixed-shaft gearbox, and load. The planetary gearbox consisted of four planet gears and a sun gear. The planetary gearbox operates under five different conditions: normal, gear with a broken tooth, wear gear, crack occurs in the root, and missing one tooth. The planetary gearbox parameters are presented in Table 1.
The vibration datasets collected by the acceleration sensors in the and directions were applied for fault diagnosis to verify the proposed method in this study. The time-domain waveforms of the vibration data under five different operating conditions are shown in Fig. 3.
As shown in Fig. 3, the time-domain feature cannot be used to distinguish between different operating conditions.
The vibration data in the and directions were divided into 100 groups of sample sets for each operation condition without repetition, and each group of sample sets included 4096 sample points. In this study, the sample sets were used for feature extraction and fault diagnosis.
Table 1The parameters of the planetary gearbox
Tooth number | Sun gear | 28 |
Ring gear | 100 | |
Planet gear | 36 | |
Rotating frequency of sun gear | 20 Hz | |
Meshing frequency | (175/8) 437.5Hz | |
Fig. 3The time-domain vibration data of the planetary gearbox in five different conditions
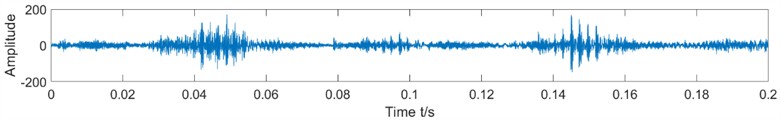
a) Normal
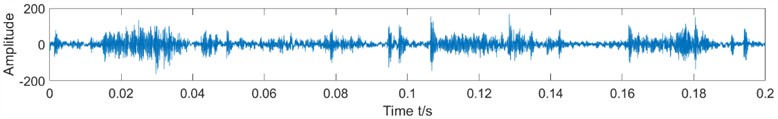
b) Gear with a broken
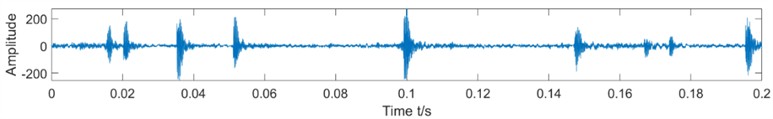
c) Missing one tooth
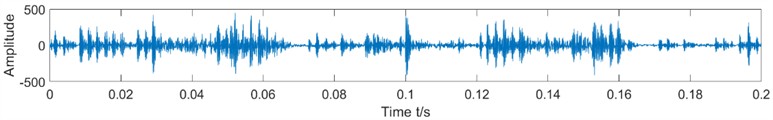
d) Wear gear
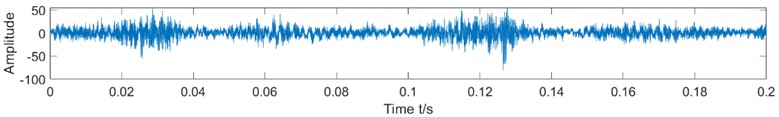
e) Crack occurs in the root
4.2. Analysis of the proposed IMRSVD
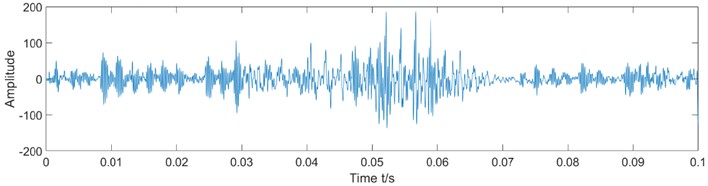
In a rotating system, fault characteristics are often reflected in the frequency. The power spectrum was used to observe the relationship between the fault type and characteristic frequency. In this section, the wear gear vibration data are analyzed as an example. The time-domain waveform and the power spectrum are shown in Fig. 4.
As shown in Fig. 4, the peak value of the power spectrum was approximately 4260 Hz. The rotating and meshing frequencies can hardly be found, and the power spectral density (PSD) of the characteristic frequency is almost submerged.
Fig. 4Time-domain waveform and power spectrum of the wear gear vibration data
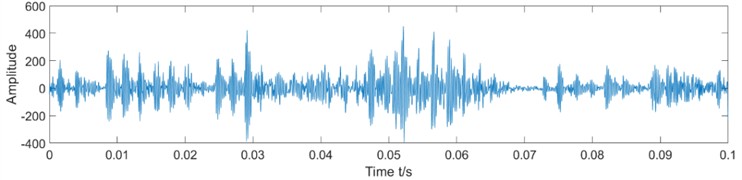
a) Time-domain waveform
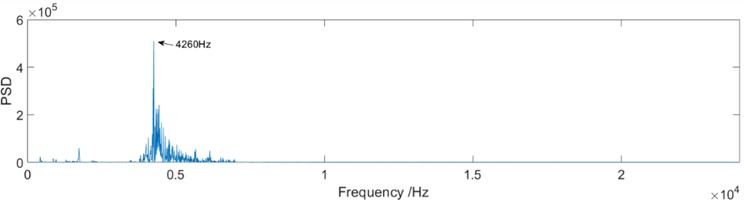
b) Power spectrum
Therefore, the proposed IMRSVD method was applied to process the original vibration signal. The time-domain waveform and power spectrum of the wear gear vibration signal processed by IMRSVD are shown in Fig. 5.
Fig. 5Time-domain waveform and power spectrum of the wear gear vibration signal after IMRSVD processing
a) Time-domain waveform
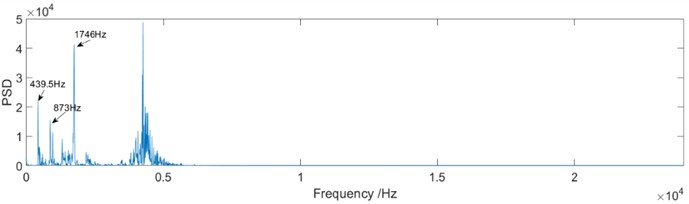
b) Power spectrum
As shown in Fig. 5, the characteristic frequency is displayed after IMRSVD processing. Several characteristic frequencies were obtained, such as 439.5 Hz, 873, and 1746 Hz. As stated above, the meshing frequency of the planetary gearbox was 437.5 Hz, and the observed characteristic frequencies represented the basic frequency and harmonics. The results indicate that the IMRSVD method can effectively remove interference and extract useful features that reflect the operation characteristics of the planetary gearbox.
4.3. Analysis of feature extraction
Because the DE value of the vibration signal can reflect the complexity and variation of the signals, it can be used as a feature for fault diagnosis. In this section, features based on the DE value of the sample set with different composition structures are analyzed.
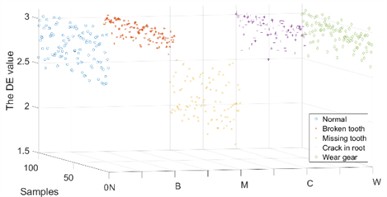
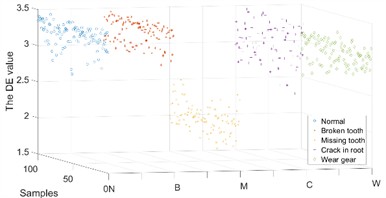
Firstly, the DE values of the vibration data in the and directions were calculated. The results are shown in Fig. 6.
Fig. 6The DE value of vibration signal under different operating conditions
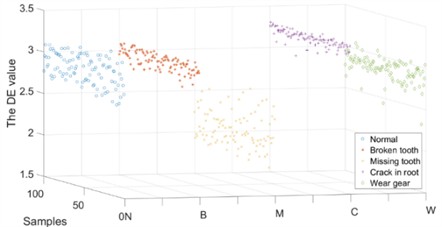
a) channel
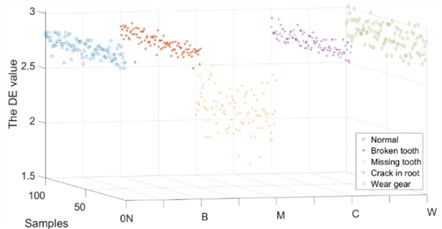
b) channel
It can be observed that the DE value of the original vibration signal shows little difference under different operating conditions. Missing tooth conditions can be classified using DE values. However, the other four operating conditions were difficult to distinguish. Therefore, the single DE feature of the original vibration signal is not suitable for fault diagnosis of planetary gearboxes.
As stated in Section 4.2, the vibration signal has several characteristic frequencies, and VMD is utilized to decompose the original vibration signal. The decomposition performance of the VMD is significantly affected by the modal number and control parameter . In this paper, the center frequency method and minimum envelope entropy were applied to determine the modal number and control parameter .
Firstly, the initial value of was set to 2000, and the center frequencies under different modal numbers are listed in Table 2.
Table 2Center frequencies under different modal number K
Center frequencies (Hz) | ||||||
3 | 691.72 | 1750.34 | 4333.73 | |||
4 | 684.72 | 1736.25 | 4131.70 | 4544.48 | ||
5 | 457.94 | 971.94 | 1700.83 | 2394.46 | 4342.61 | |
6 | 456.15 | 965.90 | 1696.65 | 2340.55 | 4246.69 | 4808.43 |
The results show that model mixing appears when the modal number is set as 6, and the modals with center frequency of 4246.69 Hz and 4808.43 Hz are too close. The decomposition performance was better when the number of modal was five.
Secondly, the initial value of was set to 5, and the envelope entropy of the IMFs with different control parameters was calculated. with the minimum envelope entropy is a suitable control parameter. Based on the analysis, the parameters were set to and 1723.
The decomposition results of the wear gear vibration signal are shown in Fig. 7, and the results of the wear gear vibration signal after IMRSVD processing are shown in Fig. 8.
Fig. 7The IMFs and Its PSD of the wear gear vibration signal
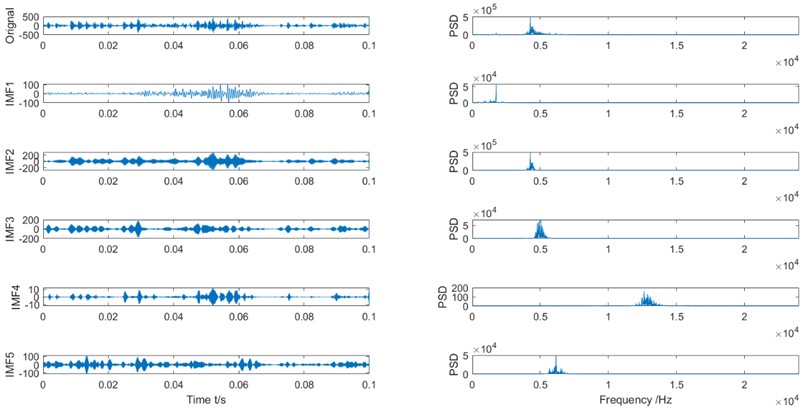
Fig. 8The IMFs and Its PSD of the wear gear vibration signal after IMRSVD processing
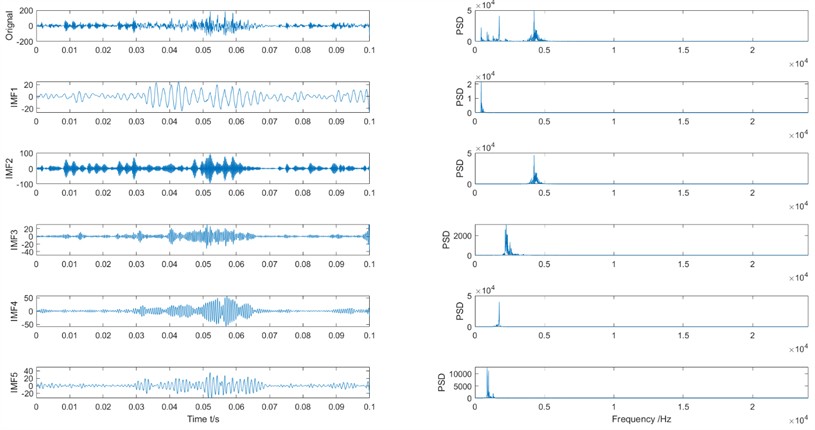
It can be seen that the VMD can decompose the original signals into IMFs with different frequency characteristics. The center frequency of the IMFs of the original vibration signal has little relationship with the characteristic frequency, which means that the original vibration signal has many interfering components. As shown in Fig. 8, the signal after IMRSVD processing contains more characteristic frequencies. The center frequency of the IMFs represents the characteristic frequency of the planetary gearbox, which means that the IMFs have useful information for fault diagnosis. The results further proved the effectiveness of the proposed IMRSVD method.
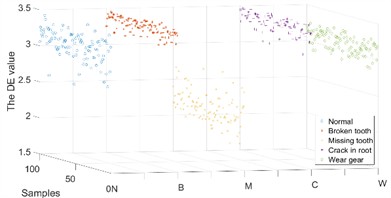
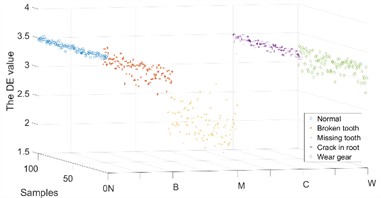
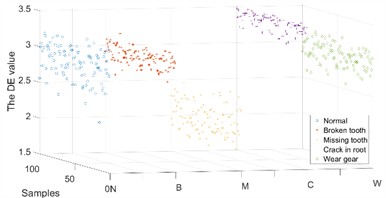
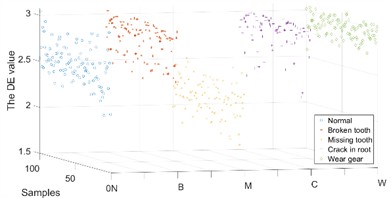
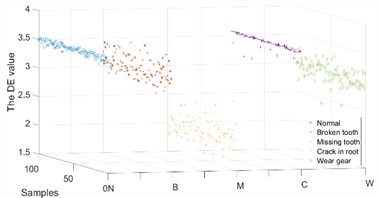
Because the IMFs contain different characteristic frequencies, the DE of the IMFs can be used as a feature for fault diagnosis. Some of the DE values of the IMFs of the and direction samples under different operating conditions are shown in Figs. 9-10.
The DE values of different IMFs under different operating conditions have differences and connections as well as performance in the and directions. Therefore, a composite feature formed by the DE values of different IMFs in different directions was proposed for fault diagnosis.
Fig. 9The DE value of the IMFs in X channel
a) IMF 1
b) IMF 2
c) IMF 3
d) IMF 4
Fig. 10The DE value of the IMFs in Y channel
a) IMF 1
b) IMF 2
c) IMF 3
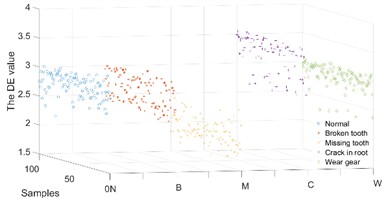
d) IMF 4
4.4. Analysis of the proposed fault diagnosis method
The verification of the proposed fault-diagnosis method is presented in this section. A Back propagation (BP) neural network, SVM, and LSSVM were applied for fault classification. BP and SVM refer to the functional functions built into MATLAB. The BP parameters were set as follows: hidden layer = 20, learning rate = 0.001, and training time = 1000. The RBF kernel function was selected for the SVM. The toolbox LSSVMlabv1_8_R2009b_R2011a was utilize according to http://www.esat.kuleuven.be/sista/lssvmlab. This toolbox has ‘tunlssvm’ function for cross validation optimization of hyper parameters of LSSVM model which is very convenient to use.
Because the classification methods applied in this study are machine learning algorithms, the sample datasets were divided into training and testing sets. The training set was formed using the vibration data and operation labels of the 60 groups of sample sets for each operation condition. The remaining 40 groups of sample sets for each operating condition and their labels were used as testing sets. The classification of the sample data is presented in Table 3.
Table 3Classification of sample data
Operation condition | Number of train sample | Number of test sample | Label |
Normal | 60 | 40 | 1 |
Broken tooth | 60 | 40 | 2 |
Missing tooth | 60 | 40 | 3 |
Crack | 60 | 40 | 4 |
Wear gear | 60 | 40 | 5 |
4.4.1. The performance of IMRSVD for fault diagnosis
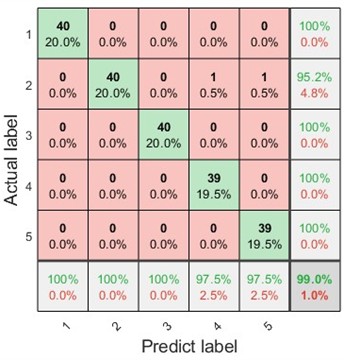
The fault diagnosis results with and without IMRSVD were compared to verify the effectiveness of IMRSVD in the proposed method. Except for the difference in signal processing using IMRSVD, the fault diagnosis process for comparison is shown in Fig. 2. Firstly, VMD was applied for the signal decomposition of the double-channel vibration signal. Secondly, DE is utilized for the feature extraction of the IMFs. Finally, the LSSVM was used for classification under different operating conditions. Confusion diagrams of the fault diagnosis results are shown in Fig. 11.
The results showed that the diagnostic accuracy without IMRSVD was 97 %. There were four normal conditional samples, and two crack samples were classified into the broken tooth condition. The proposed method with the IMRSVD process classified all the samples correctly, and the diagnostic accuracy was 100 %. The results indicate that IMRSVD can improve diagnosis accuracy.
Fig. 11The confusion diagram of fault diagnosis

a) Without IMRSVD
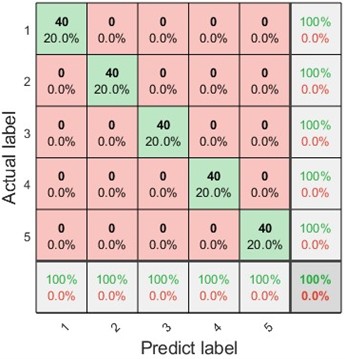
b) With IMRSVD
4.4.2. The performance of different entropy for fault diagnosis
The fault diagnosis efficiency based on different entropies was also discussed. SE and PE were applied to replace DE in the proposed method. Confusion diagrams of the fault diagnosis results based on the SE and DE are shown in Fig. 12.
As shown in Fig. 11(b) and Fig. 12, the diagnostic accuracies based on SE, PE, and DE were 99 %, 99 %, and 100 %, respectively. The results indicate that the DE-based method is more suitable than the proposed fault diagnosis method.
Fig. 12The confusion diagram of fault diagnosis with different entropy
a) SE
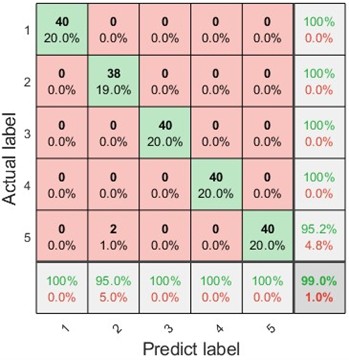
b) PE
4.4.3. The effect analysis of different signal source for fault diagnosis
The accuracies of fault diagnosis using single-channel vibration data and multi-channel vibration data using the proposed method were compared. Confusion diagram of the fault diagnosis results with the single-channel vibration data is shown in Fig. 13.
Fig. 13The confusion diagram of fault diagnosis by single channel vibration data
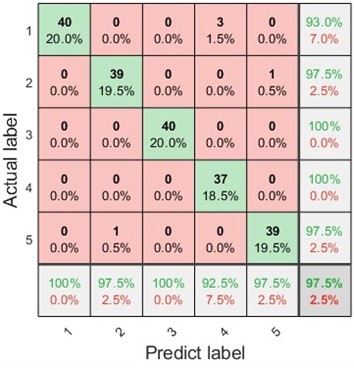
The results show that five samples were misclassified in the fault diagnosis using a single-channel signal. As shown in Fig. 11(b) and Fig. 13, the proposed method with multichannel signals has higher accuracy.
4.4.4. The efficiency analysis of different fault diagnosis methods
The efficiency of the proposed method was analyzed, and fault diagnosis methods with different combinations were compared. Contrastive feature extraction methods include IMRSVD, VMD, SE, PE, and DE. Contrastive classification methods include the BP, SVM, and LSSVM. The accuracy of fault diagnosis using the different methods is presented in Table 4.
Table 4Fault diagnosis results by different methods.
Data | Feature extracted method | Classification method | ||
BP | SVM | LSSVM | ||
Single-channel | VMD+SE | 92.5 % | 95.0 % | 95.0 % |
VMD+PE | 79.5 % | 64.5 % | 93.5 % | |
VMD+DE | 82.5 % | 86.0 % | 87.0 % | |
IMRSVD+VMD+SE | 97.0 % | 97.5 % | 97.0 % | |
IMRSVD+VMD+PE | 97.5 % | 88.5 % | 97.5 % | |
IMRSVD+VMD+DE | 88.5 % | 97.5 % | 97.5 % | |
Multi-channels | VMD+SE | 96.0 % | 98.0 % | 97.5 % |
VMD+PE | 87.0 % | 76.5 % | 96.5 % | |
VMD+DE | 86.0 % | 90.5 % | 97.0 % | |
IMRSVD+VMD+SE | 99.0 % | 99.0 % | 99.0 % | |
IMRSVD+VMD+PE | 99.0 % | 97.0 % | 99.0 % | |
IMRSVD+VMD+DE | 97.5 % | 99.0 % | 100 % | |
The following conclusions can be drawn from Table 4:
(a) The diagnosis accuracy based on a multichannel signal was higher than that based on a single channel for the same diagnostic method.
(b) IMRSVD can significantly improve fault diagnosis accuracy, particularly for diagnosis methods with PE and DE features.
(c) Fault diagnosis methods with SE features have the most stable diagnosis accuracy, which increases to 99 % with IMRSVD processing and multichannel data.
(d) LSSVM has a better classification performance than BP and SVM.
Because the proposed method involves multiple calculation steps, the calculation time of each step of the proposed method was counted and compared with similar methods. The algorithms in this study were run on an Intel i7-8700 3.2 GHz in MATLAB 2022a. The average calculation times per sample with multiple channels for the fault diagnosis are listed in Table 5.
Table 5Average calculation time of per sample
Method | Detail discerption | Time cost of per sample with multi-channel (s) |
IMRSVD | / | 0.032 |
VMD | / | 2.004 |
Entropy | SE | 1.845 |
PE | 0.066 | |
DE | 0.006 | |
BP | Train | 10.473 (300 sample in total) |
Predict | 0.000 | |
SVM | Train | 0.045 (300 sample in total) |
Predict | 0.000 | |
LSSVM | Train | 0.001 (300 sample in total) |
Predict | 0.000 |
As shown in Table 5, the average diagnosis time of the proposed method was approximately 2.042s. The calculation of IMRSVD, DE, and LSSVM requires a short computation time, and most of the computation time of the proposed method is based on the VMD. Although the SE-based method presented stable diagnostic accuracy in the previous analysis, the computation time of SE was much longer than that of DE. DE has significant advantages in terms of computation time. The LSSVM also has advantages in terms of computation time.
All the above results indicate that the proposed method has advantages in terms of both fault diagnosis accuracy and calculation time. The proposed method is suitable for fault diagnosis of planetary gears.
5. Conclusions
The operating conditions of a planetary gearbox are complex, and the vibration signal usually contains high noise. Signal processing and feature extraction are key issues in fault diagnosis of planetary gearboxes. A fault diagnosis method based on IMRSVD, VMD-DE, and LSSVM with multi-channel vibration data is proposed in this paper. Firstly, IMRSVD was proposed to process the original vibration signal to extract the characteristic frequencies. Secondly, a feature extraction method based on VMD and DE was proposed. Finally, the LSSVM was applied for fault classification. The following conclusions were drawn from the experimental studies:
1) The IMRSVD can effectively remove interference and extract useful features that reflect the operational characteristics of the planetary gearbox. Fault diagnosis based on IMRSVD also has higher diagnostic accuracy than fault diagnosis without IMRSVD.
2) DE required less calculation time than SE and PE. At the same time, DE has a better expression of fault information, which leads to higher diagnosis accuracy.
3) Composite features based on multiple channels can improve diagnosis accuracy compared to single-channel features.
4) Analysis results indicate that the proposed method can effectively diagnose faults in terms of calculation time and diagnostic accuracy.
References
-
Z. Feng and M. Liang, “Fault diagnosis of wind turbine planetary gearbox under nonstationary conditions via adaptive optimal kernel time-frequency analysis,” Renewable Energy, Vol. 66, pp. 468–477, Jun. 2014, https://doi.org/10.1016/j.renene.2013.12.047
-
D. Liu, L. Cui, and W. Cheng, “Fault diagnosis of wind turbines under nonstationary conditions based on a novel tacho-less generalized demodulation,” Renewable Energy, Vol. 206, pp. 645–657, Apr. 2023, https://doi.org/10.1016/j.renene.2023.01.056
-
H. Hu, Y. Lv, R. Yuan, S. Xu, and W. Zhu, “A novel vibro-acoustic fault diagnosis approach of planetary gearbox using intrinsic wavelet integrated GE-EfficientNet,” Measurement Science and Technology, Vol. 35, No. 2, p. 025131, Feb. 2024, https://doi.org/10.1088/1361-6501/ad0afe
-
J. Yu and Y. He, “Planetary gearbox fault diagnosis based on data-driven valued characteristic multigranulation model with incomplete diagnostic information,” Journal of Sound and Vibration, Vol. 429, pp. 63–77, Sep. 2018, https://doi.org/10.1016/j.jsv.2018.05.020
-
D. Liu, L. Cui, and W. Cheng, “A review on deep learning in planetary gearbox health state recognition: methods, applications, and dataset publication,” Measurement Science and Technology, Vol. 35, No. 1, p. 012002, Jan. 2024, https://doi.org/10.1088/1361-6501/acf390
-
H. Li, Q. Zhang, X. Qin, and Y. Sun, “K-SVD-based WVD enhancement algorithm for planetary gearbox fault diagnosis under a CNN framework,” Measurement Science and Technology, Vol. 31, No. 2, p. 025003, Feb. 2020, https://doi.org/10.1088/1361-6501/ab4488
-
A. Zhang, J. Huang, J. Wei, and Y. Pang, “Research of fault diagnosis of planetary gearbox based on EMD-SVD and PNN,” (in Chinese), Journal of Mechanical Transmission, Vol. 42, No. 12, pp. 160–165, 2018, https://doi.org/10.16578/j.issn.1004.2539.2018.12.030
-
D. He, L. Gan, Z. Lei, Q. Deng, and J. He, “Fault diagnosis of cross-roller bearings based on MRSVD-SVD and VPMCD,” (in Chinese), Journal of Mechanical and Electrical Engineering, Vol. 40, No. 1, pp. 47–54, 2023, https://doi.org/10.3969/issn.1001.4551.2023.01.006
-
I. Nouioua, N. Amardjia, and S. Belilita, “A novel blind and robust video watermarking technique in fast motion frames based on SVD and MR-SVD,” Security and Communication Networks, Vol. 2018, No. 1, pp. 1–17, Nov. 2018, https://doi.org/10.1155/2018/6712065
-
H. Liang, X. Xu, H. Pan, and Z. Fu, “Gearbox composite fault diagnosis based on MRSVD energy characteristic and KFCM,” (in Chinese), Journal of Mechanical Transmission, Vol. 43, No. 9, pp. 128–132, 2019, https://doi.org/10.16578/j.issn.1004.2539.2019.09.022
-
Y. Kong, T. Wang, and F. Chu, “Meshing frequency modulation assisted empirical wavelet transform for fault diagnosis of wind turbine planetary ring gear,” Renewable Energy, Vol. 132, pp. 1373–1388, Mar. 2019, https://doi.org/10.1016/j.renene.2018.09.027
-
J. Yao, C. Liu, K. Song, X. Zhang, and D. Jiang, “Fault detection of complex planetary gearbox using acoustic signals,” Measurement, Vol. 178, p. 109428, Jun. 2021, https://doi.org/10.1016/j.measurement.2021.109428
-
Z. Feng, M. Liang, Y. Zhang, and S. Hou, “Fault diagnosis for wind turbine planetary gearboxes via demodulation analysis based on ensemble empirical mode decomposition and energy separation,” Renewable Energy, Vol. 47, pp. 112–126, Nov. 2012, https://doi.org/10.1016/j.renene.2012.04.019
-
D. Jacek and R. Zimroz, “Empirical mode decomposition of vibration signal for detection of local disturbances in planetary gearbox used in heavy machinery system,” Key Engineering Materials, Vol. 588, pp. 109–116, Oct. 2013, https://doi.org/10.4028/www.scientific.net/kem.588
-
J. Liu, L. Wang, H. Tan, L. Wang, Z. Chen, and Y. Shao, “An extended EEMD method for localized faults detection of a planetary gearbox,” Journal of Testing and Evaluation, Vol. 47, No. 2, pp. 758–774, Feb. 2019, https://doi.org/10.1520/jte20180615
-
V. Sharma, “Gear fault detection based on instantaneous frequency estimation using variational mode decomposition and permutation entropy under real speed scenarios,” Wind Energy, Vol. 24, No. 3, pp. 246–259, Sep. 2020, https://doi.org/10.1002/we.2570
-
L. Liu, L. Chen, Z. Wang, and D. Liu, “Early fault detection of planetary gearbox based on acoustic emission and improved variational mode decomposition,” IEEE Sensors Journal, Vol. 21, No. 2, pp. 1735–1745, Jan. 2021, https://doi.org/10.1109/jsen.2020.3015884
-
C. Zhao and Z. Feng, “Application of multi-domain sparse features for fault identification of planetary gearbox,” Measurement, Vol. 104, pp. 169–179, Jul. 2017, https://doi.org/10.1016/j.measurement.2017.03.016
-
Y. Wei, Y. Yang, M. Xu, and W. Huang, “Intelligent fault diagnosis of planetary gearbox based on refined composite hierarchical fuzzy entropy and random forest,” ISA Transactions, Vol. 109, pp. 340–351, Mar. 2021, https://doi.org/10.1016/j.isatra.2020.10.028
-
Y. Li, K. Feng, X. Liang, and M. J. Zuo, “A fault diagnosis method for planetary gearboxes under non-stationary working conditions using improved Vold-Kalman filter and multi-scale sample entropy,” Journal of Sound and Vibration, Vol. 439, pp. 271–286, Jan. 2019, https://doi.org/10.1016/j.jsv.2018.09.054
-
J. Chen, C. Zhang, X. Zhang, Y. Zi, S. He, and Z. Yang, “Planetary gearbox condition monitoring of ship-based satellite communication antennas using ensemble multiwavelet analysis method,” Mechanical Systems and Signal Processing, Vol. 54-55, pp. 277–292, Mar. 2015, https://doi.org/10.1016/j.ymssp.2014.07.026
-
R. Liu et al., “Bearing fault diagnosis method based on variational mode decomposition optimized by CS-PSO,” Journal of Vibration and Control, Vol. 30, No. 5-6, pp. 973–987, Jan. 2023, https://doi.org/10.1177/10775463231154448
-
Y. Liu, B. Dan, C. Yi, T. Huang, and F. Zhang, “Self-matching extraction fractional wavelet transform for mechanical equipment fault diagnosis,” Measurement Science and Technology, Vol. 35, No. 3, p. 035102, Mar. 2024, https://doi.org/10.1088/1361-6501/ad108c
-
X. Yan, X. Hua, D. Jiang, and L. Xiang, “A novel robust intelligent fault diagnosis method for rolling bearings based on SPAVMD and WOA-LSSVM under noisy conditions,” Measurement Science and Technology, Vol. 35, No. 5, p. 056121, May 2024, https://doi.org/10.1088/1361-6501/ad29e3
-
R. Wu, C. Liu, T. Han, J. Yao, and D. Jiang, “A planetary gearbox fault diagnosis method based on time-series imaging feature fusion and a transformer model,” Measurement Science and Technology, Vol. 34, No. 2, p. 024006, Feb. 2023, https://doi.org/10.1088/1361-6501/ac9e6c
-
S. Cao, H. Li, K. Zhang, C. Yang, W. Xiang, and F. Sun, “A novel spiking graph attention network for intelligent fault diagnosis of planetary gearboxes,” IEEE Sensors Journal, Vol. 23, No. 12, pp. 13140–13154, Jun. 2023, https://doi.org/10.1109/jsen.2023.3269445
-
B. Han et al., “An attention mechanism-guided domain adversarial network for gearbox fault diagnosis under different operating conditions,” Transactions of the Institute of Measurement and Control, Vol. 46, No. 5, pp. 927–937, Aug. 2023, https://doi.org/10.1177/01423312231190435
-
R. Song, B. Yu, L. Yang, H. Shi, and Z. Dong, “SVM bearing fault diagnosis based on fast inter-class distance in the feature space and DMPSO algorithm,” Measurement Science and Technology, Vol. 35, No. 5, p. 055125, May 2024, https://doi.org/10.1088/1361-6501/ad29df
-
M. Strączkiewicz and T. Barszcz, “Application of artificial neural network for damage detection in planetary gearbox of wind turbine,” Shock and Vibration, Vol. 2016, pp. 1–12, Jan. 2016, https://doi.org/10.1155/2016/4086324
-
X. Qi, C. Cui, Y. Yang, Z. Cheng, and X. Chen, “Planetary gearbox fault diagnosis based on RTSMFE, M-KRCDA and COA-SVM,” (in Chinese), Journal of Vibration and Shock, Vol. 41, No. 21, pp. 109–120, 2022, https://doi.org/10.13465/j.cnki.jvs.2022.21.013
-
L. Lu, Y. He, Y. Ruan, and W. Yuan, “Wind turbine planetary gearbox condition monitoring method based on wireless sensor and deep learning approach,” IEEE Transactions on Instrumentation and Measurement, Vol. 70, pp. 1–16, Jan. 2021, https://doi.org/10.1109/tim.2020.3028402
About this article

This work was supported by Suqian Sci&Tech Program (Grant No. H202410), and National Natural Science Foundation of China (NSFC) (51709121).
The datasets generated during and/or analyzed during the current study are available from the corresponding author on reasonable request.
Xin Xia: methodology, formal analysis, investigation and writing. Xiaolu Wang: software and visualization.
The authors declare that they have no conflict of interest.
